Methods of distinguishing between vasoconstriction and vasodilation as a cause of hypotension
US20070179384A1
2007-08-02
10/591,309
2005-03-04
✅ Patent granted
US 7,442,169 B2
2008-10-28
WO; PCT/AU2005/000310; 20050304
WO; WO2005/084535; 20050915
Charles A. Marmor, II | Navin Natnithithadha
2025-03-04
Abstract:
The present invention relates to the use of the arterial pressure waveform recorded invasively or non-invasively, to distinguish between compensatory vasoconstriction with low cardiac output on the one hand from vasodilation from more severe organ damage on the other, as a cause of hypotension in acute emergencies. The waveforms may be subjected to harmonic analysis and the moduli of their harmonic components compared whereby a hypotensive individual can be confirmed to have the higher the first harmonic is considered as having vasoconstriction as a cause of hypotension.
Inventors:
- Michael Francis O'Rourke 2 🇦🇺 New South Wales, Australia
- Michael Francis O'Rourke 1 🇦🇺 Darlinghurst, Australia
Assignee:
- AtCor Medical Pty Limited 1 🇦🇺 New South Wales, Australia
Interested in similar patents?
Get notified when new applications in this technology area are published.
Classification:
A61B5/021 » CPC main
Measuring for diagnostic purposes ; Identification of persons; Detecting, measuring or recording pulse, heart rate, blood pressure or blood flow; Combined pulse/heart-rate/blood pressure determination; Evaluating a cardiovascular condition not otherwise provided for, e.g. using combinations of techniques provided for in this group with electrocardiography or electroauscultation; Heart catheters for measuring blood pressure Measuring pressure in heart or blood vessels
A61B5/02108 » CPC further
Measuring for diagnostic purposes ; Identification of persons; Detecting, measuring or recording pulse, heart rate, blood pressure or blood flow; Combined pulse/heart-rate/blood pressure determination; Evaluating a cardiovascular condition not otherwise provided for, e.g. using combinations of techniques provided for in this group with electrocardiography or electroauscultation; Heart catheters for measuring blood pressure; Measuring pressure in heart or blood vessels from analysis of pulse wave characteristics
A61B5/412 » CPC further
Measuring for diagnostic purposes ; Identification of persons; Detecting, measuring or recording for evaluating the immune or lymphatic systems Detecting or monitoring sepsis
A61B5/02 IPC
Measuring for diagnostic purposes ; Identification of persons Detecting, measuring or recording pulse, heart rate, blood pressure or blood flow; Combined pulse/heart-rate/blood pressure determination; Evaluating a cardiovascular condition not otherwise provided for, e.g. using combinations of techniques provided for in this group with electrocardiography or electroauscultation; Heart catheters for measuring blood pressure
Description
FIELD OF THE INVENTIONThe present invention relates to the use of the arterial pressure waveform recorded invasively or non-invasively, to distinguish between compensatory vasoconstriction with low cardiac output on the one hand from vasodilation from more severe organ damage on the other, as a cause of hypotension in acute emergencies.
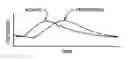
BACKGROUND ARTThe early work of Hamilton and colleagues (Am J Physiol 1944;141:235-41) during World War 2 showed the differences in pressure waveforms that are seen in hypotension, and how hypotension associated with vasodilation and secondary shock was associated with damped pressure waveforms and small or absent diastolic pressure fluctuations—see FIG. 1.
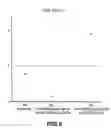
Subsequent work (O'Rourke M F, Am Heart J 1971;82:687-702, Nichols and O'Rourke, McDonald's Blood Flow in Arteries; Arnold, London 1998 p. 170-189) (FIG. 2) has shown repeatedly in humans and experimental animals, that acute blood loss or fall in cardiac output from other causes is associated with amplification of the peripheral pressure wave, with prominence in the diastolic components of these waves—See FIG. 2. This was attributed to a combination of vasoconstriction, causing increased wave reflection, together with shortening of systole caused by tachycardia, such that secondary pressure waves became unusually prominent.
Further studies on frequency components of the pressure and flow waveforms confirmed these explanations and raised the possibility that automatic methods could be applied to pressure waves to distinguish uncomplicated from complicated shock through identification of change in frequency components of the pressure waves as well as from change in the secondary fluctuations of the waveforms in the time domain.
SUMMARY OF THE INVENTIONAccording to one aspect of the invention there is provided a method for measuring (invasively or non-invasively) the arterial pressure waveform from a peripheral artery, recording those waveforms and identifying secondary pressure waveforms.
Preferably, a series of pressure waveforms are ensemble-averaged into a single waveform to provide consistency of waveform detail. The waveforms may be subjected to harmonic analysis and the moduli of their harmonic components compared whereby a hypotensive individual can be confirmed to have the higher (second and above) greater than the first harmonic is considered as having vasoconstriction as a cause of hypotension.
Furthermore, a hypotensive individual in sinus rhythm or without significant arrhythmia is confirmed to have the lowest fundamental harmonic, at heart rate less than 120/min, dominant over all other harmonics and can be concluded as likely to have vasodilatation as the cause of hypertension.
Preferably, in the hypotensive individual, amplitude of the primary wave (peak to wave foot) is compared to amplitude of the secondary waveform (secondary peak to wave foot) and the secondary wave confirmed to have amplitude less than 25% of the initial waveform as denoting hypotension due to vasodilation whereas amplitude of the secondary waveform greater than 30% of the initial wave denotes hypotension due to vasoconstriction and acute blood loss, cardiac failure, tamponade or pulmonary embolism.
BRIEF DESCRIPTION OF THE DRAWINGSFIG. 1 shows various pressure waveforms that are seen in hypotension,
FIG. 2 shows pressure waves recorded simultaneously in the aortic arch (lower amplitude wave) and brachial artery (higher amplitude tracing) of a human with hypotension and clinical features of peripheral vasoconstriction,
FIG. 3a shows the pressure waveform in a peripheral artery under normal conditions,
FIG. 3b shows the pressure waveform in a peripheral artery associated with vasoconstriction,
FIG. 3c shows the pressure waveform in a peripheral artery associated with vasodilation,
FIG. 4a shows the harmonic moduli of the pressure waveform of FIG. 3a,
FIG. 4b shows the harmonic moduli of the pressure waveform of FIG. 3b,
FIG. 4c shows the harmonic moduli of the pressure waveform of FIG. 3c,
FIG. 5a shows the ratio of pressure harmonies of the pressure moduli of FIG. 4a,
FIG. 5b shows the ratio of pressure harmonies of the pressure moduli of FIG. 4b, and
FIG. 5c shows the ratio of pressure harmonies of the pressure moduli of FIG. 4c.
MODES FOR CARRYING OUT THE INVENTIONThe present invention provides a method for determining whether hypotension in a critically ill individual is due to vasoconstriction (denoting blood or fluid loss or acute heart failure), or to vasodilation due to sepsis or organ failure.
The pressure waveform is determined accurately in a peripheral artery—preferably radial, brachial, axillary or femoral by direct puncture or by applanation tonometry or other validated method, and ensuring there is no obstruction to arteries upstream.
These pressure waveforms are recorded preferably by synchronising from a simultaneously-recorded ECG for ensemble analysis or from use of the rising limb of the pressure waveform itself.
The amplitude of the initial pressure waveform is compared with the amplitude of the secondary diastolic pressure wave in the time domain.
Harmonic analysis of the pressure waveforms is then performed and the harmonic moduli compared. FIG. 3a shows the pressure wave in a young man under normal conditions, FIG. 3b shows the pressure wave after blood loss associated with tachycardia, and 3c shows the same waves in the hypotensive state with system or organ failure.
FIGS. 4a to 4c show harmonic moduli under these three different conditions together with differences in amplitude of primary and secondary pressure waveforms.
FIGS. 5a to 5c show the ratio of harmonic moduli (H) of FIGS. 4a to 4c as follows:
FIG. 5a—the first harmonic is greater than the subsequent harmonics and the ratio
H
1
∑
(
H
2
to
H
5
)
approximates 0.5-1.0
FIG. 5b—the higher harmonics are dominant and the ratio
H
1
∑
(
H
2
to
H
5
)
is much less than 0.5
FIG. 5c—the first harmonic is completely dominant and the ratio:
H
1
∑
(
H
2
to
H
5
)
is much greater than 1.0
FIGS. 5a to 5c show how the hypotensive state due to blood or fluid loss or acute heart failure or tamponade can be separated from the hypotensive state caused by organ failure through comparison of the harmonic components of the waves. Under normal conditions, the first harmonic component is dominant over other harmonics, but higher harmonics are well represented in the pulse waveform—see FIG. 5a. In the second condition (vasoconstriction) the second and higher harmonics are dominant over the first—see FIG. 5b, whereas in the last condition (organ failure with vasodilation) the first harmonic at heart rate frequency is utterly dominant over all others—see FIG. 5c.
Various modifications may be made in details of the method without departing from the scope and ambit of the invention.
Claims
1. A method for measuring the arterial waveform invasively or non-invasively from a peripheral artery, wherein the waveforms are accurately recorded and secondary pressure waveforms are identified.
2. A method according to claim 1 wherein a series of pressure waveforms are ensemble-averaged into a single waveform to provide consistency of waveform detail.
3. A method according to claim 1 wherein the waveforms are subjected to harmonic analysis and moduli of their harmonic components are compared.
4. A method according to claim 1 wherein a hypotensive individual is confirmed to have the higher (second and above) greater than the first harmonic can be considered as having vasoconstriction as a cause of hypotension.
5. A method according to claim 1 wherein a hypotensive individual in sinus rhythm or without significant arrhythmia is confirmed to have the lowest fundamental harmonic, at heart rate less than 120/min, dominant over all the other harmonics and can be concluded as likely to have vasodilation as the cause of hypertension.
6. A method according to claim 1 wherein, in the hypotensive individual, amplitude of the primary waveform (peak to wave foot) is compared to amplitude of the secondary waveform (secondary peak to wave foot) and the secondary wave confirmed to have amplitude less than 25% of the primary waveform as denoting hypotension due to vasodilation whereas amplitude of the secondary waveform greater than 30% of the primary wave denotes hypotension due to vasoconstriction and acute blood loss, cardiac failure, tamponade or pulmonary embolism.
Images & Drawings included:


Sources:
- United States Patent and Trademark Office - verify current appl. status at the USPTO↗
Recent applications in this class:
- » 20250288214 2025-09-18
SYSTEM AND METHOD FOR OBTAINING BODILY FUNCTION MEASUREMENTS USING A MOBILE DEVICE - » 20250288213 2025-09-18
DEVICES AND METHODS FOR NON-INVASIVE MEASUREMENT OF INTRAVASCULAR PRESSURE - » 20250268481 2025-08-28
BIOLOGICAL STATE EVALUATION DEVICE, BIOLOGICAL STATE EVALUATION METHOD, COMPUTER PROGRAM, AND RECORDING MEDIUM - » 20250248607 2025-08-07
APPARATUS FOR QUICK DETECTION - » 20250241543 2025-07-31
WEARABLE DEVICE - » 20250213125 2025-07-03
Blood Pressure Monitoring Using a Multi-Function Wrist-Worn Device - » 20250194940 2025-06-19
DEVICE AND METHOD FOR ESTIMATING BLOOD PRESSURE IN NON-CONTACT MANNER - » 20250169703 2025-05-29
METHOD AND DEVICE FOR OBTAINING VASCULAR PRESSURE DIFFERENCE - » 20250152023 2025-05-15
RECONSTRUCTION OF A PATIENT-SPECIFIC CENTRAL ARTERIAL PRESSURE WAVEFORM MORPHOLOGY FROM A DISTAL NON-INVASIVE PRESSURE MEASUREMENT - » 20250143591 2025-05-08
SYSTEM AND METHODS FOR DETERMINING HEALTH-RELATED METRICS FROM COLLECTED PHYSIOLOGICAL DATA