METHODS FOR ANALYZING DIFFERENTIAL GENE EXPRESSION ASSOCIATED WITH MYELOPROLIFERATIVE DISORDERS (MPD) CANCER DISEASE
US20090286689A1
2009-11-19
11/953,899
2007-12-11
Abstract:
The present application relates to gene analysis and, in particular, to gene expression profiling for identifying molecular signature of cancer disease, in particular the G1 phase of the cell cycle, such as myeloproliferative disorders (MPD) or breast cancer and studying cancer.
More particularly, the application is directed to a method for analyzing differential gene expression associated with cancer disease, in particular the G1 phase of the cell cycle, such as myeloproliferative disorders (MPD) or breast cancer comprising detection of upregulation and/or downregulation of a pool of polynucleotide sequences in a cell or tissue sample, said pool corresponding to all or part the polynucleotide sequences, subsequences or complements thereof, of the genes listed in Tables 1, 2 and 3.
Inventors:
- Daniel Birnbaum 11 🇫🇷 Marseille, France
- Helene Lelievre 1 🇫🇷 Marseille, France
- Nathalie Cervera 1 🇫🇷 Bonnieux, France
Assignee:
- INSERM INSTITUT NATIONAL DE LA SANTE ET DE LA RECHERCHE MEDICALE) 521 🇫🇷 Paris, France
Interested in similar patents?
Get notified when new applications in this technology area are published.
Classification:
C12Q1/6886 » CPC main
Measuring or testing processes involving enzymes, nucleic acids or microorganisms ; Compositions therefor; Processes of preparing such compositions involving nucleic acids; Nucleic acid products used in the analysis of nucleic acids, e.g. primers or probes for diseases caused by alterations of genetic material for cancer
C12Q2600/106 » CPC further
Oligonucleotides characterized by their use Pharmacogenomics, i.e. genetic variability in individual responses to drugs and drug metabolism
C12Q2600/158 » CPC further
Oligonucleotides characterized by their use Expression markers
C12Q2600/178 » CPC further
Oligonucleotides characterized by their use miRNA, siRNA or ncRNA
C40B30/00 IPC
Methods of screening libraries
C12Q1/68 IPC
Measuring or testing processes involving enzymes, nucleic acids or microorganisms ; Compositions therefor; Processes of preparing such compositions involving nucleic acids
C40B40/06 IPC
Libraries , e.g. arrays, mixtures; Libraries containing only organic compounds Libraries containing nucleotides or polynucleotides, or derivatives thereof
Description
PRIORITY
This Application claims priority to U.S. Provisional Application No. 60/874,357 filed on 12 Dec. 2006; the entire contents of which are hereby incorporated herein by reference.
TECHNICAL FIELD
This disclosure relates to gene analysis and, in particular, to gene expression profiling for identifying molecular signature of cancer disease, in particular the G1 phase of the cell cycle, such as myeloproliferative disorders (MPD) or breast cancer and studying cancer.
BACKGROUND
Myeloproliferative disorders (MPD) are clonal proliferative diseases of the hematopoietic stem cells. After an initial phase they may progress to an acute syndrome. V617F mutation of the JAK2 kinase are found in polycythemia vera, essential thrombocythemia, and idiopathic myelofibrosis. BCR-ABL fusion occurs in chronic myeloid leukemia, and a variety of fusions involving PDGF and FGF receptors are found in other MPDs. Fusion kinases that result from a translocation are made of a constitutively activated kinase domain and an N-terminal region encoded by a partner gene. The activated kinase triggers sustained proliferation and survival of the hematopoietic cells but maturation is not affected.
Because of the side effects and risk of cancer therapy as well as resistance of certain patient to the treatment with certain drug, it would be desirable to offer new means to monitor cancer treatment and to be able to identify patients in need of such treatment.
SUMMARY
We provide methods for analyzing differential gene expression associated with cancer disease, more particularly, the G1 phase of the cell cycle such as myeloproliferative disorders (MPD) or breast cancer, comprising detecting the upregulation and/or downregulation of a pool of polynucleotide sequences in a cell or tissue sample, the pool corresponding to all or part the polynucleotide sequences, subsequences or complement thereof, of the genes listed in Tables 1, 2 and 3.
More particularly, the methods are carried out on a tumor cell or tissue sample. It may be any sample that may be taken from a patient, such as for example serum, plasma, urine or a biopsy sample.
Upregulation and/or downregulation of a pool of polynucleotide sequences according to the method of the present invention identify a molecular signature of activated MPD kinase.
Table 2 displays 188 upregulated genes/EST and table 3 displays 48 genes/EST downregulated in activated kinase-expressing cells.
Table 1 represents the most significant (p-value inferior at 2·10−2) and most often represented (including at least 3 genes) biological processes. Many of the upregulated genes encode nucleolar proteins involved in “ribosome biogenesis” (GO:0007046, 6 genes, p=4.28·10−11), “rRNA processing” (GO:0006364; 7 genes, p=3.07·10−11), and “protein biosynthesis” (GO:0006412, 9 genes, p=3.60·10−0.5).
Tables 1, 2 and 3 indicate the name of the gene (gene Symbol). We define the nucleotide sequences by the name of the gene or fragments thereof. Each polynucleotide sequence in Tables 2 and 3 may be considered as a marker of the corresponding gene. Each marker corresponds to a gene in the human genome, i.e., such marker is identifiable as all or a portion of a gene. Any RNA transcribed from a marker gene (mRNAs), any cDNA or cRNA produced therefrom, and any nucleic acid derived therefrom, such as synthetic nucleic acid having a sequence derived from the gene corresponding to the marker gene are also encompassed by the present invention.
A “pool of polynucleotide sequences” may comprise one or more sequences, preferably 2, 3, 4, 5, 6, 7, 8, 9, 10, 15, 20, 25, 30, 35, 40, 45, 50, 55, 60, 65, 70, 75, 80, 85, 90, 95, 100, 110, 120, 130, 140, 150, 160, 170, 180, 190, 200, 210, 220, 230, 240, 250, 260, 270, 280, 290, 300, 350, 400, 450, 500 sequences.
The number of genes may vary in the range of from 1 to the total number of genes described in Tables 1, 2 or 3, for example, 2, 3, 4, 5, 6, 7, 8, 9, 10, 15, 20, 25, 30, 35, 40, 45, 50, 55, 60, 65, 70, 75, 80, 85, 90, 95, 100, 110, 120, 130, 140, 150, 160, 170, 180, 188 genes, depending of the number of genes in said tables.
The pool of polynucleotide sequences may comprise the polynucleotide sequences, subsequences or complement thereof, of the genes listed in Tables 2. More particularly, the methods relate to upregulated genes encoding nucleolar proteins (CIRH1A, LARP1, NOL1, NOL11, NOL5, NOL5A, NOLA1, NOLA2, NOLC1, MKI67IP, SFRS2, SURF6), ribosomal proteins (RPL3, RPL12, RPL41, RPS9, RRS1), small nuclear ribonucleoproteins and interactors (U3/MPHOSPH10, LSM2, RNU22, RNU3IP2), components of RNA polymerase I (POLR1A, POLR1B), II (POLR2H, TAF9) and III (POLR3E, POLR3H), DEAD-box (DDX18, DDX56) and WD repeat (WDR4, WDR43, WDR74, WDR77, GRWD1, PWP1) proteins, eukaryotic initiation and elongation factors (EIF1A, EIF3S1, EIF3S4, EEF1E1), and components of the exosome (EXOSC1, EXOSC2, EXOSC6).
The genes also relate to upregulated genes encoding proteins of the NOL5A-associated preribosomal ribonucleoprotein complex involved in pre-rRNA processing: NOL5A, PPAN, NOLC1, and BXDC2. The gene encoding EBNA1BP2 was upregulated; it encodes a protein that binds to nucleolar FGF3 and is regularly upregulated in tumors.
The genes further relate to the most upregulated sequence GAS5, a non-protein-coding multiple small nucleolar RNA (snoRNA).
Other significant processed genes includes “protein folding” (4 genes), “ubiquitin-dependent protein catabolism” (3 genes), “nuclear mRNA splicing, via spliceosome” (3 genes), and “regulation of cell cycle” (3 genes).
A second major category of upregulated genes encode CCND2 (cyclin D2) and CDC25A, two major regulators needed for G1 progression.
Moreover, the list of upregulated genes included MYC. Many genes upregulated by MYC and NMYC oncogenes were also upregulated in our experiments, including CCND2, CDC25A and others (DDX18, EBNA1BP2, EEF1E1, MAT2A, MKI67IP, NOL5A, NOLA1, PHB, SFRS2, SHMT1, SLC16A1, SURF6, SRM, RPL3, RPL12, RPL41, RPS9 and RRS1).
The pool of polynucleotide sequences may include all or part the polynucleotide sequences, subsequences or complement thereof, of the genes listed in Tables 3. More particularly, the pool relates to downregulated genes encoding proteins with known or potential inhibitory function such as PIAS3, an inhibitor of STAT3, one of the main substrates of MPD kinases, and regulator of CDC25A, Erbin, and PLZF/ZBTB16, a MYC repressor.
The detection of over or under expression of polynucleotide sequences may be carried out by FISH or IHC. The detection may be performed on DNA microarrays. The level of the RNA transcripts can be measured by any available technique such as quantitative PCR.
We further provide a polynucleotide library useful for the molecular characterization of a cancer comprising or corresponding to a pool of polynucleotide sequences either upregulated or downregulated in tissue, said pool corresponding to all or part of the polynucleotide sequences selected as defined above.
The polynucleotide library may be immobilized on a solid support, for example selected from the group comprising nylon membrane, nitrocellulose membrane, glass slide, glass beads, membranes on glass support or silicon chip, plastic support.
We further provides a method for analysing differential gene expression associated with cancer disease, comprising:
-
- a) obtaining a polynucleotide sample from a patient, and
- b) reacting the polynucleotide sample obtained in step (a) with a polynucleotide library as defined above, and
- c) detecting the reaction product of step (b).
The polynucleotide sample may be labelled before reaction step (b). The label may be selected from the group consisting of at least one of radioactive, calorimetric, enzymatic, molecular amplification, bioluminescent or fluorescent labels. Preferably, the label is calorimetric, e.g., biotin or digoxygenin.
The method may further comprise:
-
- a) obtaining a control polynucleotide sample,
- b) reacting said control sample with the polynucleotide library, for example by hybridising the polynucleotide sample with the polynucleotide library,
- c) detecting a control sample reaction product, and
- d) comparing the amount of the polynucleotide sample reaction product to the amount of the control sample reaction product.
The polynucleotide sample may be cDNA, RNA or mRNA. The mRNA may be isolated from the polynucleotide sample and cDNA may be obtained by reverse transcription of said mRNA.
We further provide a method for determining the nature of a cancer from a cancer cell or tissue comprising the implementation of the method on nucleic acids from cells or tissues from a patient.
More particularly, the method is useful for profiling samples of various human MPDs. It may help define the initial steps of oncogenesis, for which G1 activation may be important. Cell quiescence may be defined by the absence of protein synthesis, whereas proliferation starts with nucleolar activity, ribosome biogenesis and rRNA processing. Second, MPDs can benefit from treatment targeting not only the activated kinases but also the PI3K/AKT/TOR signaling pathway and the G1 phase of the cell cycle, in synergy with anti-kinase drugs and/or in case of resistance. G1 targeting is frequent in many types of cancer. The signature can be used in transcriptome studies of any type of cancer to identify G1 activation, classify tumors, and use the appropriate drugs.
Therefore, we further provide a method of prognosis or diagnostic or prediction of tumours susceptible to a molecule acting on the G1 phase of the cell cycle such as rapamycine and its derivatives, and therefore we provide a method for monitoring the treatment of a patient with a cancer comprising the implementation of the method of analysis disclosed hereabove on nucleic acids from a patient to identify the corresponding signature.
We also provide a method of selection of patient susceptible to be treated with molecule acting on the G1 phase of the cell cycle such as rapamycine or its derivative, comprising the implementation of the method hereabove on nucleic acids from a patient in order to identify the corresponding signature.
This signature provides tools for classifying basal tumors for which the high proliferation results from the PI3K/TOR pathway. Therefore, we provide methods for determining whether a tumor has an activated proliferation according to PI3K/TOR and is sensitive to chemotherapy.
BRIEF DESCRIPTION OF THE DRAWING
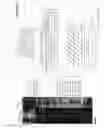
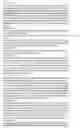
FIG. 1 shows gene expression profiling of Ba/F3 cell samples identifies a molecular signature of activated MPD kinases. A. Hierarchical clustering of 15 samples using the 294 genes identified as discriminator between Ba/F3 cells transfected by activated kinases (9 samples: BCR-ABL, 2 BCR-FGFR1, 2 CEP1-FGFR1, 2 FOP-FGFR1 and 2 V617F JAK2) to that of parental Ba/F3 cells (4 samples) and Ba/F3 expressing a kinase defective mutant of FOP-FGFR1 (2 samples). Each row represents a gene, each column a sample. The log2-transformed expression level of each gene in a single sample is relative to its median abundance across all samples and is depicted according to the colour scale shown at the bottom. Red and green indicate expression levels respectively above and below the median. The magnitude of deviation from the median is represented by the color saturation. The dendrogram of samples (above matrix) represents overall similarities in gene expression profiles and is zoomed in B. Branches of the dendrograms are color-coded as follows: red for fusion kinase-expressing Ba/F3 cells and green for control cells. Some genes included in the signature (framed in red for the upregulated genes and in green for the down-regulated genes) are noted to the right of the data matrix and referenced by their abbreviation as used in EntrezGene. A discriminating score (DS) was calculated for each gene. DS=(M1−M2)/(S1+S2) where M1 and S1 respectively represent mean and SD of expression levels of the gene in subgroup 1, and M2 and S2 in subgroup 2. Confidence levels were estimated by 100 random permutations of samples. A “leave-one-out” procedure estimated the accuracy of prediction of the signatures and the validity of our supervised analysis. B. Top, dendrogram of samples. Down, correlation between the molecular grouping based on the combined expression of the 294 genes and the status of samples. C. Western blot analysis of cyclin D2 in Ba/F3 expressing activated MPD kinases. NP40-extracted proteins were separated by gel electrophoresis (SDS-PAGE), transferred onto membrane (Hybond-C Extra, GE Healthcare UK, Buckinghamshire, UK), and probed with rabbit polyclonal anti-cyclin D2 (M-20, Santa Cruz Biotechnology, Santa Cruz, Calif.). Cyclin D2 (top) is upregulated in Ba/F3 cells expressing MPD kinases compared to control Ba/F3 cells (untransfected, FOP-FGFR1 KD, MIGR and JAK2 WT). Total cell lysates were probed with mouse monoclonal anti-α-tubulin (B-5-1-2, Sigma-Aldrich, Saint-Quentin Fallavier, France) to compare the amount of protein in the lysates (bottom).
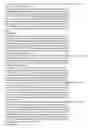
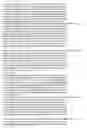
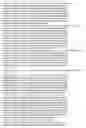
FIG. 2 provides the murine polynucleotide sequences from Ba/F3 cell line of the genes/EST listed in tables 1, 2 and 3 where the genes/EST are identified by their names and access numbers (Prob set).
DETAILED DESCRIPTION
Myeloproliferative disorders (MPD) are clonal hematopoietic diseases characterized by the proliferation and expansion of one or several myeloid cell lineages in the bone marrow. During the chronic phase, the cells follow their normal differentiation pathway and become mature blood cells. During a second phase, an acute syndrome may occur. The conventional classification separates MPDs in clinical entities. These include chronic myeloid leukemia (CML), chronic neutrophilic leukemia, chronic eosinophilic leukemia, polycythemia vera (PV), essential thrombocythemia (ET) and idiopathic myelofibrosis (IMF). MPDs with different syndromes and molecular abnormalities are grouped in non-classical MPDs. Systemic mastocytosis is not classically included in MPDs but is a related disease.
We studied the gene expression profiles of murine Ba/F3 cells transfected by various oncogenic MPD kinases by using whole-genome Affymetrix 430 2.0 mouse oligonucleotide microarrays (www.Affymetrix.com). Ba/F3 cells were grown in RPMI medium supplemented with 10% fetal calf serum (FCS) and IL3. Expression of an MPD kinase bypasses the IL3 dependence of Ba/F3 cells. RNA was extracted by using Trizol (Trizol Reagent, Invitrogen Life Technologies, Carlsbad, Calif.) from frozen pellets of: i)—Ba/F3 cells, ii)—Ba/F3 transfected with different pCDNA expression vectors expressing a mutant, kinase-defective FOP-FGFR1 KD or an oncogenic MPD kinase (BCR-ABL, FOP-FGFR1, CEP1-FGFR1, BCR-FGFR1), and iii)—Ba/F3 transfected by the MIGR vector, either empty (MIGR) or with JAK2 (JAK2 WT, mutated V617F JAK2 or mutated V617F IND JAK2 i.e. able to grow independently of IL3). Before RNA extraction, cells were starved for 7 hours in RPMI plus 0.5% FCS. RNA integrity was controlled by microanalysis (Agilent Bioanalyzer, Palo Alto, Calif.). Preparation of cRNA, hybridizations, washes, detection and quantification were done as recommended by the supplier (Affymetrix). Data were analyzed by the RMA (Robust Multichip Average) method in R using Bioconductor and associated package. Before analysis, a filtering process removed from the dataset the genes with low and poorly measured expression as defined by an expression value inferior to 100 units in all samples, retaining 17.885 genes/ESTs. For paired samples, RNA was prepared independently from different cultures of cells. The correlation between paired samples ranged between 0.97 and 0.98.
Gene expression profiles of Ba/F3 cells transfected by fusion or mutated kinases (9 samples: BCR-ABL, 2 BCR-FGFR1, 2 CEP1-FGFR1, 2 FOP-FGFR1, 2 V617F JAK2) were compared to that of control cells (6 samples) including parental Ba/F3 cells (4 samples) and Ba/F3 expressing a kinase-defective mutant of FOP-FGFR1 (2 samples). Supervised analysis, based on 17,885 filtered probe-sets, identified 294 differentially expressed probe sets (theoretical number of produced false positives=1.7) (FIGS. 1A, B), representing 228 genes and 8 ESTs, of which 188 were upregulated and 48 downregulated in activated kinase-expressing cells (Tables 2 and 3).
To translate the RNA expression profiles into functionality, discriminator genes/ESTs were interrogated by Onto-Express.7 Table 1 represents the most significant (p-value inferior at 3·10−2) and most often represented (including at least 3 genes) biological processes. Many of the upregulated genes encode nucleolar proteins involved in “ribosome biogenesis” (GO:0007046, 6 genes, p=4.28·10−11), “rRNA processing” (GO:0006364; 7 genes, p=3.07·10−11), and “protein biosynthesis” (GO:0006412, 9 genes, p=3.60·10−05). Upregulated genes encode nucleolar proteins (CIRH1A, LARP1, NOL1, NOL11, NOL5, NOL5A, NOLA1, NOLA2, NOLC1, MKI67IP, SFRS2, SURF6), ribosomal proteins (RPL3, RPL12, RPL41, RPS9, RRS1), small nuclear ribonucleoproteins and interactors (U3/MPHOSPH10, LSM2, RNU22, RNU3IP2), components of RNA polymerase I (POLR1A, POLR1B), II (POLR2H, TAF9) and III (POLR3E, POLR3H), DEAD-box (DDX18, DDX56) and WD repeat (WDR4, WDR43, WDR74, WDR77, GRWD1, PWP1) proteins, eukaryotic initiation and elongation factors (EIF1A, EIF3S1, EIF3S4, EEF1E1), and components of the exosome (EXOSC1, EXOSC2, EXOSC6). Upregulated genes also encode proteins of the NOL5A-associated preribosomal ribonucleoprotein complex involved in pre-rRNA processing: NOL5A, PPAN, NOLC1, and BXDC2. The gene encoding EBNA1BP2 was upregulated; it encodes a protein that binds to nucleolar FGF3 and is regularly upregulated in tumors. The most upregulated sequence was GAS5, a non-protein-coding multiple small nucleolar RNA (snoRNA).
Other significant processes included “protein folding” (GO:0006457; 4 genes, p=6.72·10−03), “ubiquitin-dependent protein catabolism” (GO:0006511, 3 genes, p=1.47·10−02), “nuclear mRNA splicing, via spliceosome” (GO:0000398, 3 genes, p=1.65·10−02), and “regulation of cell cycle” (GO:0000074, 3 genes, p=1.65·10−02). The second major category of upregulated genes encode CCND2 (cyclin D2) and CDC25A, two major regulators needed for G1 progression. CCND2 RNA was found upregulated by BCR-ABL in previous gene expression studies. Cyclin D2 is necessary for BCR-ABL-induced activity. Inhibition of V617F JAK2 correlates with decreased expression of cyclin D2. Other G1 cyclins may play a role in the oncogenic activity of fusion kinases but cyclin D2 seems to be a rate-limiting element. We used Western blot analysis to validate the differential expression of cyclin D2. The amount of cyclin D2 protein was increased in Ba/F3 cells expressing activated kinases as compared to controls (FIG. 1C), in agreement with mRNA expression results.
MYC directly or indirectly regulates the G1 phase of the cell cycle. The list of upregulated genes included MYC. Many genes upregulated by MYC and NMYC oncogenes were also upregulated in our experiments, including CCND2, CDC25A and others (DDX18, EBNA1BP2, EEF1E1, MAT2A, MKI67IP, NOL5A, NOLA1, PHB, SFRS2, SHMT1, SLC16A1, SURF6, SRM, RPL3, RPL12, RPL41, RPS9 and RRS1). This similarity suggests that MYC proteins and MPD kinases have similar oncogenic effects, whose main target would be the CDKN2-RB protein pathway during the G1 phase of the cell cycle. Once induced, MYC may in turn act on the transcription of G1/S regulators and genes involved in protein synthesis. MPD fusion kinases are thought to target the hematopoietic stem cell. Activation of MYC is in perfect agreement with what we know of stem cell proliferation. A similar program was also turned on by IL3 stimulation (not shown).
Downregulated genes were more difficult to classify with Onto-Express, but several encode proteins with known or potential inhibitory function such as PIAS3, an inhibitor of STAT3, one of the main substrates of MPD kinases, and regulator of CDC25A, Erbin, and PLZF/ZBTB16, a MYC repressor.
We tested the validity of our classification by the “leave-one-out” cross-validation method. Iteratively, one of the 15 samples was removed, and a multigene predictor was generated from the remaining samples: 93% of samples were correctly assigned by the predictors with a sensitivity of 89% and a specificity of 100%.
Thus, in Ba/F3 cells, MPD fusion kinases induce both G1 activators and protein synthesis components, thus starting the cell proliferation machinery. This effect may be mediated by the PI3 kinase-AKT-TOR pathway, which controls and coordinates both protein synthesis and early phases of the cell cycle. Prominent downstream targets of the AKT pathway are cyclins D1, D2 and MYC.
The subject matter of the references set forth below are hereby incorporated by reference in their entirety:
- 1. Percy M J, McMullin M F. The V617F JAK2 mutation and the myeloproliferative disorders. Hematol Oncol 2005; 23: 91-93.
- 2. Delaval B, Letard S, Lelievre H, Chevrier V, Daviet L, Dubreuil P, et al. Oncogenic tyrosine kinase of malignant hemopathy targets the centrosome. Cancer Res 2005; 65: 7231-7240.
- 3. De Keersmaecker K, Cools J. Chronic myeloproliferative disorders: a tyrosine kinase tale. Leukemia 2006; 20: 200-205.
- 4. Guasch G, Ollendorff V, Borg J P, Birnbaum D, Pebusque M J. 8p12 stem cell myeloproliferative disorder: the FOP-fibroblast growth factor receptor 1 fusion protein of the t(6;8) translocation induces cell survival mediated by mitogen-activated protein kinase and phosphatidylinositol 3-kinase/Akt/mTOR pathways. Mol Cell Biol 2001; 21: 8129-8142.
- 5. Staerk J, Kallin A, Demoulin J B, Vainchenker W, Constantinescu S N. JAK1 and Tyk2 activation by the homologous polycythemia vera JAK2 V617F mutation: cross-talk with IGF1 receptor. J Biol Chem 2005; 280: 41893-41899.
- 6. James C, Ugo V, Le Couedic J P, Staerk J, Delhommeau F, Lacout C, et al. A unique clonal JAK2 mutation leading to constitutive signalling causes polycythaemia vera. Nature 2005; 434: 1144-1148.
- 7. Lamond A, Mann M. Nucleolar Proteome Database v 2.0. 2005 [cited september 06]; Available from: www.lamondlab.com/NoPDB.
- 8. Butler J S. The yin and yang of the exosome. Trends Cell Biol 2002; 12: 90-96.
- 9. Hayano T, Yanagida M, Yamauchi Y, Shinkawa T, Isobe T, Takahashi N. Proteomic analysis of human Nop56p-associated pre-ribosomal ribonucleoprotein complexes. Possible link between Nop56p and the nucleolar protein treacle responsible for Treacher Collins syndrome. J Biol Chem 2003; 278: 34309-34319.
- 10. Reimers K, Antoine M, Zapatka M, Blecken V, Dickson C, Kiefer P. NoBP, a nuclear fibroblast growth factor 3 binding protein, is cell cycle regulated and promotes cell growth. Mol Cell Biol 2001; 21: 4996-5007.
- 11. Pilarsky C, Wenzig M, Specht T, Saeger H D, Grutzmann R. Identification and validation of commonly overexpressed genes in solid tumors by comparison of microarray data. Neoplasia 2004; 6: 744-750.
- 12. Smith C M, Steitz J A. Classification of gas5 as a multi-small-nucleolar-RNA (snoRNA) host gene and a member of the 5′-terminal oligopyrimidine gene family reveals common features of snoRNA host genes. Mol Cell Biol 1998; 18: 6897-6909.
- 13. Parada Y, Banerji L, Glassford J, Lea N C, Collado M, Rivas C, et al. BCR-ABL and interleukin 3 promote haematopoietic cell proliferation and survival through modulation of cyclin D2 and p27Kip1 expression. J Biol Chem 2001; 276: 23572-23580.
- 14. Deininger M W, Vieira S, Mendiola R, Schultheis B, Goldman J M, Melo J V. BCR-ABL tyrosine kinase activity regulates the expression of multiple genes implicated in the pathogenesis of chronic myeloid leukemia. Cancer Res 2000; 60: 2049-2055.
- 15. Jena N, Deng M, Sicinska E, Sicinski P, Daley G Q. Critical role for cyclin D2 in BCR/ABL-induced proliferation of hematopoietic cells. Cancer Res 2002; 62: 535-541.
- 16. Walz C, Crowley B J, Hudon H E, Gramlich J L, Neuberg D S, Podar K, et al. Activated JAK2 with the V617F point mutation promotes G1/S-phase transition. J Biol Chem 2006.
- 17. Nasi S, Ciarapica R, Jucker R, Rosati J, Soucek L. Making decisions through Myc. FEBS Lett 2001; 490: 153-162.
- 18. Bouchard C, Thieke K, Maier A, Saffrich R, Hanley-Hyde J, Ansorge W, et al. Direct induction of cyclin D2 by Myc contributes to cell cycle progression and sequestration of p27. Embo J 1999; 18: 5321-5333.
- 19. Perez-Roger I, Kim S H, Griffiths B, Sewing A, Land H. Cyclins D1 and D2 mediate myc-induced proliferation via sequestration of p27(Kip1) and p21(Cip1). Embo J 1999; 18: 5310-5320.
- 20. Coller H A, Grandori C, Tamayo P, Colbert T, Lander E S, Eisenman R N, et al. Expression analysis with oligonucleotide microarrays reveals that MYC regulates genes involved in growth, cell cycle, signaling, and adhesion. Proc Natl Acad Sci USA 2000; 97: 3260-3265.
- 21. Zeller K I, Jegga A G, Aronow B J, O'Donnell K A, Dang C V. An integrated database of genes responsive to the Myc oncogenic transcription factor: identification of direct genomic targets. Genome Biol 2003; 4: R69.
- 22. Schlosser I, Holzel M, Hoffmann R, Burtscher H, Kohlhuber F, Schuhmacher M, et al. Dissection of transcriptional programmes in response to serum and c-Myc in a human B-cell line. Oncogene 2005; 24: 520-524.
- 23. Boon K, Caron H N, van Asperen R, Valentijn L, Hermus M C, van Sluis P, et al. N-myc enhances the expression of a large set of genes functioning in ribosome biogenesis and protein synthesis. Embo J 2001; 20: 1383-1393.
- 24. Steiner P, Rudolph B, Muller D, Eilers M. The functions of Myc in cell cycle progression and apoptosis. Prog Cell Cycle Res 1996; 2: 73-82.
- 25. Moore K A, Lemischka I R. Stem cells and their niches. Science 2006; 311: 1880-1885.
- 26. Barre B, Vigneron A, Coqueret O. The STAT3 transcription factor is a target for the Myc and riboblastoma proteins on the Cdc25A promoter. J Biol Chem 2005; 280: 15673-15681.
- 27. McConnell M J, Chevallier N, Berkofsky-Fessler W, Giltnane J M, Malani R B, Staudt L M, et al. Growth suppression by acute promyelocytic leukemia-associated protein PLZF is mediated by repression of c-myc expression. Mol Cell Biol 2003; 23: 9375-9388.
- 28. Golub T R, Slonim D K, Tamayo P, Huard C, Gaasenbeek M, Mesirov J P, et al. Molecular classification of cancer: class discovery and class prediction by gene expression monitoring. Science 1999; 286: 531-537.
- 29. Ruggero D, Sonenberg N. The Akt of translational control. Oncogene 2005; 24: 7426-7434.
- 30. Gera J F, Mellinghoff I K, Shi Y, Rettig M B, Tran C, Hsu J H, et al. AKT activity determines sensitivity to mammalian target of rapamycin (mTOR) inhibitors by regulating cyclin D1 and c-myc expression. J Biol Chem 2004; 279: 2737-2746.
- 31. Malumbres M, Barbacid M. To cycle or not to cycle: a critical decision in cancer. Nat Rev Cancer 2001; 1: 222-231.
| TABLE 1 |
| Selection of discriminant genes classified by Onto-Express |
| Discriminating | |||||
| GO ID | Biological process | P-value | Gene Symbol | Probe set | Score |
| GO:0006364 | rRNA processing | 3.07E−11 | Nola1 | 1418305_s_at | 2.10 |
| Exosc2 | 1426630_at | 1.96 | |||
| Rnu3ip2 | 1451293_at | 1.46 | |||
| Mphosph10 | 1429080_at | 1.42 | |||
| Ddx56 | 1423815_at | 1.41 | |||
| Ebna1bp2 | 1428315_at | 1.31 | |||
| Exosc1 | 1452012_a_at | 1.31 | |||
| GO:0007046 | ribosome biogenesis | 4.82E−11 | Rpl12 | 1435655_at | 1.73 |
| 1110017C15Rik | 1448480_at | 1.63 | |||
| Rrs1 | 1456865_x_at | 1.63 | |||
| Nol5a | 1426533_at | 1.59 | |||
| Gtpbp4 | 1450873_at | 1.40 | |||
| 2610012O22Rik | 1423823_at | 1.30 | |||
| GO:0006412 | protein biosynthesis | 3.60E−05 | Rpl41 | 1454639_x_at | 1.90 |
| Mrps18b | 1451164_a_at | 1.82 | |||
| Rpl3 | 1438527_at | 1.79 | |||
| Rps9 | 1426958_at | 1.69 | |||
| Eif3s1 | 1426394_at | 1.53 | |||
| Nola2 | 1416605_at | 1.51 | |||
| Itgb4bp | 1427578_a_at | 1.47 | |||
| Eef1e1 | 1449044_at | 1.45 | |||
| Eif3s4 | 1417718_at | 1.38 | |||
| GO:0006457 | protein folding | 6.72E−03 | Dnajc11 | 1433880_at | 1.38 |
| Cct3 | 1448178_a_at | 1.33 | |||
| Ero1l | 1419030_at | 1.32 | |||
| Hyou1 | 1423291_s_at | 1.31 | |||
| GO:0006511 | ubiquitin-dependent | 1.47E−02 | Usp39 | 1437007_x_at | 1.51 |
| protein catabolism | Siah2 | 1448171_at | 1.30 | ||
| Usp10 | 1448230_at | 1.29 | |||
| GO:0000398 | nuclear mRNA splicing, | 1.65E−02 | Mki67ip | 1424001_at | 1.88 |
| via spliceosome | Pprc1 | 1426381_at | 1.86 | ||
| Sfrs2 | 1415807_s_at | 1.46 | |||
| GO:0000074 | regulation of cell cycle | 1.65E−02 | Axl | 1423586_at | 1.65 |
| Ccnd2 | 1430127_a_at | 1.51 | |||
| Cdc25a | 1417132_at | 1.43 | |||
| TABLE 2 |
| 188 upregulated genes/EST associated with their biological process ordered by discriminating score |
| Onto- | |||||
| Discriminating | Express P | ||||
| Probe set | Gene Symbol | Score | GO ID | Onto-Express Biological Process | value |
| 1455904_at | Gas5 | 3.32 | null | unknownP | 0.33 |
| 1435998_at | na | 3.03 | null | unknownP | 0.33 |
| 1416345_at | Timm8a | 2.57 | GO:0006626 | protein-mitochondrial targeting | 0.00 |
| 1455643_s_at | AW550801 | 2.32 | null | unknownP | 0.33 |
| 1429061_at | 1810063B05Rik | 2.29 | null | unknownP | 0.33 |
| 1425177_at | Shmt1 | 2.28 | GO:0006563 | L-serine metabolism | 0.00 |
| 1423138_at | Wdr4 | 2.25 | GO:0008033 | tRNA processing | 0.02 |
| 1416376_at | 1810014L12Rik | 2.21 | null | unknownP | 0.33 |
| 1456117_at | 2600005C20Rik | 2.14 | null | unknownP | 0.33 |
| 1428529_at | 2810026P18Rik | 2.12 | null | unknownP | 0.33 |
| 1418305_s_at | Nola1 | 2.10 | GO:0006364 | rRNA processing | 0.00 |
| 1451509_at | Taf9 | 2.10 | GO:0006352 | transcription initiation | 0.00 |
| 1454214_a_at | 2410019A14Rik | 2.10 | null | unknownP | 0.33 |
| 1425820_x_at | Gpatc4 | 2.08 | null | unknownP | 0.33 |
| 1433467_at | Slc7a6 | 2.03 | GO:0006810 | transport | 0.20 |
| 1441415_at | Spred2 | 2.02 | GO:0000188 | inactivation of MAPK | 0.00 |
| 1426630_at | Exosc2 | 1.96 | GO:0006364 | rRNA processing | 0.00 |
| 1437592_x_at | 1700023O11Rik | 1.93 | null | unknownP | 0.33 |
| 1424620_at | D13Wsu177e | 1.92 | null | unknownP | 0.33 |
| 1455832_a_at | Umps | 1.91 | GO:0006221 | pyrimidine nucleotide biosynthesis | 0.00 |
| 1421260_a_at | Srm | 1.91 | GO:0008295 | spermidine biosynthesis | 0.00 |
| 1428869_at | Nolc1 | 1.90 | GO:0007000 | nucleolus organization and biogenesis | 0.00 |
| 1454639_x_at | Rpl41 | 1.90 | GO:0006412 | protein biosynthesis | 0.00 |
| 1424001_at | Mki67ip | 1.88 | GO:0000398 | nuclear mRNA splicing, via spliceosome | 0.02 |
| 1435544_at | Exosc6 | 1.87 | GO:0000004 | biological process unknown | 0.02 |
| 1425830_a_at | 2810452K22Rik | 1.87 | null | unknownP | 0.33 |
| 1426381_at | Pprc1 | 1.86 | GO:0000398 | nuclear mRNA splicing, via spliceosome | 0.02 |
| 1438015_at | BC068171 | 1.84 | null | unknownP | 0.33 |
| 1451164_a_at | Mrps18b | 1.82 | GO:0006412 | protein biosynthesis | 0.00 |
| 1416890_at | Wdr74 | 1.81 | null | unknownP | 0.33 |
| 1415834_at | Dusp6 | 1.81 | GO:0006470 | protein amino acid dephosphorylation | 0.02 |
| 1438527_at | Rpl3 | 1.79 | GO:0006412 | protein biosynthesis | 0.00 |
| 1424151_at | MGI: 2385237 | 1.79 | GO:0000004 | biological process unknown | 0.02 |
| 1426554_a_at | Pgam1 | 1.79 | GO:0006096 | glycolysis | 0.04 |
| 1455841_s_at | Grwd1 | 1.77 | null | unknownP | 0.33 |
| 1417873_at | Pwp1 | 1.75 | null | unknownP | 0.33 |
| 1452099_at | AA408296 | 1.75 | null | unknownP | 0.33 |
| 1422484_at | Cycs | 1.74 | GO:0008635 | caspase activation via cytochrome c | 0.00 |
| 1416070_a_at | Ddx18 | 1.74 | null | unknownP | 0.33 |
| 1435655_at | Rpl12 | 1.73 | GO:0007046 | ribosome biogenesis | 0.00 |
| 1428390_at | Wdr43 | 1.72 | null | unknownP | 0.33 |
| 1434773_a_at | Slc2a1 | 1.71 | GO:0008643 | carbohydrate transport | 0.00 |
| 1429268_at | 2610318N02Rik | 1.70 | null | unknownP | 0.33 |
| 1426958_at | Rps9 | 1.69 | GO:0006412 | protein biosynthesis | 0.00 |
| 1437658_a_at | Rnu22 | 1.69 | null | unknownP | 0.33 |
| 1419518_at | Tuba8 | 1.69 | GO:0051258 | protein polymerization | 0.01 |
| 1423703_at | Ppan | 1.68 | GO:0001560 | regulation of cell growth by extracellular stimulus | 0.00 |
| 1426931_s_at | D19Bwg1357e | 1.67 | null | unknownP | 0.33 |
| 1418225_at | Orc2l | 1.67 | GO:0006260 | DNA replication | 0.03 |
| 1415802_at | Slc16a1 | 1.66 | GO:0015711 | organic anion transport | 0.00 |
| 1423586_at | Axl | 1.65 | GO:0000074 | regulation of cell cycle | 0.02 |
| 1450387_s_at | Ak3 | 1.65 | GO:0006139 | nucleobase, nucleoside, nucleotide and nucleic acid metabolism | 0.00 |
| 1423884_at | Cirh1a | 1.65 | null | unknownP | 0.33 |
| 1429897_a_at | D16Ertd472e | 1.64 | null | unknownP | 0.33 |
| 1416445_at | 2810405J04Rik | 1.63 | null | unknownP | 0.33 |
| 1448480_at | 1110017C15Rik | 1.63 | GO:0007046 | ribosome biogenesis | 0.00 |
| 1428970_at | Mak3 | 1.63 | null | unknownP | 0.33 |
| 1449886_a_at | Timm9 | 1.63 | GO:0006626 | protein-mitochondrial targeting | 0.00 |
| 1456865_x_at | Rrs1 | 1.63 | GO:0007046 | ribosome biogenesis | 0.00 |
| 1452902_at | 2610209N15Rik | 1.62 | GO:0008152 | metabolism | 0.05 |
| 1423161_s_at | Spred1 | 1.60 | GO:0000188 | inactivation of MAPK | 0.00 |
| 1448140_at | Ciapin1 | 1.60 | GO:0030097 | hemopoiesis | 0.02 |
| 1426533_at | Nol5a | 1.59 | GO:0007046 | ribosome biogenesis | 0.00 |
| 1427997_at | 1110007M04Rik | 1.58 | null | unknownP | 0.33 |
| 1448450_at | Ak2 | 1.58 | GO:0006139 | nucleobase, nucleoside, nucleotide and nucleic acid metabolism | 0.00 |
| 1446771_at | na | 1.57 | null | unknownP | 0.33 |
| 1452047_at | Cacybp | 1.55 | GO:0006512 | ubiquitin cycle | 0.12 |
| 1417064_at | Jagn1 | 1.55 | null | unknownP | 0.33 |
| 1424344_s_at | Eif1a | 1.54 | null | unknownP | 0.33 |
| 1424473_at | Polr2h | 1.54 | GO:0006350 | transcription | 0.14 |
| 1433996_at | Suv39h2 | 1.54 | GO:0006333 | chromatin assembly or disassembly | 0.02 |
| 1426394_at | Eif3s1 | 1.53 | GO:0006412 | protein biosynthesis | 0.00 |
| 1428694_at | 5033413D16Rik | 1.53 | null | unknownP | 0.33 |
| 1434033_at | Tle1 | 1.53 | GO:0007222 | frizzled signaling pathway | 0.01 |
| 1425921_a_at | 1810055G02Rik | 1.52 | null | unknownP | 0.33 |
| 1440120_at | Gnb2l1 | 1.52 | GO:0007205 | protein kinase C activation | 0.01 |
| 1452094_at | P4ha1 | 1.52 | GO:0018401 | peptidyl-proline hydroxylation to 4-hydroxy-L-proline | 0.00 |
| 1439071_at | 5430416N02Rik | 1.51 | null | unknownP | 0.33 |
| 1437007_x_at | Usp39 | 1.51 | GO:0006511 | ubiquitin-dependent protein catabolism | 0.01 |
| 1416605_at | Nola2 | 1.51 | GO:0006412 | protein biosynthesis | 0.00 |
| 1433576_at | Mat2a | 1.51 | GO:0006556 | S-adenosylmethionine biosynthesis | 0.00 |
| 1430127_a_at | Ccnd2 | 1.51 | GO:0000074 | regulation of cell cycle | 0.02 |
| 1417675_a_at | Mdn1 | 1.51 | null | unknownP | 0.33 |
| 1429612_at | Eml4 | 1.50 | GO:0000004 | biological process unknown | 0.02 |
| 1450011_at | Hsd17b12 | 1.50 | GO:0006694 | steroid biosynthesis | 0.04 |
| 1451254_at | Ikbkap | 1.50 | GO:0000004 | biological process unknown | 0.02 |
| 1448563_at | Phb | 1.50 | GO:0006259 | DNA metabolism | 0.04 |
| 1432164_a_at | Gcsh | 1.49 | GO:0006546 | glycine catabolism | 0.00 |
| 1423730_at | C130052I12Rik | 1.49 | null | unknownP | 0.33 |
| 1420056_s_at | Ptdsr | 1.49 | GO:0006915 | apoptosis | 0.04 |
| 1450914_at | Ppp1r14b | 1.48 | null | unknownP | 0.33 |
| 1427578_a_at | Itgb4bp | 1.47 | GO:0006412 | protein biosynthesis | 0.00 |
| 1453745_at | 2700038G22Rik | 1.47 | null | unknownP | 0.33 |
| 1415807_s_at | Sfrs2 | 1.46 | GO:0000398 | nuclear mRNA splicing, via spliceosome | 0.02 |
| 1447403_a_at | Zmynd19 | 1.46 | null | unknownP | 0.33 |
| 1451293_at | Rnu3ip2 | 1.46 | GO:0006364 | rRNA processing | 0.00 |
| 1434574_at | 9430008C03Rik | 1.46 | null | unknownP | 0.33 |
| 1424545_at | BC003965 | 1.45 | null | unknownP | 0.33 |
| 1449044_at | Eef1e1 | 1.45 | GO:0006412 | protein biosynthesis | 0.00 |
| 1435339_at | Kctd15 | 1.45 | null | unknownP | 0.33 |
| 1453195_at | Sdccag3 | 1.44 | null | unknownP | 0.33 |
| 1417132_at | Cdc25a | 1.43 | GO:0000087 | M phase of mitotic cell cycle | 0.00 |
| 1434398_at | 9430034D17Rik | 1.43 | GO:0006355 | regulation of transcription, DNA-dependent | 0.05 |
| 1453983_a_at | 2810013M15Rik | 1.43 | null | unknownP | 0.33 |
| 1417233_at | Chchd4 | 1.43 | GO:0000004 | biological process unknown | 0.02 |
| 1448135_at | Atf4 | 1.43 | GO:0006094 | gluconeogenesis | 0.01 |
| 1424942_a_at | Myc | 1.42 | GO:0008633 | activation of pro-apoptotic gene products | 0.00 |
| 1424019_at | Nol1 | 1.42 | GO:0000004 | biological process unknown | 0.02 |
| 1416962_at | Rcc1 | 1.42 | null | unknownP | 0.33 |
| 1429080_at | Mphosph10 | 1.42 | GO:0006364 | rRNA processing | 0.00 |
| 1422844_a_at | Wdr77 | 1.41 | null | unknownP | 0.33 |
| 1419058_at | Praf1 | 1.41 | null | unknownP | 0.33 |
| 1423815_at | Ddx56 | 1.41 | GO:0006364 | rRNA processing | 0.00 |
| 1416864_at | Surf6 | 1.41 | null | unknownP | 0.33 |
| 1416559_at | 1500003O22Rik | 1.40 | null | unknownP | 0.33 |
| 1434316_at | Chsy1 | 1.40 | GO:0030206 | chondroitin sulfate biosynthesis | 0.00 |
| 1449348_at | Mpp6 | 1.40 | null | unknownP | 0.33 |
| 1450873_at | Gtpbp4 | 1.40 | GO:0007046 | ribosome biogenesis | 0.00 |
| 1451459_at | Ahctf1 | 1.40 | null | unknownP | 0.33 |
| 1433530_at | 2210411K19Rik | 1.40 | null | unknownP | 0.33 |
| 1418571_at | Tnfrsf12a | 1.39 | GO:0006931 | substrate-bound cell migration, cell attachment to substrate | 0.00 |
| 1437238_x_at | Nmd3 | 1.39 | null | unknownP | 0.33 |
| 1428248_at | Nfx1 | 1.39 | GO:0045347 | negative regulation of MHC class II biosynthesis | 0.00 |
| 1448617_at | Cd53 | 1.39 | null | unknownP | 0.33 |
| 1424227_at | Polr3h | 1.39 | GO:0006101 | citrate metabolism | 0.00 |
| 1433656_a_at | Gnl3 | 1.39 | null | unknownP | 0.33 |
| 1426939_at | 2310007F12Rik | 1.39 | null | unknownP | 0.33 |
| 1418079_at | Psme3 | 1.39 | null | unknownP | 0.33 |
| 1448126_at | MGI: 1929091 | 1.38 | GO:0000004 | biological process unknown | 0.02 |
| 1415733_a_at | 1110019J04Rik | 1.38 | null | unknownP | 0.33 |
| 1433880_at | Dnajc11 | 1.38 | GO:0006457 | protein folding | 0.01 |
| 1417718_at | Eif3s4 | 1.38 | GO:0006412 | protein biosynthesis | 0.00 |
| 1416563_at | Ctps | 1.38 | GO:0006221 | pyrimidine nucleotide biosynthesis | 0.00 |
| 1426311_s_at | Zdhhc5 | 1.37 | null | unknownP | 0.33 |
| 1416750_at | Oprs1 | 1.37 | null | unknownP | 0.33 |
| 1448568_a_at | Slc20a1 | 1.36 | GO:0006817 | phosphate transport | 0.04 |
| 1452753_at | Foxk2 | 1.36 | null | unknownP | 0.33 |
| 1420463_at | MGI: 1351468 | 1.36 | GO:0007169 | transmembrane receptor protein tyrosine kinase signaling pathway | 0.07 |
| 1425837_a_at | Ccrn4l | 1.36 | GO:0048511 | rhythmic process | 0.01 |
| 1434168_at | Peo1 | 1.36 | GO:0006268 | DNA unwinding | 0.00 |
| 1416448_at | Itpa | 1.36 | GO:0009117 | nucleotide metabolism | 0.02 |
| 1434660_at | Alkbh | 1.36 | GO:0000004 | biological process unknown | 0.02 |
| 1417035_at | Sac3d1 | 1.35 | null | unknownP | 0.33 |
| 1423480_at | Nol11 | 1.35 | null | unknownP | 0.33 |
| 1424436_at | Gart | 1.35 | GO:0009113 | purine base biosynthesis | 0.00 |
| 1450698_at | Dusp2 | 1.35 | GO:0006470 | protein amino acid dephosphorylation | 0.02 |
| 1454659_at | Dctd | 1.35 | GO:0006220 | pyrimidine nucleotide metabolism | 0.00 |
| 1438198_at | Bri3bp | 1.35 | null | unknownP | 0.33 |
| 1431182_at | Hspa8 | 1.34 | GO:0051085 | chaperone cofactor dependent protein folding | 0.00 |
| 1426426_at | Rbm13 | 1.34 | null | unknownP | 0.33 |
| 1416126_at | Rpo1-2 | 1.34 | GO:0006350 | transcription | 0.14 |
| 1424522_at | Heatr1 | 1.34 | null | unknownP | 0.33 |
| 1428244_at | Larp1 | 1.33 | null | unknownP | 0.33 |
| 1429456_a_at | Polr3e | 1.33 | GO:0006350 | transcription | 0.14 |
| 1456066_a_at | Rpo1-4 | 1.33 | GO:0006350 | transcription | 0.14 |
| 1448178_a_at | Cct3 | 1.33 | GO:0006457 | protein folding | 0.01 |
| 1451385_at | 2310056P07Rik | 1.33 | null | unknownP | 0.33 |
| 1440205_at | na | 1.32 | null | unknownP | 0.33 |
| 1418566_s_at | Nudcd2 | 1.32 | null | unknownP | 0.33 |
| 1419030_at | Ero1l | 1.32 | GO:0006457 | protein folding | 0.01 |
| 1452203_at | 5830411E10Rik | 1.32 | GO:0006260 | DNA replication | 0.03 |
| 1437052_s_at | Slc2a3 | 1.32 | GO:0008643 | carbohydrate transport | 0.00 |
| 1417726_at | Sssca1 | 1.32 | null | unknownP | 0.33 |
| 1422767_at | Bysl | 1.31 | GO:0007155 | cell adhesion | 0.34 |
| 1423291_s_at | Hyou1 | 1.31 | GO:0006457 | protein folding | 0.01 |
| 1452172_at | 2810421I24Rik | 1.31 | null | unknownP | 0.33 |
| 1437630_at | D16Bwg1547e | 1.31 | null | unknownP | 0.33 |
| 1424244_at | Rwdd4a | 1.31 | null | unknownP | 0.33 |
| 1417212_at | 9530058B02Rik | 1.31 | null | unknownP | 0.33 |
| 1428315_at | Ebna1bp2 | 1.31 | GO:0006364 | rRNA processing | 0.00 |
| 1436007_a_at | Thumpd1 | 1.31 | GO:0000004 | biological process unknown | 0.02 |
| 1439027_at | C330023M02Rik | 1.31 | null | unknownP | 0.33 |
| 1452012_a_at | Exosc1 | 1.31 | GO:0006364 | rRNA processing | 0.00 |
| 1450986_at | Nol5 | 1.31 | GO:0006608 | snRNP protein-nucleus import | 0.00 |
| 1423705_at | 2310057D15Rik | 1.30 | GO:0008152 | metabolism | 0.05 |
| 1456738_s_at | Brp16 | 1.30 | GO:0000004 | biological process unknown | 0.02 |
| 1451884_a_at | Lsm2 | 1.30 | null | unknownP | 0.33 |
| 1421089_a_at | 2610028A01Rik | 1.30 | null | unknownP | 0.33 |
| 1451016_at | Ifrd2 | 1.30 | GO:0030154 | cell differentiation | 0.10 |
| 1423841_at | Bxdc2 | 1.30 | null | unknownP | 0.33 |
| 1416022_at | Fabp5 | 1.30 | GO:0006656 | phosphatidylcholine biosynthesis | 0.00 |
| 1423823_at | 2610012O22Rik | 1.30 | GO:0007046 | ribosome biogenesis | 0.00 |
| 1448171_at | Siah2 | 1.30 | GO:000651 1 | ubiquitin-dependent protein catabolism | 0.01 |
| 1448413_at | 2410016O06Rik | 1.29 | GO:0042254 | ribosome biogenesis and assembly | 0.00 |
| 1456672_at | AA408556 | 1.29 | null | unknownP | 0.33 |
| 1416442_at | Ier2 | 1.29 | GO:0000004 | biological process unknown | 0.02 |
| 1457083_at | Prpf31 | 1.29 | GO:0000351 | assembly of spliceosomal tri-snRNP U4/U6.U5 | 0.00 |
| 1448230_at | Usp10 | 1.29 | GO:0006511 | ubiquitin-dependent protein catabolism | 0.01 |
| indicates data missing or illegible when filed |
| TABLE 3 |
| 48 genes/EST downregulated in fusion kinase-expressing Ba/F3 cells. |
| Probe sets are ordered by increasing discriminating s |
| Onto- | |||||
| Discriminating | Express P | ||||
| Probe Set | Gene Symbol | Score | GO ID | Onto-Express Biological Process | value |
| 1438038_at | 4930402H24Rik | −2.301840428 | null | unknownP | 2.04E−01 |
| 1459101_at | C78760 | −1.937260526 | null | unknownP | 2.04E−01 |
| 1430185_at | 5830460E08Rik | −1.899962271 | null | unknownP | 2.04E−01 |
| 1459557_at | Zbtb16 | −1.889802945 | GO:0035136 | forelimb morphogenesis | 8.32E−05 |
| 1425603_at | 0610011I04Rik | −1.885885791 | null | unknownP | 2.04E−01 |
| 1418411_at | Fbxl8 | −1.884189604 | GO:0006512 | ubiquitin cycle | 3.08E−03 |
| 1447901_x_at | Sfi1 | −1.797938879 | null | unknownP | 2.04E−01 |
| 1451115_at | Pias3 | −1.778033499 | GO:0006512 | ubiquitin cycle | 3.08E−03 |
| 1416538_at | Ysg2 | −1.728551325 | null | unknownP | 2.04E−01 |
| 1441885_s_at | na | −1.666293232 | null | unknownP | 2.04E−01 |
| 1417896_at | Tjp3 | −1.580284643 | null | unknownP | 2.04E−01 |
| 1439857_at | Usp32 | −1.555573141 | null | unknownP | 2.04E−01 |
| 1449354_at | U2af1-rs1 | −1.548084764 | null | unknownP | 2.04E−01 |
| 1441319_at | Rbm5 | −1.54504959 | GO:0000004 | biological process unknown | 9.65E−02 |
| 1430896_s_at | Nudt7 | −1.534925926 | GO:0015938 | coenzyme A catabolism | 2.08E−05 |
| 1446598_at | Prkca | −1.532847936 | null | unknownP | 2.04E−01 |
| 1447105_at | na | −1.518779997 | null | unknownP | 2.04E−01 |
| 1424906_at | Pqlc3 | −1.511859109 | nuil | unknownP | 2.04E−01 |
| 1442427_at | 9630026M06Rik | −1.507828387 | null | unknownP | 2.04E−01 |
| 1448104_at | Aldh6a1 | −1.506711706 | GO:0008152 | metabolism | 1.28E−02 |
| 1419557_a_at | Tmem9 | −1.497471971 | GO:0006810 | transport | 2.31E−01 |
| 1429351_at | Klhl24 | −1.483148711 | nuil | unknownP | 2.04E−01 |
| 1434193_at | Zmym6 | −1.457894796 | null | unknownP | 2.04E−01 |
| 1434581_at | na | −1.455433574 | null | unknownP | 2.04E−01 |
| 1417218_at | 2810048G17Rik | −1.43831543 | null | unknownP | 2.04E−01 |
| 1440897_at | na | −1.438296402 | null | unknownP | 2.04E−01 |
| 1447112_s_at | Cryl1 | −1.438004747 | GO:0006631 | fatty acid metabolism | 4.77E−03 |
| 1434060_at | Herc1 | −1.434063158 | null | unknownP | 2.04E−01 |
| 1417066_at | Cabc1 | −1.431967873 | GO:0006457 | protein folding | 2.98E−02 |
| 1442315_at | AI426778 | −1.428334819 | null | unknownP | 2.04E−01 |
| 1438155_x_at | Pigo | −1.42673405 | GO:0009117 | nucleotide metabolism | 2.23E−03 |
| 1433593_at | Ypel5 | −1.42626537 | GO:0000004 | biological process unknown | 9.65E−02 |
| 1455602_x_at | C430010P07Rik | −1.42303244 | null | unknownP | 2.04E−01 |
| 1460257_a_at | Mthfs | −1.422588883 | G0:0008152 | metabolism | 1.28E−02 |
| 1447738_s_at | Ankrd13d | −1.421336365 | null | unknownP | 2.04E−01 |
| 1439079_a_at | Erbb2ip | −1.412999179 | GO:0006605 | protein targeting | 1.91E−02 |
| 1429689_at | 4932433N03Rik | −1.412810128 | null | unknownP | 2.04E−01 |
| 1421948_a_at | 2610507L03Rik | −1.397036044 | null | unknownP | 2.04E−01 |
| 1438415_s_at | Yipf2 | −1.390341353 | null | unknownP | 2.04E−01 |
| 1425684_at | 2310005E10Rik | −1.378218217 | null | unknownP | 2.04E−01 |
| 1435345_at | 2600006K01Rik | −1.375904328 | null | unknownP | 2.04E−01 |
| 1434670_at | Kif5a | −1.361096401 | GO:0007018 | microtubule-based movement | 5.89E−03 |
| 1424988_at | Mylip | −1.359416183 | GO:0006512 | ubiquitin cycle | 3.08E−03 |
| 1428447_at | Tmem14a | −1.356743685 | null | unknownP | 2.04E−01 |
| 1424621_at | AA792894 | −1.355659364 | null | unknownP | 2.04E−01 |
| 1448625_at | Golga2 | −1.352622502 | null | unknownP | 2.04E−01 |
| 1444235_at | na | −1.351686534 | null | unknownP | 2.04E−01 |
| 1440533_at | Bfar | −1.347482782 | GO:0006916 | anti-apoptosis | 5.98E−03 |
| indicates data missing or illegible when filed |
Claims
1) A method for analyzing differential gene expression associated with cancer disease, in particular the G1 phase of the cell cycle, such as myeloproliferative disorders (MPD) or breast cancer comprising detection of upregulation and/or downregulation of a pool of polynucleotide sequences in a cell or tissue sample, said pool corresponding to all or part the polynucleotide sequences, subsequences or complements thereof, of the genes listed in Tables 1, 2 and 3.
2) The method according to claim 1 wherein the predefined polynucleotide sequences correspond to all or part of the 188 upregulated genes/EST of Table 2.
3) The method according to claim 1 wherein the predefined polynucleotide sequences correspond to all or part of the 48 downregulated genes/EST of Table 3.
4) The method according to claim 1 wherein the detection of the upregulation of a pool of polynucleotide sequences is performed on a pool of polynucleotide sequences selected from at least one of the genes encoding nucleolar proteins (CIRH1A, LARP1, NOL1, NOL11, NOL5, NOL5A, NOLA1, NOLA2, NOLC1, MKI67IP, SFRS2, SURF6), ribosomal proteins (RPL3, RPL12, RPL41, RPS9, RRS1), small nuclear ribonucleoproteins and interactors (U3/MPHOSPH10, LSM2, RNU22, RNU3IP2), components of RNA polymerase I (POLR1A, POLR1B), II (POLR2H, TAF9) and III (POLR3E, POLR3H), DEAD-box (DDX18, DDX56) and WD repeat (WDR4, WDR43, WDR74, WDR77, GRWD1, PWP1) proteins, eukaryotic initiation and elongation factors (EIF1A, EIF3S1, EIF3S4, EEF1E1), and components of the exosome (EXOSC1, EXOSC2, EXOSC6).
5) The method according to claims 1 or 4, wherein the detection of the upregulation of a pool of polynucleotide sequences is performed on a pool of polynucleotide sequences selected from at least one of the genes encoding proteins of the NOL5A-associated preribosomal ribonucleoprotein complex involved in pre-rRNA processing: NOL5A, PPAN, NOLC1, and BXDC2.
6) The method according to any of claims 1 or 4, wherein the detection of the upregulation of a pool of polynucleotide sequences is performed on a pool of polynucleotide sequences comprising the gene encoding EBNA1BP2.
7) The method according to any of claims 1 or 4, wherein the detection of the upregulation of a pool of polynucleotide sequences is performed on a pool of polynucleotide sequences comprising the gene encoding GAS5, a non-protein-coding multiple small nucleolar RNA (snoRNA).
8) The method according to any of claims 1 or 4, wherein the detection of the upregulation of a pool of polynucleotide sequences is performed on a pool of polynucleotide sequences selected from at least one of the genes encoding protein folding, ubiquitin-dependent protein catabolism, nuclear mRNA splicing via spliceosome and regulation of cell cycle.
9) The method according to any of claims 1 or 4, wherein the detection of the upregulation of a pool of polynucleotide sequences is performed on a pool of polynucleotide sequences selected from the genes encoding CCND2 (cyclin D2) and CDC25A.
10) The method according to any of claims 1 or 4, wherein the detection of the upregulation of a pool of polynucleotide sequences is performed on a pool of polynucleotide sequences comprising at least one of the MYC genes, such as CCND2, CDC25A, DDX18, EBNA1BP2, EEF1E1, MAT2A, MKI67IP, NOL5A, NOLA1, PHB, SFRS2, SHMT1, SLC16A1, SURF6, SRM, RPL3, RPL12, RPL41, RPS9 and RRS1.
11) The method according to claim 1 wherein the detection of the downregulation of a pool of polynucleotide sequences is performed on a pool of polynucleotide sequences comprising the gene encoding PIAS3.
12) A method according to claim 1, wherein said detection is performed on nucleic acids from a tissue sample.
13) A method according to claim 1, wherein said detection is performed on nucleic acids from a tumor cell line.
14) A method according to of claim 1, wherein said detection is performed on DNA microarrays.
15) A polynucleotide library that molecularly characterizes a cancer comprising or corresponding to a pool of polynucleotide sequences either upregulated or down-regulated, said pool corresponding to all or part of the polynucleotide sequences selected from the genes defined in claim 1.
16) A polynucleotide library according to claim 15 immobilized on a solid support.
17) A polynucleotide library according to claim 16 wherein the support is selected from the group comprising at least one of nylon membrane, nitrocellulose membrane, glass slide, glass beads, membranes on glass support or silicon chip, plastic support.
18) A method of prognosis or diagnostic of cancer or for monitoring the treatment of a patient with a cancer comprising the implementation of the method according to claim 1 on nucleic acids from a patient.
19) A method for analysing differential gene expression associated with cancer disease, comprising:
a) obtaining a polynucleotide sample from a patient,
b) reacting said polynucleotide sample obtained in step (a) with a polynucleotide library as defined in claim 15, and
c) detecting the reaction product of step (b).
20) The method according to claim 19 further comprising:
a) obtaining a control polynucleotide sample,
b) reacting said control sample with said polynucleotide library, for example by hybridising the polynucleotide sample with the polynucleotide library,
c) detecting a control sample reaction product, and
d) comparing the amount of said polynucleotide sample reaction product to the amount of said control sample reaction product.
21) A method of prognosis or diagnostic or prediction of tumours susceptible to molecule acting on the G1 phase of the cell cycle, comprising the implementation of the method according to claim 1 on nucleic acids from a patient in order to identify the corresponding signature.
22) The method according to claim 21, wherein the molecule acting on the G1 phase of the cell cycle is rapamycine or its derivatives.
23) A method for monitoring the treatment of a patient with a cancer comprising the implementation of a method according to claim 1 on nucleic acids from a patient.
24) A method of selecting a patient susceptible to be treated with rapamycine and its derivatives or molecule acting on the G1 phase of the cell cycle, comprising the implementation of the method according to claim 1 on nucleic acids from the patient to identify the corresponding signature.
25) The method according to claim 24, wherein the molecule acting on the G1 phase of the cell cycle is rapamycine or its derivatives.
Images & Drawings included:


Sources:
- United States Patent and Trademark Office - verify current appl. status at the USPTO↗
Recent applications in this class:
- » 20250171861 2025-05-29
MULTIPLE-TIERED SCREENING AND SECOND ANALYSIS - » 20250171860 2025-05-29
THERANOSTIC TOOLS FOR MANAGEMENT OF PANCREATIC CANCER AND ITS PRECURSORS - » 20250171859 2025-05-29
DETECTING MUTATIONS AND PLOIDY IN CHROMOSOMAL SEGMENTS - » 20250171858 2025-05-29
ENRICHMENT OF CLINICALLY-RELEVANT NUCLEIC ACIDS - » 20250171857 2025-05-29
BIOMARKERS FOR DIAGNOSING OR PREDICTING PROGNOSIS OF NON-INVASIVE FOLLICULAR THYROID NEOPLASM WITH PAPILLARY-LIKE NUCLEAR FEATURES AND METHOD FOR TREATMENT OF THYROID NODULE - » 20250171856 2025-05-29
METHODS OF ASSESSING THE RISK FOR THE DEVELOPMENT OF A CONDITION IN A UVEAL MELANOMA (UVM) PATIENT - » 20250171855 2025-05-29
METHODS FOR DETERMINING CETUXIMAB SENSITIVITY IN CANCER PATIENTS - » 20250171854 2025-05-29
GENETIC SIGNATURES TO PREDICT PROSTATE CANCER METASTASIS AND IDENTIFY TUMOR AGGRESSIVENESS - » 20250171853 2025-05-29
BIOMARKER FOR PREDICTING THE PROGNOSIS OF COLORECTAL CANCER - » 20250163517 2025-05-22
METHODS FOR SEQUENCING SAMPLES
Recent applications for this Assignee:
- » 20250075247 2025-03-06
METHOD FOR DETERMINING THE METHICILLIN RESISTANCE OF STAPHYLOCOCCUS AUREUS STRAINS - » 20250041221 2025-02-06
NANOPARTICLES FOR RELEASE OF NUCLEIC ACIDS - » 20250040942 2025-02-06
STATISTICAL METHODS AND SYSTEMS FOR DETECTING PERFORATIONS DURING SURGICAL DRILLING BASED ON SENSED ELECTRICAL CHARACTERISTICS - » 20240424015 2024-12-26
Low-Molecular-Weight HE800 Exopolysaccharide Derivatives with Anti-Cancer Properties and Uses Thereof - » 20240400695 2024-12-05
METHODS FOR PROMOTING T CELLS RESPONSE - » 20240371520 2024-11-07
Prediction of BRCAness/Homologous Recombination Deficiency of Breast Tumors on Digitalized Slides - » 20240360510 2024-10-31
DETECTION OF KDM1A LOSS OF ACTIVITY FOR DIAGNOSING ENDOCRINE DISORDERS - » 20240317814 2024-09-26
Hybrid Recombinant Adeno-Associated Virus Serotype Between AAV9 and AAVrh74 with Reduced Liver Tropism - » 20240294880 2024-09-05
STABLE CLONAL CELL LINE AS A HBV RNA STANDARD - » 20240269282 2024-08-15
Methods for the Treatment of Cancer, Inflammatory Diseases and Autoimmune Diseases