Computer-aided diagnosis and visualization of tomosynthesis mammography data
US20100166267A1
2010-07-01
12/344,451
2008-12-26
✅ Patent granted
US 8,184,890 B2
2012-05-22
-
-
David Mis
2030-07-10
Abstract:
The present invention provides a method and system using computer-aided detection (CAD) algorithms to aid diagnosis and visualization of tomosynthesis mammography data. The proposed CAD algorithms process two-dimensional and three-dimensional tomosynthesis mammography images and identify regions of interest in breasts. The CAD algorithms include the steps of preprocessing; candidate detection of potential regions of interest; and classification of each region of interest to aid reading by radiologists. The detection of potential regions of interest utilizes two dimensional projection images for generating candidates. The resultant candidates in two dimensional images are back-projected into the three dimensional volume images. The feature extraction for classification operates in the three dimensional image in the neighborhood of the back-projected candidate location. The forward-projection and back-projection algorithms are used for visualization of the tomosynthesis mammography data in a fashion of synchronized MPR and VR.
Inventors:
- Heidi Daoxian ZHANG 10 🇺🇸 Los Gatos, CA, United States
- Patrick Bernard Heffernan 9 🇺🇸 Los Gatos, CA, United States
- Heidi Zhang 7 🇺🇸 Los Gatos, CA, United States
- Patrick Heffernan 6 🇺🇸 Los Gatos, CA, United States
Assignee:
- THREE PALM SOFTWARE 12 🇺🇸 Los Gatos, CA, United States
Interested in similar patents?
Get notified when new applications in this technology area are published.
Classification:
A61B6/463 » CPC main
Apparatus for radiation diagnosis, e.g. combined with radiation therapy equipment with special arrangements for interfacing with the operator or the patient; Displaying means of special interest characterised by displaying multiple images or images and diagnostic data on one display
A61B6/502 » CPC further
Apparatus for radiation diagnosis, e.g. combined with radiation therapy equipment; Clinical applications involving diagnosis of breast, i.e. mammography
A61B6/5235 » CPC further
Apparatus for radiation diagnosis, e.g. combined with radiation therapy equipment; Devices using data or image processing specially adapted for radiation diagnosis involving processing of medical diagnostic data combining image data of a patient, e.g. combining a functional image with an anatomical image combining images from the same or different ionising radiation imaging techniques, e.g. PET and CT
G06T7/0012 » CPC further
Image analysis; Inspection of images, e.g. flaw detection Biomedical image inspection
G06T2207/10081 » CPC further
Indexing scheme for image analysis or image enhancement; Image acquisition modality; Tomographic images Computed x-ray tomography [CT]
G06T2207/30068 » CPC further
Indexing scheme for image analysis or image enhancement; Subject of image; Context of image processing; Biomedical image processing Mammography; Breast
Y10S128/922 » CPC further
Surgery; Computer assisted medical diagnostics including image analysis
A61B6/00 IPC
Apparatus for radiation diagnosis, e.g. combined with radiation therapy equipment
G06K9/00 IPC
Methods or arrangements for recognising patterns
Description
CROSS-REFERENCE TO RELATED APPLICATIONS
U.S. Patent Documents
- 1. US 2006/0177125 A1 Chan et al. “Computerized detection of breast cancer on digital tomosynthesis mammograms”
- 2. U.S. Pat. No. 6,748,044 B2 June 2004 Sabol et al. “Computer assisted analysis of tomographic mammography data”
- 3. U.S. Pat. No. 6,707,878 B2 March 2004 Claus et al. “Generalized filtered back-projection reconstruction in digital tomosynthesis”
- 4. U.S. Pat. No. 6,375,352 B1 April 2002 Hewes et al. “Apparatus and method for obtaining X-ray tomosynthesis data for mammography”
Other Publications
STATEMENT REGARDING FEDERALLY SPONSORED RESEARCH OR DEVELOPMENT
Not Applicable.
REFERENCE TO SEQUENCE LISTING, A TABLE, OR A COMPUTER PROGRAM LISTING COMPACT DISC APPENDIX
Not Applicable
BACKGROUND OF THE INVENTION
The present invention relates generally to medical imaging procedures. Particularly, the present invention relates to the method and system for utilizing computer-aided detection and diagnosis (CAD) algorithms and visualization techniques in conjunction with tomosynthesis mammography.
The U.S. patent Classification Definitions: 382/154 (class 382, Image Analysis, subclass 154 3D or Stereo Imaging Analysis); 378/37 (class 378, X-Ray or Gamma Ray System or Devices, subclass 37 Mammography); 382/706 (class 382 Image Analysis, subclass 706 Data Processing: Intelligent Processing Systems and Methods).
A tomosynthesis system for forming a three dimensional image of an object includes an X-ray source that radiates the object with a beam of X-rays from a plurality of projection angles, an X-ray detector positioned relative to the X-ray source to detect X-rays transmitted through the object. In this invention, the plural projection images based on X-rays detected by the detector and/or its three dimensional reconstruction image of the object are considered as the tomosynthesis mammography data.
Compared to conventional two-dimensional X-ray mammography, tomosynthesis mammography generates a much larger amount data for radiologists to read. Therefore it is desirable to develop computer-aided detection and diagnosis (CAD) algorithms and visualization techniques to assist radiologists to interpret tomosynthesis mammography studies.
BRIEF SUMMARY OF THE INVENTION
CAD algorithms applied to mammography images are basically comprised of three steps: (1) preprocessing to remove artifacts in images and segment the breast tissue area for later processing; (2) identifying potential regions of interest, such as, abnormal density areas in breast, or clusters of bright microcalcification spots; (3) extracting features of the identified regions in order to produce classification information, such as, probability of cancer or benign findings.
Traditional CAD algorithms perform image processing either in two dimensional mammography projection images, or in three dimensional reconstructed volume images alone. This invention proposes combining two dimensional and three dimensional image processing methods to visualize tomosynthesis mammography data and to identify and analyze the regions of interest in patient breast objects. The detection of potential regions of interest utilizes two dimensional projection images for generating candidates. The resultant candidates in two dimensional images are back-projected to the three dimensional volume data. The feature extraction for classification operates in the three dimensional image in the neighborhood of the back-projected candidate location.
The potential regions of interest are displayed in the three dimensional volume data and/or the two dimensional projection images. Visualization of an entire data set uses multi-plane reformatting (MPR) of the volume data in one of three fixed directions, or in an arbitrary direction as indicated by the user. Visualization of a region of interest uses volume rendering (VR). Visualization of multiple sets of data of a study, such as, MLO of right breast, MLO of left breast, CC of right breast and CC of left breast, uses “synchronized” MPR and VR amongst the multiple data sets. Visualization of multiple sets of data from temporal studies, such as, current mammography exam compared to prior mammography exams, uses “synchronized” MPR and VR amongst the multiple studies.
BRIEF DESCRIPTIONS OF THE DRAWINGS
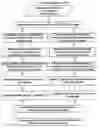
FIG. 1 is a flow-chart of the CAD algorithms.
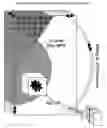
FIG. 2 shows tomosynthesis visualization of a single data set.
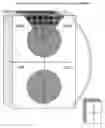
FIG. 3 shows tomosynthesis visualization of multi-data sets.
DETAILED DESCRIPTION OF THE INVENTION
As shown in FIG. 1, the inputs to the tomosynthesis mammography CAD algorithms are 2D projection images from a group of projection angles and a 3D volume image which has been reconstructed from the 2D projection images. The first step of the algorithm processing is to find the skin line in order to segment the breast tissue area from the background area. All further processing will be performed inside the breast tissue. The next step is to select candidates on all 2D projection images. The candidates usually include mass density and microcalcification clusters within the mammograms. Next, all candidates are back-projected into the 3D volume using the same reconstructing filter. Due to the limited range of angles in the acquired data, back-projection errors may introduce “ghost” candidates. The ghost candidates can be merged or removed using similarity or dissimilarity criteria from the candidates in the 2D images. The 3D features around the candidates are extracted and the features are used to train and classify the candidate. The features include typical features that radiologists use to interpret 2D mammograms, which include shape, margin, density, and distribution. All these features are calculated in 3D.
The mass density candidates and microcalcification candidates are combined to process and generate diagnosis information, such as, probability of malignancy.
The CAD processing information can be used for visualization of the complete set of tomosynthesis data or regions of interest, either identified by the radiologist or detected by CAD. In FIG. 2, multi-planar reformatted images from a volume of 3D reconstructed data can be visualized in different directions using a mouse to scroll through each slice along the radiologist defined direction. A cube icon can be used to indicate the location of the current slice in the volume. An “angle” icon can be used to scroll through each original 2D projection image, which usually provides higher resolution or better 2D image quality. When a sub-region is identified by the radiologist, 3D volume rendering can be used to visualize and analyze the region of interest. Using the CAD forward and back projection information, the corresponding region of interest on 2D projection images can be correlated and displayed on the same screen with its 3D volume rendered image.
A typical screening mammography exam includes 4 acquisitions—bilateral breasts, each acquired in two views: cranial caudal (CC) view and medio-lateral oblique (MLO) view. Interpreting 4 acquisitions usually involves bilateral comparison between right CC and left CC views or right MLO and left MLO views in a synchronized style. Interpreting screening mammograms also involves comparison with prior exams. Thus the visualization of multiple volumes of 3D reconstructed data and multiple sets of 2D projection images needs to be synchronized, as is shown in FIG. 3.
Claims
1. A method using computer-aided detection (CAD) algorithms to aid diagnosis and visualization of tomosynthesis mammography data comprising:
CAD algorithm engine to process tomosynthesis data;
user interface to visualize tomosynthesis data.
2. The method of claim 1, wherein the said CAD algorithms comprising the following processing steps:
input tomosynthesis data set; where the data set includes 2D projections and 3D reconstruction;
segment breast tissue area on all 2D projection images;
detect mass density candidates and microcalcification cluster candidates in segmented breast area on all 2D projection images;
back-project the mass density candidates and microcalcification cluster candidate locations into the 3D reconstructed volume image;
merge mass density candidates to compensate for errors due to the limited number of angles used for back-projection;
merge microcalcification cluster candidates to compensate for errors due to the limited number of angles used for back-projection;
extract 3D features and classify each mass density candidate;
extract 3D features and classify each microcalcification cluster candidate;
combine the classified mass density candidates and the classified microcalcification cluster candidates;
analyze the combined candidates to provide detection and diagnosis information to radiologist.
3. The method of claim 1, wherein the said user interface to visualize tomosynthesis data including:
one or more volumes of reconstructed tomosynthesis image and one or more sets of 2D projection images from a plurality angles;
volume rendering of a region of interest extracted from the 3D volume data.
a pointer user interface (such as, mouse cursor) that defines a region of interest;
a scrolling user interface (such as, mouse wheel) that controls the direction of MPR or angle of projection.
4. The claim 3, wherein the said direction of MPR including any of the major axes of the reconstructed volume, or an arbitrary direction defined by using the said pointer user interface to move a cube side selection icon.
5. The claim 3, wherein the said projection angle including one of the 2D projections selected by using the said pointer user interface to move an angle selection icon.
6. The claim 3, wherein the said region of interest including a 3D region selected by the pointer interface.
7. The claim 3, wherein the said volume rendering including a rendered 2D projection of a 3D region of interest.
8. The claim 4, wherein the said MPR is synchronized across multiple volumes.
9. The claim 5, wherein the said 2D projection is synchronized across multiple data sets.
10. A system using computer-aided detection (CAD) algorithms to aid diagnosis and visualization of tomosynthesis mammography data comprising:
CAD algorithm engine to process both 2D and 3D tomosynthesis data;
user interface to visualize tomosynthesis data using MPR and VR.
Images & Drawings included:

Sources:
- United States Patent and Trademark Office - verify current appl. status at the USPTO↗
Recent applications in this class:
- » 20250281134 2025-09-11
MEDICAL INFORMATION PROCESSING DEVICE, MEDICAL INFORMATION PROCESSING METHOD, AND STORAGE MEDIUM - » 20250281133 2025-09-11
PANORAMIC X-RAY IMAGE DISPLAY APPARATUS - » 20250268548 2025-08-28
DISPLAY CONTROL APPARATUS, DISPLAY CONTROL METHOD, AND NON-TRANSITORY COMPUTER-READABLE RECORDING MEDIUM - » 20250261918 2025-08-21
X-RAY IMAGING SYSTEM AND X-RAY IMAGE DISPLAY METHOD - » 20250213207 2025-07-03
OPERATION IMAGE ALIGNMENT METHOD AND SYSTEM THEREOF - » 20250204876 2025-06-26
INFORMATION PROCESSING APPARATUS, OPERATION METHOD OF INFORMATION PROCESSING APPARATUS, AND PROGRAM - » 20250195021 2025-06-19
MEDICAL IMAGE DISPLAY APPARATUS, MEDICAL IMAGE DISPLAY SYSTEM, STORAGE MEDIUM, AND MEDICAL IMAGE DISPLAY METHOD - » 20250107764 2025-04-03
RADIOGRAPHIC IMAGING SYSTEM, INFORMATION PROCESSING DEVICE AND METHOD OF CONTROLLING SAME, AND PROGRAM - » 20250032072 2025-01-30
INFORMATION PROCESSING DEVICE, INFORMATION PROCESSING METHOD, AND PROGRAM - » 20250025119 2025-01-23
LUNG DIAGNOSIS USING DYNAMIC X-RAY IMAGING
Recent applications for this Assignee:
- » 20120257804 2012-10-11
COMMUNICATIVE CAD SYSTEM FOR ASSISTING BREAST IMAGING DIAGNOSIS - » 20110222752 2011-09-15
MICROCALCIFICATION ENHANCEMENT FROM DIGITAL MAMMOGRAMS - » 20090238422 2009-09-24
COMMUNICATIVE CAD SYSTEM FOR ASSISTING BREAST IMAGING DIAGNOSIS - » 20090238421 2009-09-24
IMAGE NORMALIZATION FOR COMPUTER-AIDED DETECTION, REVIEW AND DIAGNOSIS - » 20090220138 2009-09-03
Fast preprocessing algorithms for digital mammography CAD and workstation - » 20090185732 2009-07-23
User interface and viewing workflow for mammography workstation - » 20090171871 2009-07-02
Combination machine learning algorithms for computer-aided detection, review and diagnosis - » 20090165009 2009-06-25
OPTIMAL SCHEDULING FOR CAD ARCHITECTURE - » 20090154782 2009-06-18
DUAL-MAGNIFY-GLASS VISUALIZATION FOR SOFT-COPY MAMMOGRAPHY VIEWING - » 20080285825 2008-11-20
Mass spicules detection and tracing from digital mammograms