Method and apparatus for absorption spectra analysis
US20110040494A1
2011-02-17
12/744,404
2008-11-21
✅ Patent granted
US 8,847,163 B2
2014-09-30
WO; PCT/EP2008/065971; 20081121
WO; WO2009/068477; 20090604
David Porta | Faye Boosalis
2031-12-22
Abstract:
A method and apparatus is disclosed for resolving absorption spectra such as ultraviolet or visible spectra having individual peaks attributable to more than one component in a sample mixture. The invention exploits the observation that the peak wavelength varies according to the component concentrations, providing the basis for an initial estimate of these. A curve fitting exercise is performed for a range of possible concentrations encompassing the initial estimates so that the a theoretical spectrum having the closest match to that observed provides for a refined estimate of component concentrations.
Inventors:
- Kevin Anthony Foster 2 🇬🇧 Aylesford, United Kingdom
- Kevin Anthony Foster 1 🇬🇧 Aylesford Kent, United Kingdom
Assignee:
- Evoqua Water Technologies LLC 29 🇺🇸 Alpharetta, GA, United States
Applicant:
Interested in similar patents?
Get notified when new applications in this technology area are published.
Classification:
Y02A20/20 » CPC further
Water conservation; Efficient water supply; Efficient water use Controlling water pollution; Waste water treatment
G01N21/17 » CPC further
Investigating or analysing materials by the use of optical means, i.e. using sub-millimetre waves, infrared, visible or ultraviolet light Systems in which incident light is modified in accordance with the properties of the material investigated
G01J3/42 » CPC further
Spectrometry; Spectrophotometry; Monochromators; Measuring colours; Investigating the spectrum Absorption spectrometry; Double beam spectrometry; Flicker spectrometry; Reflection spectrometry
C02F1/76 » CPC further
Treatment of water, waste water, or sewage by oxidation with halogens or compounds of halogens
C02F1/008 » CPC further
Treatment of water, waste water, or sewage Control or steering systems not provided for elsewhere in subclass
G01N21/314 » CPC further
Investigating or analysing materials by the use of optical means, i.e. using sub-millimetre waves, infrared, visible or ultraviolet light; Systems in which incident light is modified in accordance with the properties of the material investigated; Colour; Spectral properties, i.e. comparison of effect of material on the light at two or more different wavelengths or wavelength bands; Investigating relative effect of material at wavelengths characteristic of specific elements or molecules, e.g. atomic absorption spectrometry with comparison of measurements at specific and non-specific wavelengths
G01N33/1826 » CPC further
Investigating or analysing materials by specific methods not covered by groups -; Water organic contamination in water
C02F2209/29 » CPC further
Controlling or monitoring parameters in water treatment Chlorine compounds
G01N21/33 » CPC main
Investigating or analysing materials by the use of optical means, i.e. using sub-millimetre waves, infrared, visible or ultraviolet light; Systems in which incident light is modified in accordance with the properties of the material investigated; Colour; Spectral properties, i.e. comparison of effect of material on the light at two or more different wavelengths or wavelength bands; Investigating relative effect of material at wavelengths characteristic of specific elements or molecules, e.g. atomic absorption spectrometry using ultra-violet light
C02F1/00 IPC
Treatment of water, waste water, or sewage
G01N33/18 IPC
Investigating or analysing materials by specific methods not covered by groups - Water
G01N21/31 IPC
Investigating or analysing materials by the use of optical means, i.e. using sub-millimetre waves, infrared, visible or ultraviolet light; Systems in which incident light is modified in accordance with the properties of the material investigated; Colour; Spectral properties, i.e. comparison of effect of material on the light at two or more different wavelengths or wavelength bands Investigating relative effect of material at wavelengths characteristic of specific elements or molecules, e.g. atomic absorption spectrometry
Description
The invention is concerned with the field of absorption spectroscopy.
The use of spectroscopic techniques to identify substances or components of a mixture is well known and documented. Very generally, in absorption spectroscopy, a sample is irradiated with electromagnetic radiation having a range of wavelengths/frequencies and radiation of certain wavelengths within the range interacts with the sample.
For example, in Ultraviolet (UV) spectroscopy, radiation of certain wavelengths has the correct energy to cause shifts in the energy levels of outer shell electrons in atoms of the sample. In Infrared (IR) spectroscopy, radiation has the correct energy to stimulate inter-atomic vibration.
These interactions between the sample and radiation give rise to absorption of radiation by the sample at the wavelengths having the correct energy. A detector arranged to measure the intensity of radiation that has passed through the sample provides an indication of the wavelengths at which absorption occurs along with the degree of absorption.
The data gathered by the detector is typically presented as a plot of absorption versus wavelength (or energy) of the radiation, this presentation being known as an absorption spectrum for the sample.
As an alternative to the absorption spectrum, the data gathered by the detection could be presented as a plot of transmission (of radiation) versus wavelength/energy, the presentation being known as a transmission spectrum. However, in terms of the information being presented, the absorption spectrum and transmission spectrum may be regarded as equivalent and, as done herein, reference to one of these terms should be construed as reference to both.
In many cases, the absorption spectrum associated with a particular compound or chemical species provides a reliable means of identification/quantification but in others, the results are complicated when various components of a mixture exhibit absorption at the same or nearly the same wavelengths.
Moreover, the absolute value at which absorption occurs due to (say) a particular electronic shift may vary with other conditions such as pH or the presence of other species.
The practice of adding chlorine to water to act as disinfectant has been well established for many years. There is an associated need to analyse water for chlorine content which has traditionally been met using techniques that involve chemical reagents and buffering. These techniques are time consuming and expensive and do not readily lend themselves to rapid, in-field testing by mobile personnel.
There exists a long standing desire for a method of chlorine analysis that does not involve chemical reagents and can be conveniently carried out in the field, for example, by agents of the water supply industries.
Methods involving spectroscopic analysis have the potential to meet this long standing need, but absorbance values for levels found in drinking water (typically <1 mg/l) are too small be measured using a typicall 10 mm cell.
Moreover, problems of the type previously alluded to are met as NO3 effectively masks the absorbance exhibited by the chlorine species.
Chlorine dissolved in water exists in two forms, namely hypochlorous acid (HOCl) and hypochlorite (OCl−). Each of these species exhibits absorbance in the UV range of electromagnetic radiation. In conditions of low pH, (<pH 6), the HOCl form predominates at a peak wavelength of 228 nm and in conditions of high pH, (>pH 9), the OCl− form predominates at a peak wavelength of about 292 nm. For pH values between 6 and 9, the spectrum is the sum of absorbances around these two wavelengths.
Moreover, the NO3− species typically coexists with the chlorine species in water. NO3− exhibits peak absorbances at 210 nm and 300 nm and these peaks overlap with those associated with chlorine in a UV spectrum.
According to the invention these, and other problems associated with the prior art are addressed by a method of estimating the respective concentration of components in a solution comprising the steps set out in claim 1 attached hereto.
According to a second aspect of the invention, apparatus for estimating the respective concentrations [X] and [Y] of at least two components, X and Y, in a solution comprises the features set out in claim 10 attached hereto.
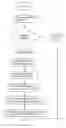
The apparatus will now be described with reference to the following figures in which:
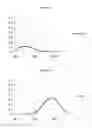
FIG. 1 shows typical UV spectra for each of the components present when chlorine is dissolved in water, along with a single spectrum derived from all components;
FIG. 2 is a flowchart illustrating the method of the invention;
FIG. 3 shows a comparison of the concentrations of components in a known sample with those estimated by the method of the invention and
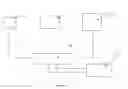
FIG. 4 illustates apparatus according to the invention.
Referring to FIG. 1a the peak absorbance for the HOCl species occurs at about 235 nm and FIG. 1b shows a peak absorbance for the OCl− species at about 292 nm.
FIG. 1c shows a peak absorbance for NO3− of about 300 nm along with increasing absorbance as the wavelength falls below about 250 nm. 1d shows that when these species coexist in a sample, a single peak is seen at about 290 nm (due to OCl− and NO3−) and the absorbance due to HOCl is masked by the absorbance due to NO3− below about 250 nm.
The method of the present invention uses the graphical technique of curve fitting. In principle, it is possible to perform a series of calculations of absorbance across the wavelength range of the observed spectrum for a sample. These calculations would be done for varying concentrations of the various components HOCl, OCl− and NO3− and extrapolated to produce a series of theoretical spectra, each spectrum being associated with a particular combination of component concentrations.
A curve fitting technique such as a least squares fit would then be used to determine which of the calculated spectra most closely fits the observed spectrum and the component concentrations giving rise to that calculated spectrum are used as an estimate of the component concentrations in the sample.
In practice, however, the inventors have found that the processing demands made by such an approach are prohibitive. For the purpose of chlorine monitoring in a domestic water supply, a typical calculation would need to consider a range of 0 to 50 mg/l in steps of 0.1 mg/l for NO3−, 0 to 2 mg/l in steps of 0.01 mg/l for OCl− and a range of 0 to 2 mg/l in steps of 0.01 mg/l for HOCl. This would typically be done for each whole number value of wavelength between 200 nm and 400 nm giving rise to 2×10⁷. calculations. Additionally, 200 calculations must be stored and compared to the last 200 to find a least squared fit, introducing another factor of 200.
The inventors have developed a method including a step which drastically reduces the number of calculations necessary to perform a curve fitting analysis to the degree of accuracy desired. Where an absorption spectrum includes a peak that is attributable to more than one component of a sample, the inventors have observed that the precise wavelength of that peak varies with the respective concentrations of those components.
This observation forms the basis of an initial estimate of component concentrations, made by comparing the observed spectrum for the sample with a library of reference data.
This initial estimate can be used to define much narrower ranges for the component concentrations over which the calculations necessary for the curve fitting exercise need to be performed.
After the concentration of a component has been estimated from a first peak in this way, that estimate can be used to estimate the contribution to a second peak by that component. When that contribution is subtracted from the second peak, the difference can form the basis of an estimate for the concentration of a third component.
Referring to FIG. 2, analysis of a sample according to the method of the invention begins with acquisiton of an absorption spectrum for the sample at 1. At 2, a determination is made of whether a peak exists in the acquired spectrum, within a first predefined range in which absorption would be observed for two components of interest, X and Y. For the analysis of chlorine in water, X would be NO3−, Y would be OCl− and the first predetermined range would include values between 290 nm and 320 nm.
If no such peak is found, the values for the concentrations of X and Y, denoted by [X] and [Y] respectively, are assumed to be zero (step 3) and the third stage of the method can be initiated at step 10.
If an absorption peak is observed in the first predefined range, the wavelength of the peak is determined at 4.
Comparison of this wavelength with previously obtained reference data at 5 provides a first estimate for the values of [X] and [Y]. Typically, the reference data might exist as a look-up table which offers a number of possible values for each of [X] and [Y]. In its simplest form, the invention provides a basis for estimating [X] and [Y] using the look-up table, for example by taking an average of the possible values offered by the table.
In a second stage of the method, the initial estimate obtained at 5 is further refined by first defining ranges for possible values of [X] and [Y] (at 6) around the estimates obtained at 5 and then calculating the spectra (at 7) that would be expected from solutions having values across these ranges. The actual number of spectra calculated depends on the degree of accuracy required. Typically a set of values across each range would be defined (e.g. by starting at the lowest value in the range and repeatedly incrementing that value by a chosen amount) and spectra would be calculated for all combinations of a value from the range for [X] with a value from the range for [Y].
Spectra can be calculated for a chosen set of concentrations using response factors (absorbances) known in the literature for the components of interest.
At 8, the calculated spectra are compared with the acquired spectrum for the sample to find that having the closest match. The methods by which such a comparison may be made are well documented and known to a person skilled in the art. In a crude form, the comparison could be made by a visual inspection but a more sophisticated approach would employ mathematical techniques such as a least squares analysis.
At 9, a revised estimate for [X] and [Y] is derived from the values of [X] and [Y] giving the calculated spectrum having the best match with the acquired spectrum for the sample.
At 10, a third stage of the method can be initiated by determining whether absorption is observed in the acquired spectrum for the sample, in a second predefined range in which absorption would be observed for one of the components, X.
If such absorption is observed, then at 11, the contribution to that peak due to X is estimated using the previously obtained value of [X] and a previously known absorbance for X at a wavelength within the second range.
Having subtracted the contribution due to X, the remaining absorption is attributed to a third component Z, and an estimate of [Z] is estimated therefrom (12).
The concentration estimates may be further refined by initiating a fourth stage of the method at 13, where a range of possible values for [Z] and a new range of possible values fo [X] are defined to include the most recent estimates of [Z] and [X] respectively.
The exercise of calculating spectra is repeated for combinations of values from these ranges at 14 before a curve fitting exercise is performed at 15 to determine the combination of values of [X] and [Y] giving a spectrum which most closely resembles the acquired spectrum for the solution at 16.
Where the sample comprises chlorine dissolved in water, Z would be HOCl and absorption would be observed below 250 nm at step 10. The absorption due to X would be preferrabley be calculated (step 11) for a wavelength of between 230 nm and 250 nm, more preferrably between 235 nm and 245 nm most preferrably at 240 nm.
There now follows sample algorithm listing used for the determination of chlorine and nitrate in water.
The algorithm defines the response for a 30 cm path length cell. The absorption coefficients used are for a specific cell. According to practice well known in the art, a Nitrate ion standard of 30 parts per million is passed through the cell and the absorbance measured. Comparison of the observed absorbtion coefficient for Nitrate with the literature value yields a correction factor which is applied to the literature values of absorption coefficients for other species. The corrected absorption coefficients for the other species are then applied to the observed absorptions for these species to calculate concentrations.
The method is effective with cells having path lengths up to 100 cm.
To use for other path lengths, all calculated absorbance values should be factored by:
Actual path length/30.
For example, for a 100 cm cell, the definitions and absorbances below would be multiplied by 3.333.
Requirements for the Algorithm.
Define the Nitrate (NO3−), hypochlorite (OCl−) and hypochlorous absorbance curves. Use these equations when calculation of [NO3−], [OCl−] or [HOCl] is required
1. Define the Nitrate Absorbance Spectrum for 30 mg/l
NO3=(−3.19956858631723E−03)+(0.172085985390831/(1+_Exp(−(x−296.404251810163+33.5223979282129/—2)/9.85592846938872)))*(1−1/(1+_Exp(−(x−296.404251810163−33.5223979282129/—2)/6.84378175991155)))
Where x is the wavelength at which to calculate the absorbance
Converts the Nitrate 30 mg/l absorbance nitrate current mg/l to give theoretical absorbance for the current nitrate mg/l
NO3=NO3*(no3_current/30)
2. Define the Hypochlorite Absorbance Spectrum for 5 mg/l
OCl1=(x−87.74559748588*(−6.23611708355894)/(2*—9.47786188703371)−288.591861465584)/—87.74559748588
OCl2=(−3.35605864187096E−04)+0.917441368457116*(1+—OCl1*OCl1)̂(−9.47786188703371)*Exp(−(−—6.23611708355894)*(Atn(N)+Atn((−6.23611708355894)/_(2*9.47786188703371))))/(1+(−—6.23611708355894)*(−6.23611708355894)/(4*—9.47786188703371*9.47786188703371))̂(−—9.47786188703371)
Converts the Hypochlorite 5 mg/l absorbance Hypochlorite current mg/l to give theoretical absorbance for the current Hypochlorite mg/l
OCl2=OCL2*(ocl current/5)
3. Define Hypochlorous Absorbance Spectrum for 2 mg/l
HOCl=0+0.167666162248925*Exp(−0.5*(Abs(x−227.464166361418)/17.5217273526745)̂2.24405372401415)
Converts the Hypochlorous 2 mg/l absorbance Hypochlorous current mg/l to give theoretical absorbance for the current Hypochlorous mg/l
HOCl=HOCl*(hocl_current/(2))
Algorithm
Stage 1
-
- 1. Find peak in region 290-320 nm.
- 2. If no peak—Nitrate [NO3−]=0.00 mg/l and Hypochlorite [OCl−]=0.00 mg/l. Go to STAGE 3
- 3. If peak present, the wavelength and maximum absorbance defines the possible values of [NO3−] and [OCl−]. Use the following the peak wavelength with the table 1 to determine an estimated range for [NO3−] and [OCl−].
| TABLE 1 | |
| NO3 |
| OCI | 0 | 5 | 10 | 15 | 20 | 25 | 30 | 35 | 40 | 45 | 50 |
| 0 | 289 | 298 | 298 | 298 | 298 | 298 | 298 | 298 | 298 | 298 | 298 |
| 0.1 | 289 | 295 | 296 | 297 | 297 | 297 | 297 | 298 | 298 | 298 | 298 |
| 0.2 | 288 | 293 | 295 | 296 | 296 | 297 | 297 | 297 | 297 | 297 | 297 |
| 0.3 | 288 | 292 | 294 | 295 | 296 | 296 | 296 | 297 | 297 | 297 | 297 |
| 0.4 | 288 | 291 | 293 | 294 | 295 | 295 | 296 | 296 | 296 | 296 | 297 |
| 0.5 | 288 | 291 | 292 | 293 | 294 | 295 | 295 | 296 | 296 | 296 | 296 |
| 0.6 | 288 | 291 | 292 | 293 | 294 | 294 | 295 | 295 | 296 | 296 | 296 |
| 0.7 | 288 | 290 | 292 | 293 | 293 | 294 | 294 | 295 | 295 | 295 | 296 |
| 0.8 | 288 | 290 | 291 | 292 | 293 | 294 | 294 | 295 | 295 | 295 | 295 |
| 0.9 | 288 | 290 | 291 | 292 | 293 | 293 | 294 | 294 | 295 | 295 | 295 |
| 1 | 288 | 290 | 291 | 292 | 292 | 293 | 293 | 294 | 294 | 295 | 295 |
| 1.1 | 288 | 290 | 291 | 291 | 292 | 293 | 293 | 294 | 294 | 294 | 295 |
| 1.2 | 288 | 290 | 291 | 291 | 292 | 292 | 293 | 293 | 294 | 294 | 294 |
| 1.3 | 288 | 290 | 290 | 291 | 292 | 292 | 293 | 293 | 294 | 294 | 294 |
| 1.4 | 288 | 290 | 290 | 291 | 292 | 292 | 293 | 293 | 293 | 294 | 294 |
| 1.5 | 287 | 290 | 290 | 291 | 291 | 292 | 292 | 293 | 293 | 293 | 294 |
| 1.6 | 287 | 289 | 290 | 291 | 291 | 292 | 292 | 293 | 293 | 293 | 294 |
| 1.7 | 287 | 289 | 290 | 291 | 291 | 292 | 292 | 292 | 293 | 293 | 293 |
| 1.8 | 287 | 289 | 290 | 291 | 291 | 292 | 292 | 292 | 293 | 293 | 293 |
| 1.9 | 287 | 289 | 290 | 290 | 291 | 291 | 292 | 292 | 293 | 293 | 293 |
| 2 | 286 | 289 | 290 | 290 | 291 | 291 | 292 | 292 | 292 | 293 | 293 |
The table will produce a range of figures. For example 297 is highlighted and shows the possible values of NO3− and OCl−.
END OF STAGE 1
Stage 2
The range of vales obtained at the end of stage 1 can then be used in the following equation
Calc abs=((ty*0.0044))+((tx/1)*0.0177)
where tx defines the OCl− value in mg/l and ty defines the NO3− value in mg/l
The upper and lower limits for NO3− and OCl− are defined as the closest Calc abs value just below the measured max abs and just above the measured max abs.
Redefine upper and lower OCl− limits at +/−0.1 mg/l
Loop for the range of hypochlorite in steps of 0.1 mg/l
Loop for the range of nitrate in steps of 1 mg/l
Loop for range 230 to 340 nm
Calculate the NO3− absorbance value for each wavelength for intervals of 1 nm
Calculate the OCl− absorbance value for each wavelength for intervals of 1 nm
Sum the two.
Calculate the difference at each wavelength between the measured and the calculated absorbance.
Sum the square of the differences over the complete wavelength range.
If this is the smallest difference so far, store this number and the corresponding nitrate and hypochlorite value.
Set upper and lower nitrate as +/−1 mg/l from previous iteration.
Set upper and lower hypochlorite as +/−0.1 from previous iteration.
Loop for the range of hypochlorite in steps of 0.01 mg/l
Loop for the range of nitrate in steps of 0.1 mg/l
Loop for range 230 to 340 nm
Calculate the NO3− absorbance value for each wavelength for intervals of 1 nm
Calculate the OCl− absorbance value for each wavelength for intervals of 0.1 nm
Sum the two.
Calculate the difference at each wavelength between the measured and the calculated absorbance.
Sum the square of the differences over the complete wavelength range.
If this is the smallest difference so far, store this number and the corresponding nitrate and hypochlorite value in mg/l.
END OF STAGE 2
Stage 3
Calculate the nitrate absorbance at 240 nm.
Subtract this value from the absorbance at 240 nm.
The remaining absorbance at 240 nm is the absorbance due to HOCl.
Convert to approximate HOCl concentration by
HOCl=HOCl abs/(114*30)
This gives HOCl in mg/l.
END OF STAGE 3
Stage 4
Define HOCl range as +/−0.25 of this value
Define NO3− range as +/−5 of calculated NO3− mg/l value from stage 1.
Loop for the range of hypochlorous in steps of 0.01 mg/l
Loop for the range of nitrate in steps of 0.1 mg/l
Loop for range 235 to 345 nm
Calculate the NO3− absorbance value for each wavelength for intervals of 1 nm
Calculate the HOCl absorbance value for each wavelength for intervals of 1 nm
Sum the two.
Calculate the difference at each wavelength between the measured and the calculated absorbance.
Sum the square of the differences over the complete wavelength range.
If this is the smallest difference so far, store this number and the corresponding nitrate and hypochlorous value.
END
FIG. 3 is a plot of the difference between an acquired UV spectrum for a sample of chlorine in water and a calculated spectrum (red) used according to the invention to estimate [HOCl], [OCl−] and [NO3−] in the sample.
The error associated with the method is barely discernible from this figure and table 2 indicates the errors in numerical form:
| TABLE 2 | ||
| Calculated Values | Actual Values | |
| Nitrate mg/l | 30.0 | 30.0 | |
| Hypochlorite mg/l | 0.15 | 0.15 | |
| Hypochlorous mg/l | 0.97 | 0.95 | |
| Free Chlorine mg/l | 1.13 | 1.10 | |
| pH | 6.7 | 6.7 | |
Referring to FIG. 4, a typical apparatus according to the invention includes a source 17 of radiation, a cell 18 for containing sample, arranged to be illuminated by the source 17 and suitable for allowing radiation to pass therethrough and a detector 19 arranged to detect radiation having passed through the cell and sample.
In a typical UV spectrometer, one might find a cell giving a path length of 10 mm but the present invention has been shown accurately to estimate component concentrations from spectra obtained using 20 cm, 50 cm and 100 cm. Alternatively, a spherical cell of the type known in the art, which provides an effective path length of many times its diameter, could be used.
Referring back to FIG. 4, the apparatus also includes a processor 20, able to control the radiation source 17 and the detector 19.
The apparatus also includes one or more machine readable data storage media 21 such as an optical or magnetic disc, which contains data representing a reference library of spectra for varying concentrations of the components of interest in the sample.
The storage media 21 also includes machine readable instructions for the processor to control the radiation source and detector during acquisition of a spectrum for the sample, and to perform the calculations comparisons and other steps which define the invention.
The processor 20 and storage medium 21 conveniently may be realised as part of a personal computer or other computing device, or they could be realised as an integral part of the equipment that is used in the field.
As an alternative to the configuration shown in FIG. 4, the apparatus may be realised as a separate spectrometer and computer, the latter receiving an acquired spectrum from the former and being able to perform the remaining steps of the invention.
The method of the invention has been illustrated with reference to nitrate ions, hypochlorite ions and hypochlorous acid but this should not be seen as limiting. In particular, the method of the invention is applicable to solutions containing ions giving rise to overlapping peaks in an absorption spectrum such as a UV or visible spectrum, including but not limited to peaks arising from:
Ozone (O3) based around a 254 nm absorption
Monochloramine (NH2Cl) based around a 243 nm absorption
Chlorine dioxide (ClO2) based around a 254 nm absorption
Potassium Permanganate based around a 520 nm absorption
Iodine (I2) based around absorption at 490 nm.
Claims
1. A method of estimating the respective concentrations [X] and [Y] of at least two components, X and Y, in a solution, said method comprising the steps of:
acquiring absorption spectra for a plurality of solutions comprising variable concentrations of X and Y and thereby generating a library of reference data;
acquiring an absorption spectrum for the solution;
determining the wavelength, λmax, at which maximum absorbance occurs within a first wavelength range of the absorbance spectrum for the solution and
comparing λmax and the maximum absorbance with the reference data to derive a first estimate of [X] and [Y].
2. A method according to claim 1, further comprising the steps of:
defining first ranges of possible values for each of [X] and [Y], the ranges including the first estimates of [X] and [Y] respectively;
selecting a first set of pairs, each pair comprising a value from each of the first ranges;
for each pair, calculating a total theoretical absorbance at a plurality of wavelengths and extrapolating the theoretical absorbances so calculated, to produce a continuous theoretical absorption spectrum over a wavelength range substantially overlapping the range of the acquired spectrum of the solution;
comparing the continuous theoretical absorption spectra so obtained with the absorption spectrum of the solution and
selecting as second estimates of [X] and [Y], the members of the pair giving rise to the continuous theoretical absorption spectrum which most closely matches the absorption spectrum for the solution.
3. A method according to claim 2, further comprising the steps of:
defining second ranges of possible values for each of [X] and [Y], the ranges including the second estimates of [X] and [Y] respectively;
selecting a second set of pairs, each pair comprising a value from each of the second ranges;
for each pair in the second set, calculating a total theoretical absorbance at a plurality of wavelengths and extrapolating the theoretical absorbances so calculated, to produce a continuous theoretical absorption spectrum over a wavelength range substantially overlapping the range of the acquired spectrum of the solution;
comparing the continuous theoretical absorption spectra so obtained with the absorption spectrum of the solution and
selecting as third estimates of [X] and [Y], the members of the pair giving rise to the continuous theoretical absorption spectrum which most closely matches the absorption spectrum for the solution.
4. A method according to any of claims claim 1, further comprising the steps of:
calculating from the estimate of [X], a theoretical absorbance due to X at a wavelength, λ2, outside of the first wavelength range;
subtracting the theoretical absorbance so calculated from the absorbance at λ2 indicated by the absorption spectrum for the solution, to yield and estimated absorption AZ at λ2, attributable to a third component, Z, of the solution and
calculating from AZ, a first estimate of [Z], the concentration of component Z in the solution.
5. A method according to claim 4, further comprising the steps of:
defining a third range of possible values of [X], the third range including the third estimate of [X], and a first range of possible values of [Z], said first range including the first estimate of [Z];
selecting a third set of pairs, each pair comprising a value from the third range of possible values of [X] and a value from the first range of possible values of [Z];
for each pair in the third set, calculating a total theoretical absorbance at a plurality of wavelengths and extrapolating the theoretical absorbances so calculated, to produce a continuous theoretical absorption spectrum over a wavelength range substantially overlapping the range of the acquired spectrum of the solution;
comparing the continuous theoretical absorption spectra so obtained with the absorption spectrum of the solution and
selecting as a fourth estimates of [X] and a second estimate of [Y], the members of the pair giving rise to the continuous theoretical absorption spectrum which most closely matches the absorption spectrum for the solution.
6. A method according to claim 1, where the acquired absorption spectra are Ultraviolet spectra.
7. A method according to claim 6, where X=NO3−.
8. A method according to claim 7, where Y=OCl−.
9. A method according to claim 8, where Z=HOCl.
10. Apparatus for estimating the respective concentrations [X] and [Y] of at least two components, X and Y, in a solution comprising:
a source of electromagnetic radiation of variable wavelength;
a cell suitable for retaining a sample of the solution and substantially transparent to the electromagnetic radiation;
a detector arranged to detect electromagnetic radiation radiated from the source and passing through the cell and sample;
a processor operable to vary the wavelength produced by the source of radiation and to store in a storage medium, data produced by the detector as the wavelength is varied, thereby generating an absorption spectrum for the solution;
characterised by a computer readable data storage medium containing a library of reference data; said data representing absorption spectra for a plurality of solutions comprising variable concentrations of X and Y;
and in that the processor is arranged to determine the wavelength, λmax, at which maximum absorbance occurs within a first wavelength range of the absorption spectrum for the solution and compare λmax and the maximum absorbance with the reference data to derive a first estimate of [X] and [Y].
11. Apparatus according to claim 10, further characterised in that the processor is arranged to:
define first ranges of possible values for each of [X] and [Y], the ranges including the first estimates of [X] and [Y] respectively;
select a first set of pairs, each pair comprising a value from each of the first ranges;
for each pair, calculate a total theoretical absorbance at a plurality of wavelengths and extrapolate the theoretical absorbances so calculated, to produce a continuous theoretical absorption spectrum over a wavelength range substantially overlapping the range of the acquired spectrum of the solution;
compare the continuous theoretical absorption spectra so obtained with the absorption spectrum of the solution and
select as second estimates of [X] and [Y], the members of the pair giving rise to the continuous theoretical absorption spectrum which most closely matches the absorption spectrum for the solution.
12. Apparatus according to claim 11, further characterised in that the processor is arranged to:
define second ranges of possible values for each of [X] and [Y], the ranges including the second estimates of [X] and [Y] respectively;
select a second set of pairs, each pair comprising a value from each of the second ranges;
for each pair in the second set, calculate a total theoretical absorbance at a plurality of wavelengths and extrapolate the theoretical absorbances so calculated, to produce a continuous theoretical absorption spectrum over a wavelength range substantially overlapping the range of the acquired spectrum of the solution;
compare the continuous theoretical absorption spectra so obtained with the absorption spectrum of the solution and
select as third estimates of [X] and [Y], the members of the pair giving rise to the continuous theoretical absorption spectrum which most closely matches the absorption spectrum for the solution.
13. Apparatus according to claim 12, further characterised in that the processor is arranged to:
calculate from the estimate of [X] obtained from claim 10, a theoretical absorbance due to X at a wavelength, λ2, outside of the first wavelength range;
subtract the theoretical absorbance so calculated from the absorbance at λ2 indicated by the absorption spectrum for the solution, to yield and estimated absorbance AZ at λ2, attributable to a third component, Z, of the solution and
calculating from Az, a first estimate of [Z], the concentration of component Z in the solution.
14. Apparatus according to claim 13, further characterised in that the processor is arranged to:
define a third range of possible values of [X], the third range including the third estimate of [X], and a first range of possible values of [Z], said first range including the first estimate of [Z];
select a third set of pairs, each pair comprising a value from the third range of possible values of [X] and a value from the first range of possible values of [Z];
for each pair in the third set, calculate a total theoretical absorbance at a plurality of wavelengths and extrapolate the theoretical absorbances so calculated, to produce a continuous theoretical absorption spectrum over a wavelength range substantially overlapping the range of the acquired spectrum of the solution;
compare the continuous theoretical absorption spectra so obtained with the absorption spectrum of the solution and
select as a fourth estimate of [X] and a second estimate of [Y], the members of the pair giving rise to the continuous theoretical absorption spectrum which most closely matches the absorption spectrum for the solution.
15. Apparatus according to claim 14, where the absorption spectra are Ultraviolet.
16. Apparatus according to claim 15, where the first range includes values between 250 nm and 330 nm.
17. Apparatus according to claim 16, where the first range includes values between 290 nm and 320 nm.
18. Apparatus according to claim 17, where λ2 is between 235 nm and 245 nm.
19. Apparatus according to claim 18, where the cell provides a path length for ultraviolet radiation of greater than 50 cm.
20. Apparatus according to claim 18, where the cell provides a path length for ultraviolet radiation of greater than 100 cm.
21. A method according to claim 1, where at least one of X, Y and Z is selected from:
ozone, monochloramine, chlorine dioxide, potassium permanganate and iodine.
Images & Drawings included:


Sources:
- United States Patent and Trademark Office - verify current appl. status at the USPTO↗
Recent applications in this class:
- » 20250224330 2025-07-10
UV-BASED, IN-SITU SOIL CARBON MEASUREMENT SYSTEM - » 20250208035 2025-06-26
ANALYZER WITH A LOW-MAINTENANCE LIGHT SOURCE ASSEMBLY - » 20250130163 2025-04-24
ON-LINE MONITORING OF SYNTHESIS REACTIONS - » 20250123200 2025-04-17
METHOD FOR DETECTING AN OBJECT CONTAINING RECYCLED PLASTIC MATERIALS BY QUALITATIVE AND SEMI-QUANTITATIVE DETECTIONS - » 20250110045 2025-04-03
ON-CHIP WIDE UV-VIS-NIR SPECTRAL SENSOR - » 20250102426 2025-03-27
SYSTEM AND METHOD FOR RAPID DETERMINATION OF FREE SULFUR DIOXIDE CONCENTRATION IN A LIQUID - » 20250093261 2025-03-20
LINE-ILLUMINATING LIGHT SOURCE FOR IMAGING APPARATUS, IMAGING APPARATUS INCLUDING THE SAME, AND SKIN ANALYZING APPARATUS INCLUDING THE IMAGING APPARATUS - » 20250027876 2025-01-23
DETECTING AND DIFFERENTIATING NEUROTRANSMITTERS USING ULTRAVIOLET PLASMONIC-ENGINEERED NATIVE FLUORESCENCE - » 20240377317 2024-11-14
SENSOR DEVICE FOR DETECTING BIOLOGICAL PARTICLES AND NON-BIOLOGICAL PARTICLES - » 20240361235 2024-10-31
COMPLEX GAS SENSOR, MANUFACTURING METHOD THEREOF, AND CONTROL METHOD OF COMPLEX GAS SENSOR
Recent applications for this Assignee:
- » 20170240439 2017-08-24
Ion Exchange Membranes And Methods Of Making The Same - » 20140263010 2014-09-18
Hybrid aerobic and anaerobic wastewater and sludge treatment systems and methods - » 20140238932 2014-08-28
Enhanced biosorption of wastewater organics using dissolved air flotation with solids recycle - » 20140217015 2014-08-07
Use of primary sludge for carbon source in an aerated-anoxic bioreactor system - » 20140216934 2014-08-07
Electrochemical desalination for oil recovery - » 20140102977 2014-04-17
Ballasted anaerobic method for treating wastewater - » 20140027374 2014-01-30
Hybrid aerobic and anaerobic wastewater and sludge treatment systems and methods - » 20130264281 2013-10-10
Apparatus and methods for control of waste treatment processes - » 20130256222 2013-10-03
Methods for enhancing a wastewater treatment process - » 20130256135 2013-10-03
Water treatment system and method