Devices for Detecting Renal Disorders
US20110065608A1
2011-03-17
12/852,312
2010-08-06
Abstract:
Devices for diagnosing, monitoring, or determining a renal disorder in a mammal are described. In particular, devices for diagnosing, monitoring, or determining a renal disorder using measured concentrations of a combination of three or more analytes in a test sample taken from the mammal are described.
Inventors:
- Ralph L. McDade 16 🇺🇸 Austin, TX, United States
- Samuel T. Labrie 14 🇺🇸 Austin, TX, United States
- Michael D. Spain 15 🇺🇸 Austin, TX, United States
- Karri L. Ballard 12 🇺🇸 Austin, TX, United States
- James P. Mapes 10 🇺🇸 Lakeway, TX, United States
- Dominic P. Eisinger 3 🇺🇸 Keene, NY, United States
Assignee:
- Rules-Based Medicine, Inc. 19 🇺🇸 Austin, TX, United States
Interested in similar patents?
Get notified when new applications in this technology area are published.
Classification:
G01N33/6893 » CPC main
Investigating or analysing materials by specific methods not covered by groups -; Biological material, e.g. blood, urine ; Haemocytometers; Chemical analysis of biological material, e.g. blood, urine; Testing involving biospecific ligand binding methods; Immunological testing involving proteins, peptides or amino acids related to diseases not provided for elsewhere
G01N33/5302 » CPC further
Investigating or analysing materials by specific methods not covered by groups -; Biological material, e.g. blood, urine ; Haemocytometers; Chemical analysis of biological material, e.g. blood, urine; Testing involving biospecific ligand binding methods; Immunological testing; Immunoassay; Biospecific binding assay; Materials therefor Apparatus specially adapted for immunological test procedures
G01N33/566 » CPC further
Investigating or analysing materials by specific methods not covered by groups -; Biological material, e.g. blood, urine ; Haemocytometers; Chemical analysis of biological material, e.g. blood, urine; Testing involving biospecific ligand binding methods; Immunological testing; Immunoassay; Biospecific binding assay; Materials therefor using specific carrier or receptor proteins as ligand binding reagents where possible specific carrier or receptor proteins are classified with their target compounds
G01N2333/47 » CPC further
Assays involving biological materials from specific organisms or of a specific nature from animals; from humans from vertebrates Assays involving proteins of known structure or function as defined in the subgroups
G01N2333/4703 » CPC further
Assays involving biological materials from specific organisms or of a specific nature from animals; from humans from vertebrates; Assays involving proteins of known structure or function as defined in the subgroups; Details Regulators; Modulating activity
G01N2333/4706 » CPC further
Assays involving biological materials from specific organisms or of a specific nature from animals; from humans from vertebrates; Assays involving proteins of known structure or function as defined in the subgroups; Details; Regulators; Modulating activity stimulating, promoting or activating activity
G01N2333/4725 » CPC further
Assays involving biological materials from specific organisms or of a specific nature from animals; from humans from vertebrates; Assays involving proteins of known structure or function as defined in the subgroups; Details Mucins, e.g. human intestinal mucin
G01N2333/4727 » CPC further
Assays involving biological materials from specific organisms or of a specific nature from animals; from humans from vertebrates; Assays involving proteins of known structure or function as defined in the subgroups; Details Calcium binding proteins, e.g. calmodulin
G01N2333/475 » CPC further
Assays involving biological materials from specific organisms or of a specific nature from animals; from humans Assays involving growth factors
G01N2333/52 » CPC further
Assays involving biological materials from specific organisms or of a specific nature from animals; from humans Assays involving cytokines
G01N2333/70503 » CPC further
Assays involving biological materials from specific organisms or of a specific nature from animals; from humans; Assays involving receptors, cell surface antigens or cell surface determinants Immunoglobulin superfamily, e.g. VCAMs, PECAM, LFA-3
G01N2333/70539 » CPC further
Assays involving biological materials from specific organisms or of a specific nature from animals; from humans; Assays involving receptors, cell surface antigens or cell surface determinants; Immunoglobulin superfamily, e.g. VCAMs, PECAM, LFA-3 MHC-molecules, e.g. HLA-molecules
G01N2333/765 » CPC further
Assays involving biological materials from specific organisms or of a specific nature from animals; from humans; Assays involving albumins other than in routine use for blocking surfaces or for anchoring haptens during immunisation Serum albumin, e.g. HSA
G01N2333/775 » CPC further
Assays involving biological materials from specific organisms or of a specific nature from animals; from humans Apolipopeptides
G01N2333/8139 » CPC further
Assays involving biological materials from specific organisms or of a specific nature; Protease inhibitors; Endopeptidase (E.C. 3.4.21-99) inhibitors Cysteine protease (E.C. 3.4.22) inhibitors, e.g. cystatin
G01N2333/8146 » CPC further
Assays involving biological materials from specific organisms or of a specific nature; Protease inhibitors; Endopeptidase (E.C. 3.4.21-99) inhibitors Metalloprotease (E.C. 3.4.24) inhibitors, e.g. tissue inhibitor of metallo proteinase, TIMP
G01N2333/82 » CPC further
Assays involving biological materials from specific organisms or of a specific nature Translation products from oncogenes
G01N2333/91177 » CPC further
Assays involving biological materials from specific organisms or of a specific nature; Enzymes; Proenzymes; Transferases (2.) transferring alkyl or aryl groups other than methyl groups (2.5) general (2.5.1) with definite EC number (2.5.1.-) Glutathione transferases (2.5.1.18)
G01N2800/34 » CPC further
Detection or diagnosis of diseases Genitourinary disorders
G01N2800/347 » CPC further
Detection or diagnosis of diseases; Genitourinary disorders Renal failures; Glomerular diseases; Tubulointerstitial diseases, e.g. nephritic syndrome, glomerulonephritis; Renovascular diseases, e.g. renal artery occlusion, nephropathy
G01N2800/52 » CPC further
Detection or diagnosis of diseases Predicting or monitoring the response to treatment, e.g. for selection of therapy based on assay results in personalised medicine; Prognosis
G01N2800/56 » CPC further
Detection or diagnosis of diseases Staging of a disease; Further complications associated with the disease
G01N2800/60 » CPC further
Detection or diagnosis of diseases Complex ways of combining multiple protein biomarkers for diagnosis
Y10T436/147777 » CPC further
Chemistry: analytical and immunological testing; Heterocyclic carbon compound [i.e. , O, S, N, Se, Te, as only ring hetero atom]; Hetero-N Plural nitrogen in the same ring [e.g., barbituates, creatinine, etc.]
C40B40/10 IPC
Libraries , e.g. arrays, mixtures; Libraries containing only organic compounds Libraries containing peptides or polypeptides, or derivatives thereof
Description
CROSS REFERENCE TO RELATED APPLICATIONS
This application claims the priority of U.S. provisional application Ser. No. 61/327,389, filed Apr. 23, 2010, and U.S. provisional application Ser. No. 61/232,091, filed Aug. 7, 2009, each of which is hereby incorporated by reference in its entirety, and is related to U.S. patent application Ser. Nos. [Not Yet Assigned], entitled Methods and Devices for Detecting Obstructive Uropathy and Associated Disorders, Computer Methods and Devices for Detecting Kidney Damage, Methods and Devices for Detecting Kidney Damage, Methods and Devices for Detecting Kidney Transplant Rejection, Methods and Devices for Detecting Diabetic Nephropathy and Associated Disorders, and Methods and Devices for Detecting Glomerulonephritis and Associated Disorders, Attorney Docket Nos. 060075-, filed on the same date as this application, the entire contents of which are incorporated herein by reference.
FIELD OF THE INVENTION
The invention encompasses devices for diagnosing, monitoring, or determining a renal disorder in a mammal. In particular, the present invention provides methods and devices for diagnosing, monitoring, or determining renal disorders in a mammal using measured concentrations of a combination of three or more analytes in a test sample taken from the mammal.
BACKGROUND OF THE INVENTION
The urinary system, in particular the kidneys, perform several critical functions such as maintaining electrolyte balance and eliminating toxins from the bloodstream. In the human body, the pair of kidneys together process roughly 20% of the total cardiac output, amounting to about 1 L/min in a 70-kg adult male. Because compounds in circulation are concentrated in the kidney up to 1000-fold relative to the plasma concentration, the kidney is especially vulnerable to injury due to exposure to toxic compounds.
Renal disorders and disease are serious conditions that generally affect the function of the kidney. The disorders discussed herein may arise from a variety of causes, including intrinsic disease processes, such as inflammation and necrosis of the kidney. In addition, renal disorders may also arise from secondary sources including drugs that are toxic to the kidneys and alternative disease states that cause secondary adverse effects on the kidney, such as diabetes and hypertension. Prevention of renal disorders is largely dependent on early diagnosis of the condition. Existing diagnostic tests such as BUN and serum creatine tests typically detect only advanced stages of kidney damage. Other diagnostic tests such as kidney tissue biopsies or CAT scans have the advantage of enhanced sensitivity to earlier stages of kidney damage, but these tests are also generally costly, slow, and/or invasive.
A need exists in the art for a fast, simple, reliable, and sensitive method of detecting obstructive uropathy or an associated disorder. In a clinical setting, the early detection of kidney damage would help medical practitioners to diagnose and treat kidney damage more quickly and effectively.
SUMMARY OF THE INVENTION
The present invention provides methods and devices for diagnosing, monitoring, or determining a renal disorder in a mammal. In particular, the present invention provides methods and devices for diagnosing, monitoring, or determining a renal disorder using measured concentrations of a combination of three or more analytes in a test sample taken from the mammal.
In one aspect, the present invention encompasses an assay device for diagnosing, monitoring, or determining a renal disorder in a mammal, the device comprising a panel of biomarkers for diagnosing, monitoring, or determining a renal disorder comprising six antibodies immobilized on a contact surface, wherein the antigenic determinants of the antibodies are analytes associated with renal disorder, wherein the analytes are selected from the group consisting of alpha-1 microglobulin, beta-2 microglobulin, cystatin C, KIM-1, THP, and TIMP-1.
In another aspect, the invention encompasses an assay device for diagnosing, monitoring, or determining a renal disorder in a mammal, the device comprising a panel of biomarkers for diagnosing, monitoring, or determining a renal disorder comprising three or more antibodies immobilized on the contact surface, wherein the antigenic determinants of the antibodies are analytes associated with renal disorder, wherein the analytes are selected from the group consisting of alpha-1 microglobulin, beta-2 microglobulin, calbindin, clusterin, CTGF, creatinine, cystatin C, GST-alpha, KIM-1, microalbumin, NGAL, osteopontin, THP, TIMP-1, TFF-3, VEGF, BLC, CD40, IGF BP2, MMP3, peptide YY, stem cell factor, TNF RII, AXL, Eotaxin 3, FABP, FGF basic, myoglobin, resistin, TRAIL R3, endothelin 1, NrCAM, Tenascin C, VCAM1, and cortisol. It is also recognized that the assay device may include combinations of 6, 10, or 16 antibodies with antigenic determinants corresponding to the analytes disclosed herein.
In another aspect, the invention encompasses an assay device for diagnosing, monitoring, or determining a renal disorder in a mammal, the device comprising: (a) three or more capture antibodies, wherein the antigenic determinants of the capture antibodies are analytes associated with a renal disorder, wherein the analytes are selected from the group consisting of alpha-1 microglobulin, beta-2 microglobulin, calbindin, clusterin, CTGF, creatinine, cystatin C, GST-alpha, KIM-1, microalbumin, NGAL, osteopontin, THP, TIMP-1, TFF-3, VEGF, BLC, CD40, IGF BP2, MMP3, peptide YY, stem cell factor, TNF RII, AXL, Eotaxin 3, FABP, FGF basic, myoglobin, resistin, TRAIL R3, endothelin 1, NrCAM, Tenascin C, VCAM1, and cortisol; (b) three or more capture agents comprising an antigenic moiety, wherein one of the capture agents is attached to each of the capture antibodies; (c) three or more detection antibodies, wherein the antigenic determinant of the detection antibodies is the antigenic moiety; and (d) three or more indicators, wherein each of the indicators is attached to one of the detection antibodies.
In a further aspect, the invention encompasses a kit for diagnosing, monitoring, or determining a renal disorder in a mammal, where the kit includes: (a) an assay device having a panel of biomarkers for diagnosing, monitoring, or determining a renal disorder comprising three or more antibodies immobilized on the contact surface, wherein the antigenic determinants of the antibodies are analytes associated with renal disorder, wherein the analytes are selected from the group consisting of alpha-1 microglobulin, beta-2 microglobulin, calbindin, clusterin, CTGF, creatinine, cystatin C, GST-alpha, KIM-1, microalbumin, NGAL, osteopontin, THP, TIMP-1, TFF-3, and VEGF; and (b) a collection apparatus suitable for collecting a sample of bodily fluid from the mammal.
In yet another aspect, the invention encompasses a kit for diagnosing, monitoring, or determining a renal disorder in a mammal, where the kit includes: (a) an assay device having (i) three or more capture antibodies, wherein the antigenic determinants of the capture antibodies are analytes associated with a renal disorder, wherein the analytes are selected from the group consisting of alpha-1 microglobulin, beta-2 microglobulin, calbindin, clusterin, CTGF, creatinine, cystatin C, GST-alpha, KIM-1, microalbumin, NGAL, osteopontin, THP, TIMP-1, TFF-3, and VEGF; (ii) three or more capture agents comprising an antigenic moiety, wherein one of the capture agents is attached to each of the capture antibodies; (iii) three or more detection antibodies, wherein the antigenic determinant of the detection antibodies is the antigenic moiety; and (iv) three or more indicators, wherein each of the indicators is attached to one of the detection antibodies; and (b) a collection apparatus suitable for collecting a sample bodily fluid from the mammal.
In still another aspect, the invention encompasses an assay device for diagnosing, monitoring, or determining a renal disorder in a mammal, the device comprising a panel of biomarkers having sixteen antibodies immobilized on a contact surface, wherein the antigenic determinants of the antibodies are analytes associated with renal disorder, wherein the analytes are selected from the group consisting of alpha-1-microglobulin, beta-2-microglobulin, calbindin, clusterin, CTGF, creatinine, cystatin C, GST-alpha, KIM-1, microalbumin, NGAL, osteopontin, THP, TIMP-1, TFF-3, and VEGF.
In a further aspect, the invention encompasses a platform for diagnosing, monitoring, or determining a renal disorder in a mammal, the platform comprising at least 6 antibodies selected from the group consisting of alpha-1-microglobulin, beta-2-microglobulin, calbindin, clusterin, CTGF, creatinine, cystatin C, GST-alpha, KIM-1, microalbumin, NGAL, osteopontin, THP, TIMP-1, TFF-3, and VEGF.
Other aspects and iterations of the invention are described in more detail below.
DESCRIPTION OF FIGURES
FIG. 1 depicts four graphs comparing (A) the concentrations of alpha-1 microglobulin in the urine of normal controls, kidney cancer patients, and patients with other cancer types; (B) the concentrations of beta-2 microglobulin in the urine of normal controls, kidney cancer patients, and patients with other cancer types; (C) the concentrations of NGAL in the urine of normal controls, kidney cancer patients, and patients with other cancer types; and (D) the concentrations of THP in the urine of normal controls, kidney cancer patients, and patients with other cancer types.
FIG. 2 shows the four different disease groups from which samples were analyzed, and a plot of two different estimations on eGFR outlining the distribution within each group.
FIG. 3 is a number of scatter plots of results on selected proteins in urine and plasma. The various groups are indicated as follows—control: blue, AA: red, DN: green, GN: yellow, OU: orange. (A) A1M in plasma, (B) cystatin C in plasma, (C) B2M in urine, (D) cystatin C in urine.
FIG. 4 depicts the multivariate analysis of the disease groups and their respective matched controls using plasma results. Relative importance shown using the random forest model.
FIG. 5 depicts three graphs showing the mean AUROC and its standard deviation (A) for plasma samples, and mean error rates (B) and mean AUROC (C) from urine samples for each classification method used to distinguish disease samples vs. normal samples. Disease encompasses analgesic abuse (AA), glomerulonephritis (GN), obstructive uropathy (OU), and diabetic nephropathy (DN). Normal=NL.
FIG. 6 depicts three graphs showing the average importance of analytes and clinical variables from 100 bootstrap runs measured by random forest (A and B) or boosting (C) to distinguish disease (AA+GN+ON+DN) samples vs. normal samples from plasma (A) and urine (B and C).
FIG. 7 depicts three graphs showing the mean AUROC and its standard deviation (A) for plasma samples, and mean error rates (B) and mean AUROC (C) from urine samples for each classification method used to distinguish analgesic abuse samples vs. normal samples. Abbreviations as in FIG. 4.
FIG. 8 depicts three graphs showing the average importance of analytes and clinical variables from 100 bootstrap runs measured by random forest (A and B) or boosting (C) to distinguish analgesic abuse samples vs. normal samples from plasma (A) and urine (B and C).
FIG. 9 depicts three graphs showing the mean AUROC and its standard deviation (A) for plasma samples, and mean error rates (B) and mean AUROC (C) from urine samples for each classification method used to distinguish analgesic abuse samples vs. diabetic nephropathy samples. Abbreviations as in FIG. 4.
FIG. 10 depicts three graphs showing the average importance of analytes and clinical variables from 100 bootstrap runs measured by random forest (A and B) or boosting (C) to distinguish analgesic abuse samples vs. diabetic nephropathy samples from plasma (A) and urine (B and C).
FIG. 11 depicts three graphs showing the mean AUROC and its standard deviation (A) for plasma samples, and mean error rates (B) and mean AUROC (C) from urine samples for each classification method used to distinguish glomerulonephritis samples vs. analgesic abuse samples. Abbreviations as in FIG. 4.
FIG. 12 depicts three graphs showing the average importance of analytes and clinical variables from 100 bootstrap runs measured by random forest (A and B) or boosting (C) to distinguish glomerulonephritis samples vs. analgesic abuse samples from plasma (A) and urine (B and C).
FIG. 13 depicts three graphs showing the mean AUROC and its standard deviation (A) for plasma samples, and mean error rates (B) and mean AUROC (C) from urine samples for each classification method used to distinguish obstructive uropathy samples vs. analgesic abuse samples. Abbreviations as in FIG. 4.
FIG. 14 depicts three graphs showing the average importance of analytes and clinical variables from 100 bootstrap runs measured by random forest (A and B) or boosting (C) to distinguish obstructive uropathy samples vs. analgesic abuse samples from plasma (A) and urine (B and C).
DETAILED DESCRIPTION OF THE INVENTION
It has been discovered that a multiplexed panel of three or more, six or more, and preferably sixteen, biomarkers may be used to detect renal disorders. As used herein, the term “renal disorder” includes, but is not limited to glomerulonephritis, interstitial nephritis, tubular damage, vasculitis, glomerulosclerosis, diabetic nephropathy, analgesic nephropathy, and acute tubular necrosis. As used herein, the term “glomerulonephritis” refers to a disorder characterized by inflammation of the glomeruli. The term may encompass chronic glomerulonephritis, acute glomerulonephritis, primary glomerulonephritis, or secondary glomerulonephritis. As used herein, the term “diabetic nephropathy” refers to a disorder characterized by angiopathy of capillaries in the kidney glomeruli. The term encompasses Kimmelstiel-Wilson syndrome, or nodular diabetic glomerulosclerosis and intercapillary glomerulonephritis. Additionally, the present invention encompasses biomarkers that may be used to detect a disorder associated with diabetic nephropathy. As used herein, the phrase “a disorder associated with diabetic nephropathy” refers to a disorder that stems from angiopathy of capillaries in the kidney glomeruli. For instance, non-limiting examples of associated disorders may include nephritic syndrome, chronic kidney failure, and end-stage kidney disease. The devices of the present invention may also be used to detect secondary kidney damage or toxicity caused by exposure to a toxic compound including but not limited to therapeutic drugs, recreational drugs, medical imaging contrast agents, and toxins. Non-limiting examples of therapeutic drugs may include an analgesic (e.g. aspirin, acetaminophen, ibuprofen, naproxen sodium), an antibiotic (e.g. an aminoglycoside, a beta lactam (cephalosporins, penicillins, penems), rifampin, vancomycin, a sulfonamide, a fluoroquinolone, and a tetracycline), or a chemotherapy agent (e.g. Cisplatin (Platinol®), Carboplatin (Paraplatin®), Cytarabine (Cytosar-U®), Gemtuzumab ozogamicin (Mylotarg®), Gemcitabine (Gemzar®), Melphalan (Alkeran®), Ifosfamide (Ifex®), Methotrexate (Rheumatrex®), Interleukin-2 (Proleukin®), Oxaliplatin (Eloxatin®), Streptozocin (Zanosar®), Pemetrexed (Alimta®), Plicamycin (Mithracin®), and Trimetrexate (Neutrexin®). Further, the term renal disorder may include kidney damage due to kidney stones, ischemia, liver transplantation, heart transplantation, lung transplantation, or hypovolemia. Moreover, the devices of the current invention may be used to detect renal disorders including kidney damage cause by other disease states including but not limited to diabetes, hypertension, autoimmune diseases including lupus, Wegener's granulomatosis, Goodpasture syndrome, primary hyperoxaluria, kidney transplant rejection, sepsis, nephritis secondary to any infection of the kidney, rhabdomyolysis, multiple myeloma, and prostate disease.
In addition, the devices and systems of the current invention may be used to detect renal disorders including acute kidney transplant rejection or chronic allograft nephropathy. Importantly, the devices of the invention may be used to distinguish between an acute rejection reaction and a chronic allograft nephropathy. Alternatively, the devices of the present invention may be used to distinguish between a successful transplant and rejection. As used herein, the term “rejection” refers to a recipient response to a foreign antigen derived from the transplanted kidney. The phrase “acute rejection” refers to an immune related response to the foreign kidney. The response is primarily T-cell driven and originates from an HLC mismatch between the donor and recipient. The phrase “chronic allograft nephropathy” refers to a chronic inflammatory and immune response mediated reaction to a foreign kidney. Chronic allograft nephropathy may result in damage to the kidney manifested by diffuse interstitial fibrosis glomerular changes, typically membranous and sclerotic in nature, as well as intimal fibrosis of the blood vessels with tubular atrophy and loss of tubular structures.
Additionally, the present invention encompasses devices comprising biomarkers that may be used to detect a renal disorder associated with kidney transplant rejection. As used herein, the phrase “a disorder associated with kidney transplant rejection” refers to a disorder that stems from a host response to a foreign antigen derived from the transplated kidney. For instance, non-limiting examples of associated disorders may include chronic kidney failure and end-stage kidney disease.
The devices of the present invention may also be utilized to detect a renal disorder including obstructive uropathy or an associated disorder in a mammal that includes determining the presence or concentration of a combination of three or more sample analytes in a test sample containing the bodily fluid of the mammal. As used herein, the term “obstructive uropathy” refers to a structural or functional hindrance of normal urine flow. The term may encompass chronic unilateral obstructive uropathy, chronic bilateral obstructive uropathy, acute unilateral obstructive uropathy, or acute bilateral obstructive uropathy. Additionally, the present invention encompasses biomarkers that may be used to detect a disorder associated with obstructive uropathy. As used herein, the phrase “a disorder associated with obstructive uropathy” refers to a disorder that stems from a structural or functional hindrance of normal urine flow. For instance, non-limiting examples of associated disorders may include hydronephrosis and obstructive nephropathy. The measured concentrations of the combination of sample analytes is compared to the entries of a dataset in which each entry contains the minimum diagnostic concentrations of a combination of three of more analytes reflective of obstructive uropathy or an associated disorder. Other embodiments provide computer-readable media encoded with applications containing executable modules, systems that include databases and processing devices containing executable modules configured to diagnose, monitor, or determine a renal disorder in a mammal. Still other embodiments provide antibody-based devices for diagnosing, monitoring, or determining obstructive uropathy or an associated disorder in a mammal.
The biomarkers included in a multiplexed panel of the invention are analytes known in the art that may be detected in the urine, serum, plasma and other bodily fluids of mammals. As such, the analytes of the multiplexed panel may be readily extracted from the mammal in a test sample of bodily fluid. The concentrations of the analytes within the test sample may be measured using known analytical techniques such as a multiplexed antibody-based immunological assay. The combination of concentrations of the analytes in the test sample may be compared to empirically determined combinations of minimum diagnostic concentrations and combinations of diagnostic concentration ranges associated with healthy kidney function to determine whether a renal disorder is indicated in the mammal.
The analytes used as biomarkers in the multiplexed assay, methods of diagnosing, monitoring, or determining a renal disorder using measurements of the analytes, systems and applications used to analyze the multiplexed assay measurements, and antibody-based devices used to measure the analytes are described in detail below.
I. Analytes in Multiplexed Assay
One embodiment of the invention measures the concentrations of three or more, six or more, ten or more, and preferably sixteen, biomarker analytes within a test sample taken from a mammal and compares the measured analyte concentrations to minimum diagnostic concentrations to diagnose, monitor, or determine obstructive uropathy or an associated renal disorder in a mammal. In this aspect, the biomarker analytes are known in the art to occur in the urine, plasma, serum and other bodily fluids of mammals. The biomarker analytes are proteins that have known and documented associations with early renal damage in humans. As defined herein, the biomarker analytes include but are not limited to alpha-1 microglobulin, beta-2 microglobulin, calbindin, clusterin, CTGF, creatinine, cystatin C, GST-alpha, KIM-1, microalbumin, NGAL, osteopontin, THP, TIMP-1, TFF-3, and VEGF. A description of each biomarker analyte is given below. In one embodiment, the biomarker analytes include alpha-1-microglobulin, beta-2-microglobulin, cystatin-C, KIM-1, THP, and TIMP-1.
(a) Alpha-1 Microglobulin (A1M)
Alpha-1 microglobulin (A1M, Swiss-Prot Accession Number P02760) is a 26 kDa glycoprotein synthesized by the liver and reabsorbed in the proximal tubules. Elevated levels of A1M in human urine are indicative of glomerulotubular dysfunction. A1M is a member of the lipocalin super family and is found in all tissues. Alpha-1-microglobulin exists in blood in both a free form and complexed with immunoglobulin A (IgA) and heme. Half of plasma A1M exists in a free form, and the remainder exists in complexes with other molecules including prothrombin, albumin, immunoglobulin A and heme. Nearly all of the free A1M in human urine is reabsorbed by the megalin receptor in proximal tubular cells, where it is then catabolized. Small amounts of A1M are excreted in the urine of healthy humans. Increased A1M concentrations in human urine may be an early indicator of renal damage, primarily in the proximal tubule.
(b) Beta-2 Microglobulin (B2M)
Beta-2 microglobulin (B2M, Swiss-Prot Accession Number P61769) is a protein found on the surfaces of all nucleated cells and is shed into the blood, particularly by tumor cells and lymphocytes. Due to its small size, B2M passes through the glomerular membrane, but normally less than 1% is excreted due to reabsorption of B2M in the proximal tubules of the kidney. Therefore, high plasma levels of B2M occur as a result of renal failure, inflammation, and neoplasms, especially those associated with B-lymphocytes.
(c) Calbindin
Calbindin (Calbindin D-28K, Swiss-Prot Accession Number P05937) is a Ca-binding protein belonging to the troponin C superfamily. It is expressed in the kidney, pancreatic islets, and brain. Calbindin is found predominantly in subpopulations of central and peripheral nervous system neurons, in certain epithelial cells involved in Ca2+ transport such as distal tubular cells and cortical collecting tubules of the kidney, and in enteric neuroendocrine cells.
(d) Clusterin
Clusterin (Swiss-Prot Accession Number P10909) is a highly conserved protein that has been identified independently by many different laboratories and named SGP2, S35-S45, apolipoprotein J, SP-40, 40, ADHC-9, gp80, GPIII, and testosterone-repressed prostate message (TRPM-2). An increase in clusterin levels has been consistently detected in apoptotic heart, brain, lung, liver, kidney, pancreas, and retinal tissue both in vivo and in vitro, establishing clusterin as a ubiquitous marker of apoptotic cell loss. However, clusterin protein has also been implicated in physiological processes that do not involve apoptosis, including the control of complement-mediated cell lysis, transport of beta-amyloid precursor protein, shuttling of aberrant beta-amyloid across the blood-brain barrier, lipid scavenging, membrane remodeling, cell aggregation, and protection from immune detection and tumor necrosis factor induced cell death.
(e) Connective Tissue Growth Factor (CTGF)
Connective tissue growth factor (CTGF, Swiss-Prot Accession Number P29279) is a 349-amino acid cysteine-rich polypeptide belonging to the CCN family. In vitro studies have shown that CTGF is mainly involved in extracellular matrix synthesis and fibrosis. Up-regulation of CTGF mRNA and increased CTGF levels have been observed in various diseases, including diabetic nephropathy and cardiomyopathy, fibrotic skin disorders, systemic sclerosis, biliary atresia, liver fibrosis and idiopathic pulmonary fibrosis, and nondiabetic acute and progressive glomerular and tubulointerstitial lesions of the kidney. A recent cross-sectional study found that urinary CTGF may act as a progression promoter in diabetic nephropathy.
(f) Creatinine
Creatinine is a metabolite of creatine phosphate in muscle tissue, and is typically produced at a relatively constant rate by the body. Creatinine is chiefly filtered out of the blood by the kidneys, though a small amount is actively secreted by the kidneys into the urine. Creatinine levels in blood and urine may be used to estimate the creatinine clearance, which is representative of the overall glomerular filtration rate (GFR), a standard measure of renal function. Variations in creatinine concentrations in the blood and urine, as well as variations in the ratio of urea to creatinine concentration in the blood, are common diagnostic measurements used to assess renal function.
(g) Cystatin C (Cyst C)
Cystatin C (Cyst C, Swiss-Prot Accession Number P01034) is a 13 kDa protein that is a potent inhibitor of the C1 family of cysteine proteases. It is the most abundant extracellular inhibitor of cysteine proteases in testis, epididymis, prostate, seminal vesicles and many other tissues. Cystatin C, which is normally expressed in vascular wall smooth muscle cells, is severely reduced in both atherosclerotic and aneurismal aortic lesions.
(h) Epidermal Growth Factor (EGF)
Epidermal growth factor (EGF, Swiss-Prot Accession Number P07522) is a small protein that functions as a potent mitogen. EGF promotes cell growth and differentiation, is essential in embryogenesis, and is important in wound healing. It is produced by many normal cell types and is made in large amounts by certain types of tumors.
(i) Glutathione S-Transferase alpha (GST-alpha)
Glutathione S-transferase alpha (GST-alpha, Swiss-Prot Accession Number P08263) belongs to a family of enzymes that utilize glutathione in reactions contributing to the transformation of a wide range of compounds, including carcinogens, therapeutic drugs, and products of oxidative stress. These enzymes play a key role in the detoxification of such substances.
(j) Glutathione S-Transferase mu (GST-mu)
Glutathione S-transferase mu (GST-mu, Swiss-Prot Accession Number PO4905) functions in the detoxification of electrophilic compounds, including carcinogens, therapeutic drugs, environmental toxins and products of oxidative stress, by conjugation with glutathione. The genes encoding the mu class of enzymes are organized in a gene cluster on chromosome 1 p13.3 and are known to be highly polymorphic. Genetic variations in GST-mu can change a mammal's susceptibility to carcinogens and toxins as well as affect the toxicity and efficacy of certain drugs. Null mutations of this class mu gene have been linked with an increase in a number of cancers.
(k) Kidney Injury Molecule-1 (KIM-1)
Kidney injury molecule-1 (KIM-1, Swiss-Prot Accession Number Q96D42) is an immunoglobulin superfamily cell-surface protein highly upregulated on the surface of injured kidney epithelial cells. It is also known as TIM-1 (T-cell immunoglobulin mucin domain-1), as it is expressed at low levels by subpopulations of activated T-cells and hepatitis A virus cellular receptor-1 (HAVCR-1). KIM-1 is increased in expression more than any other protein in the injured kidney and is localized predominantly to the apical membrane of the surviving proximal epithelial cells.
(l) Microalbumin
Albumin is the most abundant plasma protein in humans and other mammals. Albumin is essential for maintaining the osmotic pressure needed for proper distribution of body fluids between intravascular compartments and body tissues. Healthy, normal kidneys typically filter out albumin from the urine. The presence of albumin in the urine may indicate damage to the kidneys. Albumin in the urine may also occur in patients with long-standing diabetes, especially type 1 diabetes. The amount of albumin eliminated in the urine has been used to differentially diagnose various renal disorders. For example, nephrotic syndrome usually results in the excretion of about 3.0 to 3.5 grams of albumin in human urine every 24 hours. Microalbuminuria, in which less than 300 mg of albumin is eliminated in the urine every 24 hours, may indicate the early stages of diabetic nephropathy.
(m) Neutrophil Gelatinase-Associated Lipocalin (NGAL)
Neutrophil gelatinase-associated lipocalin (NGAL, Swiss-Prot Accession Number P80188) forms a disulfide bond-linked heterodimer with MMP-9. It mediates an innate immune response to bacterial infection by sequestrating iron. Lipocalins interact with many different molecules such as cell surface receptors and proteases, and play a role in a variety of processes such as the progression of cancer and allergic reactions.
(n) Osteopontin (OPN)
Osteopontin (OPN, Swiss-Prot Accession Number P10451) is a cytokine involved in enhancing production of interferon-gamma and IL-12, and inhibiting the production of IL-10. OPN is essential in the pathway that leads to type I immunity. OPN appears to form an integral part of the mineralized matrix. OPN is synthesized within the kidney and has been detected in human urine at levels that may effectively inhibit calcium oxalate crystallization. Decreased concentrations of OPN have been documented in urine from patients with renal stone disease compared with normal individuals.
(o) Tamm-Horsfall Protein (THP)
Tamm-Horsfall protein (THP, Swiss-Prot Accession Number P07911), also known as uromodulin, is the most abundant protein present in the urine of healthy subjects and has been shown to decrease in individuals with kidney stones. THP is secreted by the thick ascending limb of the loop of Henley. THP is a monomeric glycoprotein of ˜85 kDa with ˜30% carbohydrate moiety that is heavily glycosylated. THP may act as a constitutive inhibitor of calcium crystallization in renal fluids.
(p) Tissue Inhibitor of Metalloproteinase-1 (TIMP-1)
Tissue inhibitor of metalloproteinase-1 (TIMP-1, Swiss-Prot Accession Number P01033) is a major regulator of extracellular matrix synthesis and degradation. A certain balance of MMPs and TIMPs is essential for tumor growth and health. Fibrosis results from an imbalance of fibrogenesis and fibrolysis, highlighting the importance of the role of the inhibition of matrix degradation role in renal disease.
(q) Trefoil Factor 3 (TFF3)
Trefoil factor 3 (TFF3, Swiss-Prot Accession Number Q07654), also known as intestinal trefoil factor, belongs to a small family of mucin-associated peptides that include TFF1, TFF2, and TFF3. TFF3 exists in a 60-amino acid monomeric form and a 118-amino acid dimeric form. Under normal conditions TFF3 is expressed by goblet cells of the intestine and the colon. TFF3 expression has also been observed in the human respiratory tract, in human goblet cells and in the human salivary gland. In addition, TFF3 has been detected in the human hypothalamus.
(r) Vascular Endothelial Growth Factor (VEGF)
Vascular endothelial growth factor (VEGF, Swiss-Prot Accession Number P15692) is an important factor in the pathophysiology of neuronal and other tumors, most likely functioning as a potent promoter of angiogenesis. VEGF may also be involved in regulating blood-brain-barrier functions under normal and pathological conditions. VEGF secreted from the stromal cells may be responsible for the endothelial cell proliferation observed in capillary hemangioblastomas, which are typically composed of abundant microvasculature and primitive angiogenic elements represented by stromal cells.
(s) Vascular Endothelial Growth Factor A (VEGF A)
Vascular endothelial growth factor A (VEGF A, Swiss-Prot Accession Number Q00731) is a growth factor active in angiogenesis, vasculogenesis and endothelial cell growth. It induces endothelial cell proliferation, promotes cell migration, inhibits apoptosis, and induces permeabilization of blood vessles. It is important in the pathophysiology of neuronal and other tumors, likely functioning as a potent promoter of angiogenesis. Due to its influences on vascular permeability, VEGF A may be involved in altering blood-brain-barrier functions under normal and pathological conditions. The production and secretion of VEGF by mammalian retinal pigment epithelial cells may be important in the pathogenesis of ocular neovascularization.
(t) B-lymphocyte Chemoattractant (BLC)
B-lymphocyte chemoattractant (BLC, Swiss-Prot Accession Number 043927) is also referred to as C-X-C motif chemokine 13, Small-inducible cytokine B13, B lymphocyte chemoattractant, CXC chemokine BLC, and B cell-attracting chemokine 1. BLC functions as a potent chemoattractant for B lymphocytes, but not T lymphocytes, monocytes, or neutrophils. Its specific receptor BLR1 is a G protein-coupled receptor originally isolated from Burkitt's lymphoma cells. Among cells of the hematopoietic lineages, the expression of BRL1, now designated CXCR5, is restricted to B lymphocytes and a subpopulation of T helper memory cells.
(u) Cluster of Differentiation Surface Receptors 40 (CD40)
Cluster of Differentiation Surface Receptors 40 (CD40, Swiss Prot Accession Number P25942) is also referred to TNFRSF5 (Tumor necrosis factor receptor superfamily member 5. CD40 is a member of the tumor necrosis factor-receptor superfamily of proteins. CD40 has been found to be essential in mediating a broad variety of immune and inflammatory responses including T cell-dependent immunoglobulin class switching, memory B cell development, and germinal center formation.
(v) Insulin-Like Growth Factor Binding Protein 2 (IGF BP2)
Insulin-like Growth Factor Binding Protein 2 (IGF BP2, Swiss Prot Accession Number P18065) functions to prolong the half-life of the insulin growth factors and have been shown to either inhibit or stimulate the growth promoting effects of the insulin growth factors on cell culture. Specifically, during development, insulin-like growth factor binding protein-2 is expressed in a number of tissues with the highest expression level found in the central nervous system. IGFBP-2 exhibits a 2-10 fold higher affinity for IGF II than for IGF I.
(w) Matrix Metalloproteinase-3 (MMP3)
Matrix Metalloproteinase-3 (MMP3, Swiss Prot Accession Number P08254) is also known as stromelysin-1 and Transin-1. MMP3 is involved in the breakdown of extracellular matrix in normal physiological processes, such as embryonic development, reproduction, and tissue remodeling, as well as in disease processes, such as arthritis and metastasis. Most MMP's are secreted as inactive proproteins which are activated when cleaved by extracellular proteinases. MMP3 encodes an enzyme which degrades fibronectin, laminin, collagens III, IV, IX, and X, and cartilage proteoglycans. The enzyme is thought to be involved in wound repair, progression of atherosclerosis, and tumor initiation. MMP3 is part of a cluster of MMP genes which localize to chromosome 11q22.3.
(x) Peptide YY (PYY)
Peptide YY (PYY, Swiss-Prot Accession Number P10082) is also known as peptide tyrosine tyrosine and pancreatic peptide YY3-36. Peptide YY exerts its action through neuropeptide Y receptors, inhibits gastric motility and increases water and electrolyte absorption in the colon. PYY may also suppress pancreatic secretion. It is secreted by the neuroendocrine cells in the ileum and colon in response to a meal, and has been shown to reduce appetite. PYY works by slowing the gastric emptying; hence, it increases efficiency of digestion and nutrient absorption after meal. Research has also indicated that PYY may be useful in removing aluminum accumulated in the brain.
(y) Stem Cell Factor (SCF)
Stem Cell Factor (SCF, UniProtKB/TrEMBL Q13528) is also known as kit-ligand, KL, and steel factor. SCF functions SCF plays an important role in the hematopoiesis during embryonic development. Sites where hematopoiesis takes place, such as the fetal liver and bone marrow, all express SCF. SCF may serve as guidance cues that direct hematopoietic stem cells (HSCs) to their stem cell niche (the microenvironment in which a stem cell resides), and it plays an important role in HSC maintenance. Non-lethal point mutants on the c-Kit receptor can cause anemia, decreased fertility, and decreased pigmentation. During development, the presence of the SCF also plays an important role in the localization of melanocytes, cells that produce melanin and control pigmentation. In melanogenisis, melanoblasts migrate from the neural crest to their appropriate locations in the epidermis. Melanoblasts express the Kit receptor, and it is believed that SCF guides these cells to their terminal locations. SCF also regulates survival and proliferation of fully differentiated melanocytes in adults. In spermatogenesis, c-Kit is expressed in primordial germ cells, spermatogonia, and in primordial oocytes. It is also expressed in the primordial germ cells of females. SCF is expressed along the pathways that the germ cells use to reach their terminal destination in the body. It is also expressed in the final destinations for these cells. Like for melanoblasts, this helps guide the cells to their appropriate locations in the body
(z) Tumor Necrosis Factor Receptor Type II (TNF RII)
Tumor Necrosis Factor Receptor Type II (TNF RII, Swiss-Prot Accession Number P20333) is also known as p75, p80 TNF alpha receptor, and TNFRSF1B. TNF RII is a protein that in humans is encoded by the TNFRSF1B gene. The protein encoded by this gene is a member of the Tumor necrosis factor receptor superfamily, which also contains TNFRSF1A. The protein encoded by this gene is a member of the TNF-receptor superfamily. This protein and TNF-receptor 1 form a heterocomplex that mediates the recruitment of two anti-apoptotic proteins, c-IAP1 and c-IAP2, which possess E3 ubiquitin ligase activity. The function of IAPs in TNF-receptor signaling is unknown; however, c-IAP1 is thought to potentiate TNF-induced apoptosis by the ubiquitination and degradation of TNF-receptor-associated factor 2, which mediates anti-apoptotic signals. Knockout studies in mice also suggest a role of this protein in protecting neurons from apoptosis by stimulating antioxidative pathways.
(aa) AXL Oncogene
AXL (Swiss-Prot Accession Number P30530) is also known as UFO, ARK, and tyrosine-protein kinase receptor UFO. The protein encoded by AXL is a member of the receptor tyrosine kinase subfamily. Although it is similar to other receptor tyrosine kinases, the AXL protein represents a unique structure of the extracellular region that juxtaposes IgL and FNIII repeats. AXL transduces signals from the extracellular matrix into the cytoplasm by binding growth factors like vitamin K-dependent protein growth-arrest-specific gene 6. It is involved in the stimulation of cell proliferation. This receptor can also mediate cell aggregation by homophilic binding. AXL is a chronic myelogenous leukemia-associated oncogene and also associated with colon cancer and melanoma.
(bb) Eotaxin 3
Eotaxin 3 (Swiss-Prot Accession Number P51671) is also known as C-C motif chemokine 11 (CCL11), small inducible cytokine A11, and eosinophil chemotactic protein. Eotaxin 3 is a small cytokine belonging to the CC chemokine family that is also called Eotaxin-3, Macrophage inflammatory protein 4-alpha (MIP-4-alpha), Thymic stroma chemokine-1 (TSC-1), and IMAC. It is expressed by several tissues including heart, lung and ovary, and in endothelial cells that have been stimulated with the cytokine interleukin 4.[1][2] CCL26 is chemotactic for eosinophils and basophils and elicits its effects by binding to the cell surface chemokine receptor CCR3.
(cc) Fatty Acid Binding Protein (FABP)
Fatty Acid Binding Protein (FABP, Swiss-Prot Accession Number Q01469) is also known as epidermal-type fatty acid binding protein, and fatty-acid binding protein 5. This gene encodes the fatty acid binding protein found in epidermal cells, and was first identified as being upregulated in psoriasis tissue. Fatty acid binding proteins are a family of small, highly conserved, cytoplasmic proteins that bind long-chain fatty acids and other hydrophobic ligands. It is thought that FABPs roles include fatty acid uptake, transport, and metabolism.
(dd) Basic Fibroblast Growth Factor (FGF basic)
Basic Fibroblast Growth Factor (FGF basic, Swiss-Prot Accession NumberP09038) is also known as heparin-binding growth factor. In normal tissue, basic fibroblast growth factor is present in basement membranes and in the subendothelial extracellular matrix of blood vessels. It stays membrane-bound as long as there is no signal peptide. It has been hypothesized that, during both wound healing of normal tissues and tumor development, the action of heparan sulfate-degrading enzymes activates FGF basic, thus mediating the formation of new blood vessels. Additionally, FGF basic is a critical component of human embryonic stem cell culture medium; the growth factor is necessary for the cells to remain in an undifferentiated state, although the mechanisms by which it does this are poorly defined. It has been demonstrated to induce gremlin expression which in turn is known to inhibit the induction of differentiation by bone morphogenetic proteins. It is necessary in mouse-feeder cell dependent culture systems, as well as in feeder and serum-free culture systems.
(ee) Myoglobin
Myoglobin (Swiss-Prot Accession Number P02144) is released from damaged muscle tissue (rhabdomyolysis), which has very high concentrations of myoglobin. The released myoglobin is filtered by the kidneys but is toxic to the renal tubular epithelium and so may cause acute renal failure. Myoglobin is a sensitive marker for muscle injury, making it a potential marker for heart attack in patients with chest pain.
(ff) Resistin (RETN)
Resistin (RETN, UniProtKB/TrEMBL Q76B53) is theorized to participate in the inflammatory response. Resistin has also been shown to increase transcriptional events leading to an increased expression of several pro-inflammatory cytokines including (but not limited to) interleukin-1 (IL-1), interleukin-6 (IL-6), interleukin-12 (IL-12), and tumor necrosis factor-α (TNF-α) in an NF-KB-mediated fashion. It has also been demonstrated that resistin upregulates intracellular adhesion molecule-1 (ICAM1) vascular cell-adhesion molecule-1 (VCAM1) and CCL2, all of which are occupied in chemotactic pathways involved in leukocyte recruitment to sites of infection. Resistin itself can be upregulated by interleukins and also by microbial antigens such as lipopolysaccharide, which are recognized by leukocytes. Taken together, because resistin is reputed to contribute to insulin resistance, results such as those mentioned suggest that resistin may be a link in the well-known association between inflammation and insulin resistance. In fact, recent data have shown positive correlations between obesity, insulin resistance, and chronic inflammation which is believed to be directed in part by resistin signaling.
(gg) Tumor Necrosis Factor-Related Apoptosis-Inducing Ligand Receptor 3 (TRAIL R3)
TRAIL R3 (Swiss-Prot Accession Number P83626 (mouse)) is also known as tumor necrosis factor-related apoptosis-inducing ligand receptor 3, and tumor necrosis factor receptor mouse homolog. TRAIL R3 is a decoy receptor for TRAIL, a member of the tumor necrosis factor family. In several cell types decoy receptors inhibit TRAIL-induced apoptosis by binding TRAIL and thus preventing its binding to proapoptotic TRAIL receptors.
(hh) Endothelin 1 (ET1)
Endothelin 1 (ET1, UniProtKB/TrEMBL Q6FH53) is also known as EDN1 and EDN1 protein. Endothelin 1 is a protein that constricts blood vessels and raises blood pressure. It is normally kept in balance by other mechanisms, but when over-expressed, it contributes to high blood pressure (hypertension) and heart disease. Endothelin 1 peptides and receptors are implicated in the pathogenesis of a number of disease states, including cancer and heart disease.
(ii) Neuronal Cell Adhesion Molecule (NrCAM)
Neuronal Cell Adhesion Molecule (NrCAM, UniProtKB/TrEMBL Q14CA1) encodes a neuronal cell adhesion molecule with multiple immunoglobulin-like C2-type domains and fibronectin type-III domains. This ankyrin-binding protein is involved in neuron-neuron adhesion and promotes directional signaling during axonal cone growth. This gene is also expressed in non-neural tissues and may play a general role in cell-cell communication via signaling from its intracellular domain to the actin cytoskeleton during directional cell migration. Allelic variants of this gene have been associated with autism and addiction vulnerability.
(jj) Tenascin C (TN-C)
Tenascin C (TN-C, UniProt/TrEMBL Q99857) has anti-adhesive properties, causing cells in tissue culture to become rounded after it is added to the medium. One mechanism to explain this may come from its ability to bind to the extracellular matrix glycoprotein fibronectin and block fibronectin's interactions with specific syndecans. The expression of tenascin-C in the stroma of certain tumors is associated with a poor prognosis.
(kk) Vascular Cell Adhesion Molecule 1 (VCAM1)
Vascular Cell Adhesion Molecule 1 (VCAM1, Swiss-Prot Accession Number P19320) is also known as vascular cell adhesion protein 1. VCAM1 mediates the adhesion of lymphocytes, monocytes, eosinophils, and basophils to vascular endothelium. It also functions in leukocyte-endothelial cell signal transduction, and it may play a role in the development of atherosclerosis and rheumatoid arthritis. Upregulation of VCAM-1 in endothelial cells by cytokines occurs as a result of increased gene transcription (e.g., in response to Tumor necrosis factor-alpha (TNF-α) and Interleukin-1 (IL-1)) and through stabilization of Messenger RNA (mRNA) (e.g., Interleukin-4 (IL-4)). The promoter region of the VCAM-1 gene contains functional tandem NF-κB (nuclear factor-kappa B) sites. The sustained expression of VCAM-1 lasts over 24 hours. Primarily, the VCAM-1 protein is an endothelial ligand for VLA-4 (Very Late Antigen-4 or α4β1) of the β1 subfamily of integrins, and for integrin α4β7. VCAM-1 expression has also been observed in other cell types (e.g., smooth muscle cells). It has also been shown to interact with EZR and Moesin. Certain melanoma cells can use VCAM-1 to adhere to the endothelium, and VCAM-1 may participate in monocyte recruitment to atherosclerotic sites.
(ll) Cortisol
Cortisol (Swiss-Prot Accession Number P08185) is also known as corticosteroid-binding globulin, transcortin, and Serpin A6. Cortisol is a steroid hormone or glucocorticoid produced by the adrenal gland. It is released in response to stress, and to a low level of blood glucocorticoids. Its primary functions are to increase blood sugar through gluconeogenesis, suppress the immune system, and aid in fat, protein and carbohydrate metabolism. It also decreases bone formation. In addition, cortisol can weaken the activity of the immune system. Cortisol prevents proliferation of T-cells by rendering the interleukin-2 producer T-cells unresponsive to interleukin-1 (IL-1), and unable to produce the T-cell growth factor. Cortisol also has a negative feedback effect on interleukin-1. IL-1 must be especially useful in combating some diseases; however, endotoxin bacteria have gained an advantage by forcing the hypothalamus to increase cortisol levels via forcing secretion of CRH hormone, thus antagonizing IL-1 in this case. The suppressor cells are not affected by GRMF, so that the effective set point for the immune cells may be even higher than the set point for physiological processes. It reflects leukocyte redistribution to lymph nodes, bone marrow, and skin.
II. Combinations of Analytes Measured by Multiplexed Assay
The device for diagnosing, monitoring, or determining a renal disorder involves determining the presence or concentrations of a combination of sample analytes in a test sample. The combinations of sample analytes, as defined herein, are any group of three or more analytes selected from the biomarker analytes, including but not limited to alpha-1 microglobulin, beta-2 microglobulin, calbindin, clusterin, CTGF, creatinine, cystatin C, GST-alpha, KIM-1, microalbumin, NGAL, osteopontin, THP, TIMP-1, TFF-3, VEGF, BLC, CD40, IGF BP2, MMP3, peptide YY, stem cell factor, TNF RII, AXL, Eotaxin 3, FABP, FGF basic, myoglobin, resistin, TRAIL R3, endothelin 1, NrCAM, Tenascin C, VCAM1, and cortisol. In one embodiment, the combination of analytes may be selected to provide a group of analytes associated with renal disorder in a mammal.
In one embodiment, the devices and systems of the current invention detect the combination of sample analytes, and may include any three of the biomarker analytes. In other embodiments, the combination of sample analytes may be any four, any five, any six, any seven, any eight, any nine, any ten, any eleven, any twelve, any thirteen, any fourteen, any fifteen, or all sixteen of the sixteen biomarker analytes. In another embodiment, the combination of sample analytes may comprise a combination listed in Table A.
| TABLE A | |||
| alpha-1 microglobulin | beta-2 microglobulin | calbindin | |
| alpha-1 microglobulin | beta-2 microglobulin | clusterin | |
| alpha-1 microglobulin | beta-2 microglobulin | CTGF | |
| alpha-1 microglobulin | beta-2 microglobulin | creatinine | |
| alpha-1 microglobulin | beta-2 microglobulin | cystatin C | |
| alpha-1 microglobulin | beta-2 microglobulin | GST-alpha | |
| alpha-1 microglobulin | beta-2 microglobulin | KIM-1 | |
| alpha-1 microglobulin | beta-2 microglobulin | microalbumin | |
| alpha-1 microglobulin | beta-2 microglobulin | NGAL | |
| alpha-1 microglobulin | beta-2 microglobulin | osteopontin | |
| alpha-1 microglobulin | beta-2 microglobulin | THP | |
| alpha-1 microglobulin | beta-2 microglobulin | TIMP-1 | |
| alpha-1 microglobulin | beta-2 microglobulin | TFF-3 | |
| alpha-1 microglobulin | beta-2 microglobulin | VEGF | |
| alpha-1 microglobulin | calbindin | clusterin | |
| alpha-1 microglobulin | calbindin | CTGF | |
| alpha-1 microglobulin | calbindin | creatinine | |
| alpha-1 microglobulin | calbindin | cystatin C | |
| alpha-1 microglobulin | calbindin | GST-alpha | |
| alpha-1 microglobulin | calbindin | KIM-1 | |
| alpha-1 microglobulin | calbindin | microalbumin | |
| alpha-1 microglobulin | calbindin | NGAL | |
| alpha-1 microglobulin | calbindin | osteopontin | |
| alpha-1 microglobulin | calbindin | THP | |
| alpha-1 microglobulin | calbindin | TIMP-1 | |
| alpha-1 microglobulin | calbindin | TFF-3 | |
| alpha-1 microglobulin | calbindin | VEGF | |
| alpha-1 microglobulin | clusterin | CTGF | |
| alpha-1 microglobulin | clusterin | creatinine | |
| alpha-1 microglobulin | clusterin | cystatin C | |
| alpha-1 microglobulin | clusterin | GST-alpha | |
| alpha-1 microglobulin | clusterin | KIM-1 | |
| alpha-1 microglobulin | clusterin | microalbumin | |
| alpha-1 microglobulin | clusterin | NGAL | |
| alpha-1 microglobulin | clusterin | osteopontin | |
| alpha-1 microglobulin | clusterin | THP | |
| alpha-1 microglobulin | clusterin | TIMP-1 | |
| alpha-1 microglobulin | clusterin | TFF-3 | |
| alpha-1 microglobulin | clusterin | VEGF | |
| alpha-1 microglobulin | CTGF | creatinine | |
| alpha-1 microglobulin | CTGF | cystatin C | |
| alpha-1 microglobulin | CTGF | GST-alpha | |
| alpha-1 microglobulin | CTGF | KIM-1 | |
| alpha-1 microglobulin | CTGF | microalbumin | |
| alpha-1 microglobulin | CTGF | NGAL | |
| alpha-1 microglobulin | CTGF | osteopontin | |
| alpha-1 microglobulin | CTGF | THP | |
| alpha-1 microglobulin | CTGF | TIMP-1 | |
| alpha-1 microglobulin | CTGF | TFF-3 | |
| alpha-1 microglobulin | CTGF | VEGF | |
| alpha-1 microglobulin | creatinine | cystatin C | |
| alpha-1 microglobulin | creatinine | GST-alpha | |
| alpha-1 microglobulin | creatinine | KIM-1 | |
| alpha-1 microglobulin | creatinine | microalbumin | |
| alpha-1 microglobulin | creatinine | NGAL | |
| alpha-1 microglobulin | creatinine | osteopontin | |
| alpha-1 microglobulin | creatinine | THP | |
| alpha-1 microglobulin | creatinine | TIMP-1 | |
| alpha-1 microglobulin | creatinine | TFF-3 | |
| alpha-1 microglobulin | creatinine | VEGF | |
| alpha-1 microglobulin | cystatin C | GST-alpha | |
| alpha-1 microglobulin | cystatin C | KIM-1 | |
| alpha-1 microglobulin | cystatin C | microalbumin | |
| alpha-1 microglobulin | cystatin C | NGAL | |
| alpha-1 microglobulin | cystatin C | osteopontin | |
| alpha-1 microglobulin | cystatin C | THP | |
| alpha-1 microglobulin | cystatin C | TIMP-1 | |
| alpha-1 microglobulin | cystatin C | TFF-3 | |
| alpha-1 microglobulin | cystatin C | VEGF | |
| alpha-1 microglobulin | GST-alpha | KIM-1 | |
| alpha-1 microglobulin | GST-alpha | microalbumin | |
| alpha-1 microglobulin | GST-alpha | NGAL | |
| alpha-1 microglobulin | GST-alpha | osteopontin | |
| alpha-1 microglobulin | GST-alpha | THP | |
| alpha-1 microglobulin | GST-alpha | TIMP-1 | |
| alpha-1 microglobulin | GST-alpha | TFF-3 | |
| alpha-1 microglobulin | GST-alpha | VEGF | |
| alpha-1 microglobulin | KIM-1 | microalbumin | |
| alpha-1 microglobulin | KIM-1 | NGAL | |
| alpha-1 microglobulin | KIM-1 | osteopontin | |
| alpha-1 microglobulin | KIM-1 | THP | |
| alpha-1 microglobulin | KIM-1 | TIMP-1 | |
| alpha-1 microglobulin | KIM-1 | TFF-3 | |
| alpha-1 microglobulin | KIM-1 | VEGF | |
| alpha-1 microglobulin | microalbumin | NGAL | |
| alpha-1 microglobulin | microalbumin | osteopontin | |
| alpha-1 microglobulin | microalbumin | THP | |
| alpha-1 microglobulin | microalbumin | TIMP-1 | |
| alpha-1 microglobulin | microalbumin | TFF-3 | |
| alpha-1 microglobulin | microalbumin | VEGF | |
| alpha-1 microglobulin | NGAL | osteopontin | |
| alpha-1 microglobulin | NGAL | THP | |
| alpha-1 microglobulin | NGAL | TIMP-1 | |
| alpha-1 microglobulin | NGAL | TFF-3 | |
| alpha-1 microglobulin | NGAL | VEGF | |
| alpha-1 microglobulin | osteopontin | THP | |
| alpha-1 microglobulin | osteopontin | TIMP-1 | |
| alpha-1 microglobulin | osteopontin | TFF-3 | |
| alpha-1 microglobulin | osteopontin | VEGF | |
| alpha-1 microglobulin | THP | TIMP-1 | |
| alpha-1 microglobulin | THP | TFF-3 | |
| alpha-1 microglobulin | THP | VEGF | |
| alpha-1 microglobulin | TIMP-1 | TFF-3 | |
| alpha-1 microglobulin | TIMP-1 | VEGF | |
| alpha-1 microglobulin | TFF-3 | VEGF | |
| beta-2 microglobulin | calbindin | clusterin | |
| beta-2 microglobulin | calbindin | CTGF | |
| beta-2 microglobulin | calbindin | creatinine | |
| beta-2 microglobulin | calbindin | cystatin C | |
| beta-2 microglobulin | calbindin | GST-alpha | |
| beta-2 microglobulin | calbindin | KIM-1 | |
| beta-2 microglobulin | calbindin | microalbumin | |
| beta-2 microglobulin | calbindin | NGAL | |
| beta-2 microglobulin | calbindin | osteopontin | |
| beta-2 microglobulin | calbindin | THP | |
| beta-2 microglobulin | calbindin | TIMP-1 | |
| beta-2 microglobulin | calbindin | TFF-3 | |
| beta-2 microglobulin | calbindin | VEGF | |
| beta-2 microglobulin | clusterin | CTGF | |
| beta-2 microglobulin | clusterin | creatinine | |
| beta-2 microglobulin | clusterin | cystatin C | |
| beta-2 microglobulin | clusterin | GST-alpha | |
| beta-2 microglobulin | clusterin | KIM-1 | |
| beta-2 microglobulin | clusterin | microalbumin | |
| beta-2 microglobulin | clusterin | NGAL | |
| beta-2 microglobulin | clusterin | osteopontin | |
| beta-2 microglobulin | clusterin | THP | |
| beta-2 microglobulin | clusterin | TIMP-1 | |
| beta-2 microglobulin | clusterin | TFF-3 | |
| beta-2 microglobulin | clusterin | VEGF | |
| beta-2 microglobulin | CTGF | creatinine | |
| beta-2 microglobulin | CTGF | cystatin C | |
| beta-2 microglobulin | CTGF | GST-alpha | |
| beta-2 microglobulin | CTGF | KIM-1 | |
| beta-2 microglobulin | CTGF | microalbumin | |
| beta-2 microglobulin | CTGF | NGAL | |
| beta-2 microglobulin | CTGF | osteopontin | |
| beta-2 microglobulin | CTGF | THP | |
| beta-2 microglobulin | CTGF | TIMP-1 | |
| beta-2 microglobulin | CTGF | TFF-3 | |
| beta-2 microglobulin | CTGF | VEGF | |
| beta-2 microglobulin | creatinine | cystatin C | |
| beta-2 microglobulin | creatinine | GST-alpha | |
| beta-2 microglobulin | creatinine | KIM-1 | |
| beta-2 microglobulin | creatinine | microalbumin | |
| beta-2 microglobulin | creatinine | NGAL | |
| beta-2 microglobulin | creatinine | osteopontin | |
| beta-2 microglobulin | creatinine | THP | |
| beta-2 microglobulin | creatinine | TIMP-1 | |
| beta-2 microglobulin | creatinine | TFF-3 | |
| beta-2 microglobulin | creatinine | VEGF | |
| beta-2 microglobulin | cystatin C | GST-alpha | |
| beta-2 microglobulin | cystatin C | KIM-1 | |
| beta-2 microglobulin | cystatin C | microalbumin | |
| beta-2 microglobulin | cystatin C | NGAL | |
| beta-2 microglobulin | cystatin C | osteopontin | |
| beta-2 microglobulin | cystatin C | THP | |
| beta-2 microglobulin | cystatin C | TIMP-1 | |
| beta-2 microglobulin | cystatin C | TFF-3 | |
| beta-2 microglobulin | cystatin C | VEGF | |
| beta-2 microglobulin | GST-alpha | KIM-1 | |
| beta-2 microglobulin | GST-alpha | microalbumin | |
| beta-2 microglobulin | GST-alpha | NGAL | |
| beta-2 microglobulin | GST-alpha | osteopontin | |
| beta-2 microglobulin | GST-alpha | THP | |
| beta-2 microglobulin | GST-alpha | TIMP-1 | |
| beta-2 microglobulin | GST-alpha | TFF-3 | |
| beta-2 microglobulin | GST-alpha | VEGF | |
| beta-2 microglobulin | KIM-1 | microalbumin | |
| beta-2 microglobulin | KIM-1 | NGAL | |
| beta-2 microglobulin | KIM-1 | osteopontin | |
| beta-2 microglobulin | KIM-1 | THP | |
| beta-2 microglobulin | KIM-1 | TIMP-1 | |
| beta-2 microglobulin | KIM-1 | TFF-3 | |
| beta-2 microglobulin | KIM-1 | VEGF | |
| beta-2 microglobulin | microalbumin | NGAL | |
| beta-2 microglobulin | microalbumin | osteopontin | |
| beta-2 microglobulin | microalbumin | THP | |
| beta-2 microglobulin | microalbumin | TIMP-1 | |
| beta-2 microglobulin | microalbumin | TFF-3 | |
| beta-2 microglobulin | microalbumin | VEGF | |
| beta-2 microglobulin | NGAL | osteopontin | |
| beta-2 microglobulin | NGAL | THP | |
| beta-2 microglobulin | NGAL | TIMP-1 | |
| beta-2 microglobulin | NGAL | TFF-3 | |
| beta-2 microglobulin | NGAL | VEGF | |
| beta-2 microglobulin | osteopontin | THP | |
| beta-2 microglobulin | osteopontin | TIMP-1 | |
| beta-2 microglobulin | osteopontin | TFF-3 | |
| beta-2 microglobulin | osteopontin | VEGF | |
| beta-2 microglobulin | THP | TIMP-1 | |
| beta-2 microglobulin | THP | TFF-3 | |
| beta-2 microglobulin | THP | VEGF | |
| beta-2 microglobulin | TIMP-1 | TFF-3 | |
| beta-2 microglobulin | TIMP-2 | VEGF | |
| beta-2 microglobulin | TFF-3 | VEGF | |
| calbindin | clusterin | CTGF | |
| calbindin | clusterin | creatinine | |
| calbindin | clusterin | cystatin C | |
| calbindin | clusterin | GST-alpha | |
| calbindin | clusterin | KIM-1 | |
| calbindin | clusterin | microalbumin | |
| calbindin | clusterin | NGAL | |
| calbindin | clusterin | osteopontin | |
| calbindin | clusterin | THP | |
| calbindin | clusterin | TIMP-1 | |
| calbindin | clusterin | TFF-3 | |
| calbindin | clusterin | VEGF | |
| calbindin | CTGF | creatinine | |
| calbindin | CTGF | cystatin C | |
| calbindin | CTGF | GST-alpha | |
| calbindin | CTGF | KIM-1 | |
| calbindin | CTGF | microalbumin | |
| calbindin | CTGF | NGAL | |
| calbindin | CTGF | osteopontin | |
| calbindin | CTGF | THP | |
| calbindin | CTGF | TIMP-1 | |
| calbindin | CTGF | TFF-3 | |
| calbindin | CTGF | VEGF | |
| calbindin | creatinine | cystatin C | |
| calbindin | creatinine | GST-alpha | |
| calbindin | creatinine | KIM-1 | |
| calbindin | creatinine | microalbumin | |
| calbindin | creatinine | NGAL | |
| calbindin | creatinine | osteopontin | |
| calbindin | creatinine | THP | |
| calbindin | creatinine | TIMP-1 | |
| calbindin | creatinine | TFF-3 | |
| calbindin | creatinine | VEGF | |
| calbindin | cystatin C | GST-alpha | |
| calbindin | cystatin C | KIM-1 | |
| calbindin | cystatin C | microalbumin | |
| calbindin | cystatin C | NGAL | |
| calbindin | cystatin C | osteopontin | |
| calbindin | cystatin C | THP | |
| calbindin | cystatin C | TIMP-1 | |
| calbindin | cystatin C | TFF-3 | |
| calbindin | cystatin C | VEGF | |
| calbindin | GST-alpha | KIM-1 | |
| calbindin | GST-alpha | microalbumin | |
| calbindin | GST-alpha | NGAL | |
| calbindin | GST-alpha | osteopontin | |
| calbindin | GST-alpha | THP | |
| calbindin | GST-alpha | TIMP-1 | |
| calbindin | GST-alpha | TFF-3 | |
| calbindin | GST-alpha | VEGF | |
| calbindin | KIM-1 | microalbumin | |
| calbindin | KIM-1 | NGAL | |
| calbindin | KIM-1 | osteopontin | |
| calbindin | KIM-1 | THP | |
| calbindin | KIM-1 | TIMP-1 | |
| calbindin | KIM-1 | TFF-3 | |
| calbindin | KIM-1 | VEGF | |
| calbindin | microalbumin | NGAL | |
| calbindin | microalbumin | osteopontin | |
| calbindin | microalbumin | THP | |
| calbindin | microalbumin | TIMP-1 | |
| calbindin | microalbumin | TFF-3 | |
| calbindin | microalbumin | VEGF | |
| calbindin | NGAL | osteopontin | |
| calbindin | NGAL | THP | |
| calbindin | NGAL | TIMP-1 | |
| calbindin | NGAL | TFF-3 | |
| calbindin | NGAL | VEGF | |
| calbindin | osteopontin | THP | |
| calbindin | osteopontin | TIMP-1 | |
| calbindin | osteopontin | TFF-3 | |
| calbindin | osteopontin | VEGF | |
| calbindin | THP | TIMP-1 | |
| calbindin | THP | TFF-3 | |
| calbindin | THP | VEGF | |
| calbindin | TIMP-1 | TFF-3 | |
| calbindin | TIMP-1 | VEGF | |
| calbindin | TFF-3 | VEGF | |
| clusterin | CTGF | creatinine | |
| clusterin | CTGF | cystatin C | |
| clusterin | CTGF | GST-alpha | |
| clusterin | CTGF | KIM-1 | |
| clusterin | CTGF | microalbumin | |
| clusterin | CTGF | NGAL | |
| clusterin | CTGF | osteopontin | |
| clusterin | CTGF | THP | |
| clusterin | CTGF | TIMP-1 | |
| clusterin | CTGF | TFF-3 | |
| clusterin | CTGF | VEGF | |
| clusterin | creatinine | cystatin C | |
| clusterin | creatinine | GST-alpha | |
| clusterin | creatinine | KIM-1 | |
| clusterin | creatinine | microalbumin | |
| clusterin | creatinine | NGAL | |
| clusterin | creatinine | osteopontin | |
| clusterin | creatinine | THP | |
| clusterin | creatinine | TIMP-1 | |
| clusterin | creatinine | TFF-3 | |
| clusterin | creatinine | VEGF | |
| clusterin | cystatin C | GST-alpha | |
| clusterin | cystatin C | KIM-1 | |
| clusterin | cystatin C | microalbumin | |
| clusterin | cystatin C | NGAL | |
| clusterin | cystatin C | osteopontin | |
| clusterin | cystatin C | THP | |
| clusterin | cystatin C | TIMP-1 | |
| clusterin | cystatin C | TFF-3 | |
| clusterin | cystatin C | VEGF | |
| clusterin | GST-alpha | KIM-1 | |
| clusterin | GST-alpha | microalbumin | |
| clusterin | GST-alpha | NGAL | |
| clusterin | GST-alpha | osteopontin | |
| clusterin | GST-alpha | THP | |
| clusterin | GST-alpha | TIMP-1 | |
| clusterin | GST-alpha | TFF-3 | |
| clusterin | GST-alpha | VEGF | |
| clusterin | KIM-1 | microalbumin | |
| clusterin | KIM-1 | NGAL | |
| clusterin | KIM-1 | osteopontin | |
| clusterin | KIM-1 | THP | |
| clusterin | KIM-1 | TIMP-1 | |
| clusterin | KIM-1 | TFF-3 | |
| clusterin | KIM-1 | VEGF | |
| clusterin | microalbumin | NGAL | |
| clusterin | microalbumin | osteopontin | |
| clusterin | microalbumin | THP | |
| clusterin | microalbumin | TIMP-1 | |
| clusterin | microalbumin | TFF-3 | |
| clusterin | microalbumin | VEGF | |
| clusterin | NGAL | osteopontin | |
| clusterin | NGAL | THP | |
| clusterin | NGAL | TIMP-1 | |
| clusterin | NGAL | TFF-3 | |
| clusterin | NGAL | VEGF | |
| clusterin | osteopontin | THP | |
| clusterin | osteopontin | TIMP-1 | |
| clusterin | osteopontin | TFF-3 | |
| clusterin | osteopontin | VEGF | |
| clusterin | THP | TIMP-1 | |
| clusterin | THP | TFF-3 | |
| clusterin | THP | VEGF | |
| clusterin | TIMP-1 | TFF-3 | |
| clusterin | TIMP-1 | VEGF | |
| clusterin | TFF-3 | VEGF | |
| CTGF | creatinine | cystatin C | |
| CTGF | creatinine | GST-alpha | |
| CTGF | creatinine | KIM-1 | |
| CTGF | creatinine | microalbumin | |
| CTGF | creatinine | NGAL | |
| CTGF | creatinine | osteopontin | |
| CTGF | creatinine | THP | |
| CTGF | creatinine | TIMP-1 | |
| CTGF | creatinine | TFF-3 | |
| CTGF | creatinine | VEGF | |
| CTGF | cystatin C | GST-alpha | |
| CTGF | cystatin C | KIM-1 | |
| CTGF | cystatin C | microalbumin | |
| CTGF | cystatin C | NGAL | |
| CTGF | cystatin C | osteopontin | |
| CTGF | cystatin C | THP | |
| CTGF | cystatin C | TIMP-1 | |
| CTGF | cystatin C | TFF-3 | |
| CTGF | cystatin C | VEGF | |
| CTGF | GST-alpha | KIM-1 | |
| CTGF | GST-alpha | microalbumin | |
| CTGF | GST-alpha | NGAL | |
| CTGF | GST-alpha | osteopontin | |
| CTGF | GST-alpha | THP | |
| CTGF | GST-alpha | TIMP-1 | |
| CTGF | GST-alpha | TFF-3 | |
| CTGF | GST-alpha | VEGF | |
| CTGF | KIM-1 | microalbumin | |
| CTGF | KIM-1 | NGAL | |
| CTGF | KIM-1 | osteopontin | |
| CTGF | KIM-1 | THP | |
| CTGF | KIM-1 | TIMP-1 | |
| CTGF | KIM-1 | TFF-3 | |
| CTGF | KIM-1 | VEGF | |
| CTGF | microalbumin | NGAL | |
| CTGF | microalbumin | osteopontin | |
| CTGF | microalbumin | THP | |
| CTGF | microalbumin | TIMP-1 | |
| CTGF | microalbumin | TFF-3 | |
| CTGF | microalbumin | VEGF | |
| CTGF | NGAL | osteopontin | |
| CTGF | NGAL | THP | |
| CTGF | NGAL | TIMP-1 | |
| CTGF | NGAL | TFF-3 | |
| CTGF | NGAL | VEGF | |
| CTGF | osteopontin | THP | |
| CTGF | osteopontin | TIMP-1 | |
| CTGF | osteopontin | TFF-3 | |
| CTGF | osteopontin | VEGF | |
| CTGF | THP | TIMP-1 | |
| CTGF | THP | TFF-3 | |
| CTGF | THP | VEGF | |
| CTGF | TIMP-1 | TFF-3 | |
| CTGF | TIMP-1 | VEGF | |
| CTGF | TFF-3 | VEGF | |
| creatinine | cystatin C | GST-alpha | |
| creatinine | cystatin C | KIM-1 | |
| creatinine | cystatin C | microalbumin | |
| creatinine | cystatin C | NGAL | |
| creatinine | cystatin C | osteopontin | |
| creatinine | cystatin C | THP | |
| creatinine | cystatin C | TIMP-1 | |
| creatinine | cystatin C | TFF-3 | |
| creatinine | cystatin C | VEGF | |
| creatinine | GST-alpha | KIM-1 | |
| creatinine | GST-alpha | microalbumin | |
| creatinine | GST-alpha | NGAL | |
| creatinine | GST-alpha | osteopontin | |
| creatinine | GST-alpha | THP | |
| creatinine | GST-alpha | TIMP-1 | |
| creatinine | GST-alpha | TFF-3 | |
| creatinine | GST-alpha | VEGF | |
| creatinine | KIM-1 | microalbumin | |
| creatinine | KIM-1 | NGAL | |
| creatinine | KIM-1 | osteopontin | |
| creatinine | KIM-1 | THP | |
| creatinine | KIM-1 | TIMP-1 | |
| creatinine | KIM-1 | TFF-3 | |
| creatinine | KIM-1 | VEGF | |
| creatinine | microalbumin | NGAL | |
| creatinine | microalbumin | osteopontin | |
| creatinine | microalbumin | THP | |
| creatinine | microalbumin | TIMP-1 | |
| creatinine | microalbumin | TFF-3 | |
| creatinine | microalbumin | VEGF | |
| creatinine | NGAL | osteopontin | |
| creatinine | NGAL | THP | |
| creatinine | NGAL | TIMP-1 | |
| creatinine | NGAL | TFF-3 | |
| creatinine | NGAL | VEGF | |
| creatinine | osteopontin | THP | |
| creatinine | osteopontin | TIMP-1 | |
| creatinine | osteopontin | TFF-3 | |
| creatinine | osteopontin | VEGF | |
| creatinine | THP | TIMP-1 | |
| creatinine | THP | TFF-3 | |
| creatinine | THP | VEGF | |
| creatinine | TIMP-1 | TFF-3 | |
| creatinine | TIMP-1 | VEGF | |
| creatinine | TFF-3 | VEGF | |
| cystatin C | GST-alpha | KIM-1 | |
| cystatin C | GST-alpha | microalbumin | |
| cystatin C | GST-alpha | NGAL | |
| cystatin C | GST-alpha | osteopontin | |
| cystatin C | GST-alpha | THP | |
| cystatin C | GST-alpha | TIMP-1 | |
| cystatin C | GST-alpha | TFF-3 | |
| cystatin C | GST-alpha | VEGF | |
| cystatin C | KIM-1 | microalbumin | |
| cystatin C | KIM-1 | NGAL | |
| cystatin C | KIM-1 | osteopontin | |
| cystatin C | KIM-1 | THP | |
| cystatin C | KIM-1 | TIMP-1 | |
| cystatin C | KIM-1 | TFF-3 | |
| cystatin C | KIM-1 | VEGF | |
| cystatin C | microalbumin | NGAL | |
| cystatin C | microalbumin | osteopontin | |
| cystatin C | microalbumin | THP | |
| cystatin C | microalbumin | TIMP-1 | |
| cystatin C | microalbumin | TFF-3 | |
| cystatin C | microalbumin | VEGF | |
| cystatin C | NGAL | osteopontin | |
| cystatin C | NGAL | THP | |
| cystatin C | NGAL | TIMP-1 | |
| cystatin C | NGAL | TFF-3 | |
| cystatin C | NGAL | VEGF | |
| cystatin C | osteopontin | THP | |
| cystatin C | osteopontin | TIMP-1 | |
| cystatin C | osteopontin | TFF-3 | |
| cystatin C | osteopontin | VEGF | |
| cystatin C | THP | TIMP-1 | |
| cystatin C | THP | TFF-3 | |
| cystatin C | THP | VEGF | |
| cystatin C | TIMP-1 | TFF-3 | |
| cystatin C | TIMP-1 | VEGF | |
| cystatin C | TFF-3 | VEGF | |
| GST-alpha | KIM-1 | microalbumin | |
| GST-alpha | KIM-1 | NGAL | |
| GST-alpha | KIM-1 | osteopontin | |
| GST-alpha | KIM-1 | THP | |
| GST-alpha | KIM-1 | TIMP-1 | |
| GST-alpha | KIM-1 | TFF-3 | |
| GST-alpha | KIM-1 | VEGF | |
| GST-alpha | microalbumin | NGAL | |
| GST-alpha | microalbumin | osteopontin | |
| GST-alpha | microalbumin | THP | |
| GST-alpha | microalbumin | TIMP-1 | |
| GST-alpha | microalbumin | TFF-3 | |
| GST-alpha | microalbumin | VEGF | |
| GST-alpha | NGAL | osteopontin | |
| GST-alpha | NGAL | THP | |
| GST-alpha | NGAL | TIMP-1 | |
| GST-alpha | NGAL | TFF-3 | |
| GST-alpha | NGAL | VEGF | |
| GST-alpha | osteopontin | THP | |
| GST-alpha | osteopontin | TIMP-1 | |
| GST-alpha | osteopontin | TFF-3 | |
| GST-alpha | osteopontin | VEGF | |
| GST-alpha | THP | TIMP-1 | |
| GST-alpha | THP | TFF-3 | |
| GST-alpha | THP | VEGF | |
| GST-alpha | TIMP-1 | TFF-3 | |
| GST-alpha | TIMP-1 | VEGF | |
| GST-alpha | TFF-3 | VEGF | |
| KIM-1 | microalbumin | NGAL | |
| KIM-1 | microalbumin | osteopontin | |
| KIM-1 | microalbumin | THP | |
| KIM-1 | microalbumin | TIMP-1 | |
| KIM-1 | microalbumin | TFF-3 | |
| KIM-1 | microalbumin | VEGF | |
| KIM-1 | NGAL | osteopontin | |
| KIM-1 | NGAL | THP | |
| KIM-1 | NGAL | TIMP-1 | |
| KIM-1 | NGAL | TFF-3 | |
| KIM-1 | NGAL | VEGF | |
| KIM-1 | osteopontin | THP | |
| KIM-1 | osteopontin | TIMP-1 | |
| KIM-1 | osteopontin | TFF-3 | |
| KIM-1 | osteopontin | VEGF | |
| KIM-1 | THP | TIMP-1 | |
| KIM-1 | THP | TFF-3 | |
| KIM-1 | THP | VEGF | |
| KIM-1 | TIMP-1 | TFF-3 | |
| KIM-1 | TIMP-1 | VEGF | |
| KIM-1 | TFF-3 | VEGF | |
| microalbumin | NGAL | osteopontin | |
| microalbumin | NGAL | THP | |
| microalbumin | NGAL | TIMP-1 | |
| microalbumin | NGAL | TFF-3 | |
| microalbumin | NGAL | VEGF | |
| microalbumin | osteopontin | THP | |
| microalbumin | osteopontin | TIMP-1 | |
| microalbumin | osteopontin | TFF-3 | |
| microalbumin | osteopontin | VEGF | |
| microalbumin | THP | TIMP-1 | |
| microalbumin | THP | TFF-3 | |
| microalbumin | THP | VEGF | |
| microalbumin | TIMP-1 | TFF-3 | |
| microalbumin | TIMP-1 | VEGF | |
| microalbumin | TFF-3 | VEGF | |
| NGAL | osteopontin | THP | |
| NGAL | osteopontin | TIMP-1 | |
| NGAL | osteopontin | TFF-3 | |
| NGAL | osteopontin | VEGF | |
| NGAL | THP | TIMP-1 | |
| NGAL | THP | TFF-3 | |
| NGAL | THP | VEGF | |
| NGAL | TIMP-1 | TFF-3 | |
| NGAL | TIMP-1 | VEGF | |
| NGAL | TFF-3 | VEGF | |
| osteopontin | THP | TIMP-1 | |
| osteopontin | THP | TFF-3 | |
| osteopontin | THP | VEGF | |
| osteopontin | TIMP-1 | TFF-3 | |
| osteopontin | TIMP-1 | VEGF | |
| osteopontin | TFF-3 | VEGF | |
| THP | TIMP-1 | TFF-3 | |
| THP | TIMP-1 | VEGF | |
| THP | TFF-3 | VEGF | |
| TIMP-1 | TFF-3 | VEGF | |
In one exemplary embodiment, the combination of sample analytes may include creatinine, KIM-1, and THP. In another exemplary embodiment, the combination of sample analytes may include microalbumin, creatinine, and KIM-1. In yet another exemplary embodiment, the combination of sample analytes may include creatinine, THP, and A1M. In still another exemplary embodiment, the combination of sample analytes may include microalbumin, TIMP-1, and osteopontin.
In still another embodiment, the devices and systems of the current invention may be used to diagnose, monitor or determine the presence of obstructive uropathy. The combination of sample analytes may include any three of the biomarker analytes previously discussed. In an additional embodiment, the devices and systems to diagnose, monitor or determine the presence of obstructive uropathy include three or more biomarker analytes, including creatinine, THP, A1M, clusterin, NGAL, and osteopontin. In a further embodiment, the devices and systems to diagnose, monitor or determine the presence of obstructive uropathy includes six biomarker analytes, including creatinine, THP, A1M, clusterin, NGAL, and osteopontin.
In yet another embodiment, the devices and systems of the current invention may be used to diagnose, monitor or determine the presence of glomerulonephritis. The combination of sample analytes may include any three of the biomarker analytes previously discussed. In an additional embodiment, the devices and systems to diagnose, monitor or determine the presence of glomerulonephritis include three or more biomarker analytes, including creatinine, KIM-1, TIMP-1, alpha-1 microglobulin, THP, and osteopontin. In a further embodiment, the devices and systems to diagnose, monitor or determine the presence of glomerulonephropathy includes six biomarker analytes, including creatinine, KIM-1, TIMP-1, alpha-1 microglobulin, THP, and osteopontin.
In an additional embodiment, the devices and systems of the current invention may be used to diagnose, monitor or determine the presence of kidney damage or toxicity. The combination of sample analytes may include any three of the biomarker analytes previously discussed. In anotherembodiment, the devices and systems to diagnose, monitor or determine the presence of kidney damage or toxicity include three or more biomarker analytes, including creatinine, KIM-1, THP, osteopontin, NGAL, and TIMP-1. In a further embodiment, the devices and systems to diagnose, monitor or determine the presence of kidney damage or toxicity include six biomarker analytes, including creatinine, KIM-1, THP, osteopontin, NGAL, and TIMP-1.
In a further embodiment, the devices and systems of the current invention may be used to diagnose, monitor or determine the presence of diabetic nephropathy. The combination of sample analytes may include any three of the biomarker analytes previously discussed. In another embodiment, the devices and systems to diagnose, monitor or determine the presence of diabetic nephropathy include three or more biomarker analytes, including microalbumin, alpha-1 microglobulin, NGAL, KIM-1, THP, and clusterin. In a further embodiment, the devices and systems to diagnose, monitor or determine the presence of diabetic nephropathy include six biomarker analytes, including microalbumin, alpha-1 microglobulin, NGAL, KIM-1, THP, and clusterin.
In another embodiment, the devices and systems of the current invention detect the combination of sample analytes, and may include any three of the biomarker analytes discussed previously to diagnose kidney transplant rejection or other associated disease as discussed previously. In other embodiments, the combination of sample analytes may be any four, any five, any six, any seven, any eight, any nine, any ten, any eleven, any twelve, any thirteen, any fourteen, any fifteen, any sixteen, any seventeen, any eighteen, or any nineteen biomarker analytes. In another embodiment, the combination of sample analytes may comprise a combination listed in Table B.
| TABLE B | |||
| BLC | CD40 | IGF BP2 | |
| BLC | CD40 | MMP3 | |
| BLC | CD40 | peptide YY | |
| BLC | CD40 | stem cell factor | |
| BLC | CD40 | TNF RII | |
| BLC | CD40 | AXL | |
| BLC | CD40 | Eotaxin 3 | |
| BLC | CD40 | FABP | |
| BLC | CD40 | FGF basic | |
| BLC | CD40 | myoglobin | |
| BLC | CD40 | resistin | |
| BLC | CD40 | TRAIL R3 | |
| BLC | CD40 | endothilin 1 | |
| BLC | CD40 | NrCAM | |
| BLC | CD40 | Tenascin C | |
| BLC | CD40 | VCAM1 | |
| BLC | CD40 | cortisol | |
| BLC | IGF BP2 | MMP3 | |
| BLC | IGF BP2 | peptide YY | |
| BLC | IGF BP2 | stem cell factor | |
| BLC | IGF BP2 | TNF RII | |
| BLC | IGF BP2 | AXL | |
| BLC | IGF BP2 | Eotaxin 3 | |
| BLC | IGF BP2 | FABP | |
| BLC | IGF BP2 | FGF basic | |
| BLC | IGF BP2 | myoglobin | |
| BLC | IGF BP2 | resistin | |
| BLC | IGF BP2 | TRAIL R3 | |
| BLC | IGF BP2 | endothilin 1 | |
| BLC | IGF BP2 | NrCAM | |
| BLC | IGF BP2 | Tenascin C | |
| BLC | IGF BP2 | VCAM1 | |
| BLC | IGF BP2 | cortisol | |
| BLC | MMP3 | peptide YY | |
| BLC | MMP3 | stem cell factor | |
| BLC | MMP3 | TNF RII | |
| BLC | MMP3 | AXL | |
| BLC | MMP3 | Eotaxin 3 | |
| BLC | MMP3 | FABP | |
| BLC | MMP3 | FGF basic | |
| BLC | MMP3 | myoglobin | |
| BLC | MMP3 | resistin | |
| BLC | MMP3 | TRAIL R3 | |
| BLC | MMP3 | endothilin 1 | |
| BLC | MMP3 | NrCAM | |
| BLC | MMP3 | Tenascin C | |
| BLC | MMP3 | VCAM1 | |
| BLC | MMP3 | cortisol | |
| BLC | peptide YY | stem cell factor | |
| BLC | peptide YY | TNF RII | |
| BLC | peptide YY | AXL | |
| BLC | peptide YY | Eotaxin 3 | |
| BLC | peptide YY | FABP | |
| BLC | peptide YY | FGF basic | |
| BLC | peptide YY | myoglobin | |
| BLC | peptide YY | resistin | |
| BLC | peptide YY | TRAIL R3 | |
| BLC | peptide YY | endothilin 1 | |
| BLC | peptide YY | NrCAM | |
| BLC | peptide YY | Tenascin C | |
| BLC | peptide YY | VCAM1 | |
| BLC | peptide YY | cortisol | |
| BLC | stem cell factor | TNF RII | |
| BLC | stem cell factor | AXL | |
| BLC | stem cell factor | Eotaxin 3 | |
| BLC | stem cell factor | FABP | |
| BLC | stem cell factor | FGF basic | |
| BLC | stem cell factor | myoglobin | |
| BLC | stem cell factor | resistin | |
| BLC | stem cell factor | TRAIL R3 | |
| BLC | stem cell factor | endothilin 1 | |
| BLC | stem cell factor | NrCAM | |
| BLC | stem cell factor | Tenascin C | |
| BLC | stem cell factor | VCAM1 | |
| BLC | stem cell factor | cortisol | |
| BLC | TNF RII | AXL | |
| BLC | TNF RII | Eotaxin 3 | |
| BLC | TNF RII | FABP | |
| BLC | TNF RII | FGF basic | |
| BLC | TNF RII | myoglobin | |
| BLC | TNF RII | resistin | |
| BLC | TNF RII | TRAIL R3 | |
| BLC | TNF RII | endothilin 1 | |
| BLC | TNF RII | NrCAM | |
| BLC | TNF RII | Tenascin C | |
| BLC | TNF RII | VCAM1 | |
| BLC | TNF RII | cortisol | |
| BLC | AXL | Eotaxin 3 | |
| BLC | AXL | FABP | |
| BLC | AXL | FGF basic | |
| BLC | AXL | myoglobin | |
| BLC | AXL | resistin | |
| BLC | AXL | TRAIL R3 | |
| BLC | AXL | endothilin 1 | |
| BLC | AXL | NrCAM | |
| BLC | AXL | Tenascin C | |
| BLC | AXL | VCAM1 | |
| BLC | AXL | cortisol | |
| BLC | Eotaxin 3 | FABP | |
| BLC | Eotaxin 3 | FGF basic | |
| BLC | Eotaxin 3 | myoglobin | |
| BLC | Eotaxin 3 | resistin | |
| BLC | Eotaxin 3 | TRAIL R3 | |
| BLC | Eotaxin 3 | endothilin 1 | |
| BLC | Eotaxin 3 | NrCAM | |
| BLC | Eotaxin 3 | Tenascin C | |
| BLC | Eotaxin 3 | VCAM1 | |
| BLC | Eotaxin 3 | cortisol | |
| BLC | FABP | FGF basic | |
| BLC | FABP | myoglobin | |
| BLC | FABP | resistin | |
| BLC | FABP | TRAIL R3 | |
| BLC | FABP | endothilin 1 | |
| BLC | FABP | NrCAM | |
| BLC | FABP | Tenascin C | |
| BLC | FABP | VCAM1 | |
| BLC | FABP | cortisol | |
| BLC | FGF basic | myoglobin | |
| BLC | FGF basic | resistin | |
| BLC | FGF basic | TRAIL R3 | |
| BLC | FGF basic | endothilin 1 | |
| BLC | FGF basic | NrCAM | |
| BLC | FGF basic | Tenascin C | |
| BLC | FGF basic | VCAM1 | |
| BLC | FGF basic | cortisol | |
| BLC | myoglobin | resistin | |
| BLC | myoglobin | TRAIL R3 | |
| BLC | myoglobin | endothilin 1 | |
| BLC | myoglobin | NrCAM | |
| BLC | myoglobin | Tenascin C | |
| BLC | myoglobin | VCAM1 | |
| BLC | myoglobin | cortisol | |
| BLC | resistin | TRAIL R3 | |
| BLC | resistin | endothilin 1 | |
| BLC | resistin | NrCAM | |
| BLC | resistin | Tenascin C | |
| BLC | resistin | VCAM1 | |
| BLC | resistin | cortisol | |
| BLC | TRAIL R3 | endothilin 1 | |
| BLC | TRAIL R3 | NrCAM | |
| BLC | TRAIL R3 | Tenascin C | |
| BLC | TRAIL R3 | VCAM1 | |
| BLC | TRAIL R3 | cortisol | |
| BLC | endothilin 1 | NrCAM | |
| BLC | endothilin 1 | Tenascin C | |
| BLC | endothilin 1 | VCAM1 | |
| BLC | endothilin 1 | cortisol | |
| BLC | NrCAM | Tenascin C | |
| BLC | NrCAM | VCAM1 | |
| BLC | NrCAM | cortisol | |
| BLC | Tenascin C | VCAM1 | |
| BLC | Tenascin C | cortisol | |
| BLC | VCAM1 | cortisol | |
| CD40 | IGF BP2 | MMP3 | |
| CD40 | IGF BP2 | peptide YY | |
| CD40 | IGF BP2 | stem cell factor | |
| CD40 | IGF BP2 | TNF RII | |
| CD40 | IGF BP2 | AXL | |
| CD40 | IGF BP2 | Eotaxin 3 | |
| CD40 | IGF BP2 | FABP | |
| CD40 | IGF BP2 | FGF basic | |
| CD40 | IGF BP2 | myoglobin | |
| CD40 | IGF BP2 | resistin | |
| CD40 | IGF BP2 | TRAIL R3 | |
| CD40 | IGF BP2 | endothilin 1 | |
| CD40 | IGF BP2 | NrCAM | |
| CD40 | IGF BP2 | Tenascin C | |
| CD40 | IGF BP2 | VCAM1 | |
| CD40 | IGF BP2 | cortisol | |
| CD40 | MMP3 | peptide YY | |
| CD40 | MMP3 | stem cell factor | |
| CD40 | MMP3 | TNF RII | |
| CD40 | MMP3 | AXL | |
| CD40 | MMP3 | Eotaxin 3 | |
| CD40 | MMP3 | FABP | |
| CD40 | MMP3 | FGF basic | |
| CD40 | MMP3 | myoglobin | |
| CD40 | MMP3 | resistin | |
| CD40 | MMP3 | TRAIL R3 | |
| CD40 | MMP3 | endothilin 1 | |
| CD40 | MMP3 | NrCAM | |
| CD40 | MMP3 | Tenascin C | |
| CD40 | MMP3 | VCAM1 | |
| CD40 | MMP3 | cortisol | |
| CD40 | peptide YY | stem cell factor | |
| CD40 | peptide YY | TNF RII | |
| CD40 | peptide YY | AXL | |
| CD40 | peptide YY | Eotaxin 3 | |
| CD40 | peptide YY | FABP | |
| CD40 | peptide YY | FGF basic | |
| CD40 | peptide YY | myoglobin | |
| CD40 | peptide YY | resistin | |
| CD40 | peptide YY | TRAIL R3 | |
| CD40 | peptide YY | endothilin 1 | |
| CD40 | peptide YY | NrCAM | |
| CD40 | peptide YY | Tenascin C | |
| CD40 | peptide YY | VCAM1 | |
| CD40 | peptide YY | cortisol | |
| CD40 | stem cell factor | TNF RII | |
| CD40 | stem cell factor | AXL | |
| CD40 | stem cell factor | Eotaxin 3 | |
| CD40 | stem cell factor | FABP | |
| CD40 | stem cell factor | FGF basic | |
| CD40 | stem cell factor | myoglobin | |
| CD40 | stem cell factor | resistin | |
| CD40 | stem cell factor | TRAIL R3 | |
| CD40 | stem cell factor | endothilin 1 | |
| CD40 | stem cell factor | NrCAM | |
| CD40 | stem cell factor | Tenascin C | |
| CD40 | stem cell factor | VCAM1 | |
| CD40 | stem cell factor | cortisol | |
| CD40 | TNF RII | AXL | |
| CD40 | TNF RII | Eotaxin 3 | |
| CD40 | TNF RII | FABP | |
| CD40 | TNF RII | FGF basic | |
| CD40 | TNF RII | myoglobin | |
| CD40 | TNF RII | resistin | |
| CD40 | TNF RII | TRAIL R3 | |
| CD40 | TNF RII | endothilin 1 | |
| CD40 | TNF RII | NrCAM | |
| CD40 | TNF RII | Tenascin C | |
| CD40 | TNF RII | VCAM1 | |
| CD40 | TNF RII | cortisol | |
| CD40 | AXL | Eotaxin 3 | |
| CD40 | AXL | FABP | |
| CD40 | AXL | FGF basic | |
| CD40 | AXL | myoglobin | |
| CD40 | AXL | resistin | |
| CD40 | AXL | TRAIL R3 | |
| CD40 | AXL | endothilin 1 | |
| CD40 | AXL | NrCAM | |
| CD40 | AXL | Tenascin C | |
| CD40 | AXL | VCAM1 | |
| CD40 | AXL | cortisol | |
| CD40 | Eotaxin 3 | FABP | |
| CD40 | Eotaxin 3 | FGF basic | |
| CD40 | Eotaxin 3 | myoglobin | |
| CD40 | Eotaxin 3 | resistin | |
| CD40 | Eotaxin 3 | TRAIL R3 | |
| CD40 | Eotaxin 3 | endothilin 1 | |
| CD40 | Eotaxin 3 | NrCAM | |
| CD40 | Eotaxin 3 | Tenascin C | |
| CD40 | Eotaxin 3 | VCAM1 | |
| CD40 | Eotaxin 3 | cortisol | |
| CD40 | FABP | FGF basic | |
| CD40 | FABP | myoglobin | |
| CD40 | FABP | resistin | |
| CD40 | FABP | TRAIL R3 | |
| CD40 | FABP | endothilin 1 | |
| CD40 | FABP | NrCAM | |
| CD40 | FABP | Tenascin C | |
| CD40 | FABP | VCAM1 | |
| CD40 | FABP | cortisol | |
| CD40 | FGF basic | myoglobin | |
| CD40 | FGF basic | resistin | |
| CD40 | FGF basic | TRAIL R3 | |
| CD40 | FGF basic | endothilin 1 | |
| CD40 | FGF basic | NrCAM | |
| CD40 | FGF basic | Tenascin C | |
| CD40 | FGF basic | VCAM1 | |
| CD40 | FGF basic | cortisol | |
| CD40 | myoglobin | resistin | |
| CD40 | myoglobin | TRAIL R3 | |
| CD40 | myoglobin | endothilin 1 | |
| CD40 | myoglobin | NrCAM | |
| CD40 | myoglobin | Tenascin C | |
| CD40 | myoglobin | VCAM1 | |
| CD40 | myoglobin | cortisol | |
| CD40 | resistin | TRAIL R3 | |
| CD40 | resistin | endothilin 1 | |
| CD40 | resistin | NrCAM | |
| CD40 | resistin | Tenascin C | |
| CD40 | resistin | VCAM1 | |
| CD40 | resistin | cortisol | |
| CD40 | TRAIL R3 | endothilin 1 | |
| CD40 | TRAIL R3 | NrCAM | |
| CD40 | TRAIL R3 | Tenascin C | |
| CD40 | TRAIL R3 | VCAM1 | |
| CD40 | TRAIL R3 | cortisol | |
| CD40 | endothilin 1 | NrCAM | |
| CD40 | endothilin 1 | Tenascin C | |
| CD40 | endothilin 1 | VCAM1 | |
| CD40 | endothilin 1 | cortisol | |
| CD40 | NrCAM | Tenascin C | |
| CD40 | NrCAM | VCAM1 | |
| CD40 | NrCAM | cortisol | |
| CD40 | Tenascin C | VCAM1 | |
| CD40 | Tenascin C | cortisol | |
| CD40 | VCAM1 | cortisol | |
| IGF BP2 | MMP3 | peptide YY | |
| IGF BP2 | MMP3 | stem cell factor | |
| IGF BP2 | MMP3 | TNF RII | |
| IGF BP2 | MMP3 | AXL | |
| IGF BP2 | MMP3 | Eotaxin 3 | |
| IGF BP2 | MMP3 | FABP | |
| IGF BP2 | MMP3 | FGF basic | |
| IGF BP2 | MMP3 | myoglobin | |
| IGF BP2 | MMP3 | resistin | |
| IGF BP2 | MMP3 | TRAIL R3 | |
| IGF BP2 | MMP3 | endothilin 1 | |
| IGF BP2 | MMP3 | NrCAM | |
| IGF BP2 | MMP3 | Tenascin C | |
| IGF BP2 | MMP3 | VCAM1 | |
| IGF BP2 | MMP3 | cortisol | |
| IGF BP2 | peptide YY | stem cell factor | |
| IGF BP2 | peptide YY | TNF RII | |
| IGF BP2 | peptide YY | AXL | |
| IGF BP2 | peptide YY | Eotaxin 3 | |
| IGF BP2 | peptide YY | FABP | |
| IGF BP2 | peptide YY | FGF basic | |
| IGF BP2 | peptide YY | myoglobin | |
| IGF BP2 | peptide YY | resistin | |
| IGF BP2 | peptide YY | TRAIL R3 | |
| IGF BP2 | peptide YY | endothilin 1 | |
| IGF BP2 | peptide YY | NrCAM | |
| IGF BP2 | peptide YY | Tenascin C | |
| IGF BP2 | peptide YY | VCAM1 | |
| IGF BP2 | peptide YY | cortisol | |
| IGF BP2 | stem cell factor | TNF RII | |
| IGF BP2 | stem cell factor | AXL | |
| IGF BP2 | stem cell factor | Eotaxin 3 | |
| IGF BP2 | stem cell factor | FABP | |
| IGF BP2 | stem cell factor | FGF basic | |
| IGF BP2 | stem cell factor | myoglobin | |
| IGF BP2 | stem cell factor | resistin | |
| IGF BP2 | stem cell factor | TRAIL R3 | |
| IGF BP2 | stem cell factor | endothilin 1 | |
| IGF BP2 | stem cell factor | NrCAM | |
| IGF BP2 | stem cell factor | Tenascin C | |
| IGF BP2 | stem cell factor | VCAM1 | |
| IGF BP2 | stem cell factor | cortisol | |
| IGF BP2 | TNF RII | AXL | |
| IGF BP2 | TNF RII | Eotaxin 3 | |
| IGF BP2 | TNF RII | FABP | |
| IGF BP2 | TNF RII | FGF basic | |
| IGF BP2 | TNF RII | myoglobin | |
| IGF BP2 | TNF RII | resistin | |
| IGF BP2 | TNF RII | TRAIL R3 | |
| IGF BP2 | TNF RII | endothilin 1 | |
| IGF BP2 | TNF RII | NrCAM | |
| IGF BP2 | TNF RII | Tenascin C | |
| IGF BP2 | TNF RII | VCAM1 | |
| IGF BP2 | TNF RII | cortisol | |
| IGF BP2 | AXL | Eotaxin 3 | |
| IGF BP2 | AXL | FABP | |
| IGF BP2 | AXL | FGF basic | |
| IGF BP2 | AXL | myoglobin | |
| IGF BP2 | AXL | resistin | |
| IGF BP2 | AXL | TRAIL R3 | |
| IGF BP2 | AXL | endothilin 1 | |
| IGF BP2 | AXL | NrCAM | |
| IGF BP2 | AXL | Tenascin C | |
| IGF BP2 | AXL | VCAM1 | |
| IGF BP2 | AXL | cortisol | |
| IGF BP2 | Eotaxin 3 | FABP | |
| IGF BP2 | Eotaxin 3 | FGF basic | |
| IGF BP2 | Eotaxin 3 | myoglobin | |
| IGF BP2 | Eotaxin 3 | resistin | |
| IGF BP2 | Eotaxin 3 | TRAIL R3 | |
| IGF BP2 | Eotaxin 3 | endothilin 1 | |
| IGF BP2 | Eotaxin 3 | NrCAM | |
| IGF BP2 | Eotaxin 3 | Tenascin C | |
| IGF BP2 | Eotaxin 3 | VCAM1 | |
| IGF BP2 | Eotaxin 3 | cortisol | |
| IGF BP2 | FABP | FGF basic | |
| IGF BP2 | FABP | myoglobin | |
| IGF BP2 | FABP | resistin | |
| IGF BP2 | FABP | TRAIL R3 | |
| IGF BP2 | FABP | endothilin 1 | |
| IGF BP2 | FABP | NrCAM | |
| IGF BP2 | FABP | Tenascin C | |
| IGF BP2 | FABP | VCAM1 | |
| IGF BP2 | FABP | cortisol | |
| IGF BP2 | FGF basic | myoglobin | |
| IGF BP2 | FGF basic | resistin | |
| IGF BP2 | FGF basic | TRAIL R3 | |
| IGF BP2 | FGF basic | endothilin 1 | |
| IGF BP2 | FGF basic | NrCAM | |
| IGF BP2 | FGF basic | Tenascin C | |
| IGF BP2 | FGF basic | VCAM1 | |
| IGF BP2 | FGF basic | cortisol | |
| IGF BP2 | myoglobin | resistin | |
| IGF BP2 | myoglobin | TRAIL R3 | |
| IGF BP2 | myoglobin | endothilin 1 | |
| IGF BP2 | myoglobin | NrCAM | |
| IGF BP2 | myoglobin | Tenascin C | |
| IGF BP2 | myoglobin | VCAM1 | |
| IGF BP2 | myoglobin | cortisol | |
| IGF BP2 | resistin | TRAIL R3 | |
| IGF BP2 | resistin | endothilin 1 | |
| IGF BP2 | resistin | NrCAM | |
| IGF BP2 | resistin | Tenascin C | |
| IGF BP2 | resistin | VCAM1 | |
| IGF BP2 | resistin | cortisol | |
| IGF BP2 | TRAIL R3 | endothilin 1 | |
| IGF BP2 | TRAIL R3 | NrCAM | |
| IGF BP2 | TRAIL R3 | Tenascin C | |
| IGF BP2 | TRAIL R3 | VCAM1 | |
| IGF BP2 | TRAIL R3 | cortisol | |
| IGF BP2 | endothilin 1 | NrCAM | |
| IGF BP2 | endothilin 1 | Tenascin C | |
| IGF BP2 | endothilin 1 | VCAM1 | |
| IGF BP2 | endothilin 1 | cortisol | |
| IGF BP2 | NrCAM | Tenascin C | |
| IGF BP2 | NrCAM | VCAM1 | |
| IGF BP2 | NrCAM | cortisol | |
| IGF BP2 | Tenascin C | VCAM1 | |
| IGF BP2 | Tenascin C | cortisol | |
| IGF BP2 | VCAM1 | cortisol | |
| MMP3 | peptide YY | stem cell factor | |
| MMP3 | peptide YY | TNF RII | |
| MMP3 | peptide YY | AXL | |
| MMP3 | peptide YY | Eotaxin 3 | |
| MMP3 | peptide YY | FABP | |
| MMP3 | peptide YY | FGF basic | |
| MMP3 | peptide YY | myoglobin | |
| MMP3 | peptide YY | resistin | |
| MMP3 | peptide YY | TRAIL R3 | |
| MMP3 | peptide YY | endothilin 1 | |
| MMP3 | peptide YY | NrCAM | |
| MMP3 | peptide YY | Tenascin C | |
| MMP3 | peptide YY | VCAM1 | |
| MMP3 | peptide YY | cortisol | |
| MMP3 | stem cell factor | TNF RII | |
| MMP3 | stem cell factor | AXL | |
| MMP3 | stem cell factor | Eotaxin 3 | |
| MMP3 | stem cell factor | FABP | |
| MMP3 | stem cell factor | FGF basic | |
| MMP3 | stem cell factor | myoglobin | |
| MMP3 | stem cell factor | resistin | |
| MMP3 | stem cell factor | TRAIL R3 | |
| MMP3 | stem cell factor | endothilin 1 | |
| MMP3 | stem cell factor | NrCAM | |
| MMP3 | stem cell factor | Tenascin C | |
| MMP3 | stem cell factor | VCAM1 | |
| MMP3 | stem cell factor | cortisol | |
| MMP3 | TNF RII | AXL | |
| MMP3 | TNF RII | Eotaxin 3 | |
| MMP3 | TNF RII | FABP | |
| MMP3 | TNF RII | FGF basic | |
| MMP3 | TNF RII | myoglobin | |
| MMP3 | TNF RII | resistin | |
| MMP3 | TNF RII | TRAIL R3 | |
| MMP3 | TNF RII | endothilin 1 | |
| MMP3 | TNF RII | NrCAM | |
| MMP3 | TNF RII | Tenascin C | |
| MMP3 | TNF RII | VCAM1 | |
| MMP3 | TNF RII | cortisol | |
| MMP3 | AXL | Eotaxin 3 | |
| MMP3 | AXL | FABP | |
| MMP3 | AXL | FGF basic | |
| MMP3 | AXL | myoglobin | |
| MMP3 | AXL | resistin | |
| MMP3 | AXL | TRAIL R3 | |
| MMP3 | AXL | endothilin 1 | |
| MMP3 | AXL | NrCAM | |
| MMP3 | AXL | Tenascin C | |
| MMP3 | AXL | VCAM1 | |
| MMP3 | AXL | cortisol | |
| MMP3 | Eotaxin 3 | FABP | |
| MMP3 | Eotaxin 3 | FGF basic | |
| MMP3 | Eotaxin 3 | myoglobin | |
| MMP3 | Eotaxin 3 | resistin | |
| MMP3 | Eotaxin 3 | TRAIL R3 | |
| MMP3 | Eotaxin 3 | endothilin 1 | |
| MMP3 | Eotaxin 3 | NrCAM | |
| MMP3 | Eotaxin 3 | Tenascin C | |
| MMP3 | Eotaxin 3 | VCAM1 | |
| MMP3 | Eotaxin 3 | cortisol | |
| MMP3 | FABP | FGF basic | |
| MMP3 | FABP | myoglobin | |
| MMP3 | FABP | resistin | |
| MMP3 | FABP | TRAIL R3 | |
| MMP3 | FABP | endothilin 1 | |
| MMP3 | FABP | NrCAM | |
| MMP3 | FABP | Tenascin C | |
| MMP3 | FABP | VCAM1 | |
| MMP3 | FABP | cortisol | |
| MMP3 | FGF basic | myoglobin | |
| MMP3 | FGF basic | resistin | |
| MMP3 | FGF basic | TRAIL R3 | |
| MMP3 | FGF basic | endothilin 1 | |
| MMP3 | FGF basic | NrCAM | |
| MMP3 | FGF basic | Tenascin C | |
| MMP3 | FGF basic | VCAM1 | |
| MMP3 | FGF basic | cortisol | |
| MMP3 | myoglobin | resistin | |
| MMP3 | myoglobin | TRAIL R3 | |
| MMP3 | myoglobin | endothilin 1 | |
| MMP3 | myoglobin | NrCAM | |
| MMP3 | myoglobin | Tenascin C | |
| MMP3 | myoglobin | VCAM1 | |
| MMP3 | myoglobin | cortisol | |
| MMP3 | resistin | TRAIL R3 | |
| MMP3 | resistin | endothilin 1 | |
| MMP3 | resistin | NrCAM | |
| MMP3 | resistin | Tenascin C | |
| MMP3 | resistin | VCAM1 | |
| MMP3 | resistin | cortisol | |
| MMP3 | TRAIL R3 | endothilin 1 | |
| MMP3 | TRAIL R3 | NrCAM | |
| MMP3 | TRAIL R3 | Tenascin C | |
| MMP3 | TRAIL R3 | VCAM1 | |
| MMP3 | TRAIL R3 | cortisol | |
| MMP3 | endothilin 1 | NrCAM | |
| MMP3 | endothilin 1 | Tenascin C | |
| MMP3 | endothilin 1 | VCAM1 | |
| MMP3 | endothilin 1 | cortisol | |
| MMP3 | NrCAM | Tenascin C | |
| MMP3 | NrCAM | VCAM1 | |
| MMP3 | NrCAM | cortisol | |
| MMP3 | Tenascin C | VCAM1 | |
| MMP3 | Tenascin C | cortisol | |
| MMP3 | VCAM1 | cortisol | |
| peptide YY | stem cell factor | TNF RII | |
| peptide YY | stem cell factor | AXL | |
| peptide YY | stem cell factor | Eotaxin 3 | |
| peptide YY | stem cell factor | FABP | |
| peptide YY | stem cell factor | FGF basic | |
| peptide YY | stem cell factor | myoglobin | |
| peptide YY | stem cell factor | resistin | |
| peptide YY | stem cell factor | TRAIL R3 | |
| peptide YY | stem cell factor | endothilin 1 | |
| peptide YY | stem cell factor | NrCAM | |
| peptide YY | stem cell factor | Tenascin C | |
| peptide YY | stem cell factor | VCAM1 | |
| peptide YY | stem cell factor | cortisol | |
| peptide YY | TNF RII | AXL | |
| peptide YY | TNF RII | Eotaxin 3 | |
| peptide YY | TNF RII | FABP | |
| peptide YY | TNF RII | FGF basic | |
| peptide YY | TNF RII | myoglobin | |
| peptide YY | TNF RII | resistin | |
| peptide YY | TNF RII | TRAIL R3 | |
| peptide YY | TNF RII | endothilin 1 | |
| peptide YY | TNF RII | NrCAM | |
| peptide YY | TNF RII | Tenascin C | |
| peptide YY | TNF RII | VCAM1 | |
| peptide YY | TNF RII | cortisol | |
| peptide YY | AXL | Eotaxin 3 | |
| peptide YY | AXL | FABP | |
| peptide YY | AXL | FGF basic | |
| peptide YY | AXL | myoglobin | |
| peptide YY | AXL | resistin | |
| peptide YY | AXL | TRAIL R3 | |
| peptide YY | AXL | endothilin 1 | |
| peptide YY | AXL | NrCAM | |
| peptide YY | AXL | Tenascin C | |
| peptide YY | AXL | VCAM1 | |
| peptide YY | AXL | cortisol | |
| peptide YY | Eotaxin 3 | FABP | |
| peptide YY | Eotaxin 3 | FGF basic | |
| peptide YY | Eotaxin 3 | myoglobin | |
| peptide YY | Eotaxin 3 | resistin | |
| peptide YY | Eotaxin 3 | TRAIL R3 | |
| peptide YY | Eotaxin 3 | endothilin 1 | |
| peptide YY | Eotaxin 3 | NrCAM | |
| peptide YY | Eotaxin 3 | Tenascin C | |
| peptide YY | Eotaxin 3 | VCAM1 | |
| peptide YY | Eotaxin 3 | cortisol | |
| peptide YY | FABP | FGF basic | |
| peptide YY | FABP | myoglobin | |
| peptide YY | FABP | resistin | |
| peptide YY | FABP | TRAIL R3 | |
| peptide YY | FABP | endothilin 1 | |
| peptide YY | FABP | NrCAM | |
| peptide YY | FABP | Tenascin C | |
| peptide YY | FABP | VCAM1 | |
| peptide YY | FABP | cortisol | |
| peptide YY | FGF basic | myoglobin | |
| peptide YY | FGF basic | resistin | |
| peptide YY | FGF basic | TRAIL R3 | |
| peptide YY | FGF basic | endothilin 1 | |
| peptide YY | FGF basic | NrCAM | |
| peptide YY | FGF basic | Tenascin C | |
| peptide YY | FGF basic | VCAM1 | |
| peptide YY | FGF basic | cortisol | |
| peptide YY | myoglobin | resistin | |
| peptide YY | myoglobin | TRAIL R3 | |
| peptide YY | myoglobin | endothilin 1 | |
| peptide YY | myoglobin | NrCAM | |
| peptide YY | myoglobin | Tenascin C | |
| peptide YY | myoglobin | VCAM1 | |
| peptide YY | myoglobin | cortisol | |
| peptide YY | resistin | TRAIL R3 | |
| peptide YY | resistin | endothilin 1 | |
| peptide YY | resistin | NrCAM | |
| peptide YY | resistin | Tenascin C | |
| peptide YY | resistin | VCAM1 | |
| peptide YY | resistin | cortisol | |
| peptide YY | TRAIL R3 | endothilin 1 | |
| peptide YY | TRAIL R3 | NrCAM | |
| peptide YY | TRAIL R3 | Tenascin C | |
| peptide YY | TRAIL R3 | VCAM1 | |
| peptide YY | TRAIL R3 | cortisol | |
| peptide YY | endothilin 1 | NrCAM | |
| peptide YY | endothilin 1 | Tenascin C | |
| peptide YY | endothilin 1 | VCAM1 | |
| peptide YY | endothilin 1 | cortisol | |
| peptide YY | NrCAM | Tenascin C | |
| peptide YY | NrCAM | VCAM1 | |
| peptide YY | NrCAM | cortisol | |
| peptide YY | Tenascin C | VCAM1 | |
| peptide YY | Tenascin C | cortisol | |
| peptide YY | VCAM1 | cortisol | |
| stem cell factor | TNF RII | AXL | |
| stem cell factor | TNF RII | Eotaxin 3 | |
| stem cell factor | TNF RII | FABP | |
| stem cell factor | TNF RII | FGF basic | |
| stem cell factor | TNF RII | myoglobin | |
| stem cell factor | TNF RII | resistin | |
| stem cell factor | TNF RII | TRAIL R3 | |
| stem cell factor | TNF RII | endothilin 1 | |
| stem cell factor | TNF RII | NrCAM | |
| stem cell factor | TNF RII | Tenascin C | |
| stem cell factor | TNF RII | VCAM1 | |
| stem cell factor | TNF RII | cortisol | |
| stem cell factor | AXL | Eotaxin 3 | |
| stem cell factor | AXL | FABP | |
| stem cell factor | AXL | FGF basic | |
| stem cell factor | AXL | myoglobin | |
| stem cell factor | AXL | resistin | |
| stem cell factor | AXL | TRAIL R3 | |
| stem cell factor | AXL | endothilin 1 | |
| stem cell factor | AXL | NrCAM | |
| stem cell factor | AXL | Tenascin C | |
| stem cell factor | AXL | VCAM1 | |
| stem cell factor | AXL | cortisol | |
| stem cell factor | Eotaxin 3 | FABP | |
| stem cell factor | Eotaxin 3 | FGF basic | |
| stem cell factor | Eotaxin 3 | myoglobin | |
| stem cell factor | Eotaxin 3 | resistin | |
| stem cell factor | Eotaxin 3 | TRAIL R3 | |
| stem cell factor | Eotaxin 3 | endothilin 1 | |
| stem cell factor | Eotaxin 3 | NrCAM | |
| stem cell factor | Eotaxin 3 | Tenascin C | |
| stem cell factor | Eotaxin 3 | VCAM1 | |
| stem cell factor | Eotaxin 3 | cortisol | |
| stem cell factor | FABP | FGF basic | |
| stem cell factor | FABP | myoglobin | |
| stem cell factor | FABP | resistin | |
| stem cell factor | FABP | TRAIL R3 | |
| stem cell factor | FABP | endothilin 1 | |
| stem cell factor | FABP | NrCAM | |
| stem cell factor | FABP | Tenascin C | |
| stem cell factor | FABP | VCAM1 | |
| stem cell factor | FABP | cortisol | |
| stem cell factor | FGF basic | myoglobin | |
| stem cell factor | FGF basic | resistin | |
| stem cell factor | FGF basic | TRAIL R3 | |
| stem cell factor | FGF basic | endothilin 1 | |
| stem cell factor | FGF basic | NrCAM | |
| stem cell factor | FGF basic | Tenascin C | |
| stem cell factor | FGF basic | VCAM1 | |
| stem cell factor | FGF basic | cortisol | |
| stem cell factor | myoglobin | resistin | |
| stem cell factor | myoglobin | TRAIL R3 | |
| stem cell factor | myoglobin | endothilin 1 | |
| stem cell factor | myoglobin | NrCAM | |
| stem cell factor | myoglobin | Tenascin C | |
| stem cell factor | myoglobin | VCAM1 | |
| stem cell factor | myoglobin | cortisol | |
| stem cell factor | resistin | TRAIL R3 | |
| stem cell factor | resistin | endothilin 1 | |
| stem cell factor | resistin | NrCAM | |
| stem cell factor | resistin | Tenascin C | |
| stem cell factor | resistin | VCAM1 | |
| stem cell factor | resistin | cortisol | |
| stem cell factor | TRAIL R3 | endothilin 1 | |
| stem cell factor | TRAIL R3 | NrCAM | |
| stem cell factor | TRAIL R3 | Tenascin C | |
| stem cell factor | TRAIL R3 | VCAM1 | |
| stem cell factor | TRAIL R3 | cortisol | |
| stem cell factor | endothilin 1 | NrCAM | |
| stem cell factor | endothilin 1 | Tenascin C | |
| stem cell factor | endothilin 1 | VCAM1 | |
| stem cell factor | endothilin 1 | cortisol | |
| stem cell factor | NrCAM | Tenascin C | |
| stem cell factor | NrCAM | VCAM1 | |
| stem cell factor | NrCAM | cortisol | |
| stem cell factor | Tenascin C | VCAM1 | |
| stem cell factor | Tenascin C | cortisol | |
| stem cell factor | VCAM1 | cortisol | |
| TNF RII | AXL | Eotaxin 3 | |
| TNF RII | AXL | FABP | |
| TNF RII | AXL | FGF basic | |
| TNF RII | AXL | myoglobin | |
| TNF RII | AXL | resistin | |
| TNF RII | AXL | TRAIL R3 | |
| TNF RII | AXL | endothilin 1 | |
| TNF RII | AXL | NrCAM | |
| TNF RII | AXL | Tenascin C | |
| TNF RII | AXL | VCAM1 | |
| TNF RII | AXL | cortisol | |
| TNF RII | Eotaxin 3 | FABP | |
| TNF RII | Eotaxin 3 | FGF basic | |
| TNF RII | Eotaxin 3 | myoglobin | |
| TNF RII | Eotaxin 3 | resistin | |
| TNF RII | Eotaxin 3 | TRAIL R3 | |
| TNF RII | Eotaxin 3 | endothilin 1 | |
| TNF RII | Eotaxin 3 | NrCAM | |
| TNF RII | Eotaxin 3 | Tenascin C | |
| TNF RII | Eotaxin 3 | VCAM1 | |
| TNF RII | Eotaxin 3 | cortisol | |
| TNF RII | FABP | FGF basic | |
| TNF RII | FABP | myoglobin | |
| TNF RII | FABP | resistin | |
| TNF RII | FABP | TRAIL R3 | |
| TNF RII | FABP | endothilin 1 | |
| TNF RII | FABP | NrCAM | |
| TNF RII | FABP | Tenascin C | |
| TNF RII | FABP | VCAM1 | |
| TNF RII | FABP | cortisol | |
| TNF RII | FGF basic | myoglobin | |
| TNF RII | FGF basic | resistin | |
| TNF RII | FGF basic | TRAIL R3 | |
| TNF RII | FGF basic | endothilin 1 | |
| TNF RII | FGF basic | NrCAM | |
| TNF RII | FGF basic | Tenascin C | |
| TNF RII | FGF basic | VCAM1 | |
| TNF RII | FGF basic | cortisol | |
| TNF RII | myoglobin | resistin | |
| TNF RII | myoglobin | TRAIL R3 | |
| TNF RII | myoglobin | endothilin 1 | |
| TNF RII | myoglobin | NrCAM | |
| TNF RII | myoglobin | Tenascin C | |
| TNF RII | myoglobin | VCAM1 | |
| TNF RII | myoglobin | cortisol | |
| TNF RII | resistin | TRAIL R3 | |
| TNF RII | resistin | endothilin 1 | |
| TNF RII | resistin | NrCAM | |
| TNF RII | resistin | Tenascin C | |
| TNF RII | resistin | VCAM1 | |
| TNF RII | resistin | cortisol | |
| TNF RII | TRAIL R3 | endothilin 1 | |
| TNF RII | TRAIL R3 | NrCAM | |
| TNF RII | TRAIL R3 | Tenascin C | |
| TNF RII | TRAIL R3 | VCAM1 | |
| TNF RII | TRAIL R3 | cortisol | |
| TNF RII | endothilin 1 | NrCAM | |
| TNF RII | endothilin 1 | Tenascin C | |
| TNF RII | endothilin 1 | VCAM1 | |
| TNF RII | endothilin 1 | cortisol | |
| TNF RII | NrCAM | Tenascin C | |
| TNF RII | NrCAM | VCAM1 | |
| TNF RII | NrCAM | cortisol | |
| TNF RII | Tenascin C | VCAM1 | |
| TNF RII | Tenascin C | cortisol | |
| TNF RII | VCAM1 | cortisol | |
| AXL | Eotaxin 3 | FABP | |
| AXL | Eotaxin 3 | FGF basic | |
| AXL | Eotaxin 3 | myoglobin | |
| AXL | Eotaxin 3 | resistin | |
| AXL | Eotaxin 3 | TRAIL R3 | |
| AXL | Eotaxin 3 | endothilin 1 | |
| AXL | Eotaxin 3 | NrCAM | |
| AXL | Eotaxin 3 | Tenascin C | |
| AXL | Eotaxin 3 | VCAM1 | |
| AXL | Eotaxin 3 | cortisol | |
| AXL | FABP | FGF basic | |
| AXL | FABP | myoglobin | |
| AXL | FABP | resistin | |
| AXL | FABP | TRAIL R3 | |
| AXL | FABP | endothilin 1 | |
| AXL | FABP | NrCAM | |
| AXL | FABP | Tenascin C | |
| AXL | FABP | VCAM1 | |
| AXL | FABP | cortisol | |
| AXL | FGF basic | myoglobin | |
| AXL | FGF basic | resistin | |
| AXL | FGF basic | TRAIL R3 | |
| AXL | FGF basic | endothilin 1 | |
| AXL | FGF basic | NrCAM | |
| AXL | FGF basic | Tenascin C | |
| AXL | FGF basic | VCAM1 | |
| AXL | FGF basic | cortisol | |
| AXL | myoglobin | resistin | |
| AXL | myoglobin | TRAIL R3 | |
| AXL | myoglobin | endothilin 1 | |
| AXL | myoglobin | NrCAM | |
| AXL | myoglobin | Tenascin C | |
| AXL | myoglobin | VCAM1 | |
| AXL | myoglobin | cortisol | |
| AXL | resistin | TRAIL R3 | |
| AXL | resistin | endothilin 1 | |
| AXL | resistin | NrCAM | |
| AXL | resistin | Tenascin C | |
| AXL | resistin | VCAM1 | |
| AXL | resistin | cortisol | |
| AXL | TRAIL R3 | endothilin 1 | |
| AXL | TRAIL R3 | NrCAM | |
| AXL | TRAIL R3 | Tenascin C | |
| AXL | TRAIL R3 | VCAM1 | |
| AXL | TRAIL R3 | cortisol | |
| AXL | endothilin 1 | NrCAM | |
| AXL | endothilin 1 | Tenascin C | |
| AXL | endothilin 1 | VCAM1 | |
| AXL | endothilin 1 | cortisol | |
| AXL | NrCAM | Tenascin C | |
| AXL | NrCAM | VCAM1 | |
| AXL | NrCAM | cortisol | |
| AXL | Tenascin C | VCAM1 | |
| AXL | Tenascin C | cortisol | |
| AXL | VCAM1 | cortisol | |
| Eotaxin 3 | FABP | FGF basic | |
| Eotaxin 3 | FABP | myoglobin | |
| Eotaxin 3 | FABP | resistin | |
| Eotaxin 3 | FABP | TRAIL R3 | |
| Eotaxin 3 | FABP | endothilin 1 | |
| Eotaxin 3 | FABP | NrCAM | |
| Eotaxin 3 | FABP | Tenascin C | |
| Eotaxin 3 | FABP | VCAM1 | |
| Eotaxin 3 | FABP | cortisol | |
| Eotaxin 3 | FGF basic | myoglobin | |
| Eotaxin 3 | FGF basic | resistin | |
| Eotaxin 3 | FGF basic | TRAIL R3 | |
| Eotaxin 3 | FGF basic | endothilin 1 | |
| Eotaxin 3 | FGF basic | NrCAM | |
| Eotaxin 3 | FGF basic | Tenascin C | |
| Eotaxin 3 | FGF basic | VCAM1 | |
| Eotaxin 3 | FGF basic | cortisol | |
| Eotaxin 3 | myoglobin | resistin | |
| Eotaxin 3 | myoglobin | TRAIL R3 | |
| Eotaxin 3 | myoglobin | endothilin 1 | |
| Eotaxin 3 | myoglobin | NrCAM | |
| Eotaxin 3 | myoglobin | Tenascin C | |
| Eotaxin 3 | myoglobin | VCAM1 | |
| Eotaxin 3 | myoglobin | cortisol | |
| Eotaxin 3 | resistin | TRAIL R3 | |
| Eotaxin 3 | resistin | endothilin 1 | |
| Eotaxin 3 | resistin | NrCAM | |
| Eotaxin 3 | resistin | Tenascin C | |
| Eotaxin 3 | resistin | VCAM1 | |
| Eotaxin 3 | resistin | cortisol | |
| Eotaxin 3 | TRAIL R3 | endothilin 1 | |
| Eotaxin 3 | TRAIL R3 | NrCAM | |
| Eotaxin 3 | TRAIL R3 | Tenascin C | |
| Eotaxin 3 | TRAIL R3 | VCAM1 | |
| Eotaxin 3 | TRAIL R3 | cortisol | |
| Eotaxin 3 | endothilin 1 | NrCAM | |
| Eotaxin 3 | endothilin 1 | Tenascin C | |
| Eotaxin 3 | endothilin 1 | VCAM1 | |
| Eotaxin 3 | endothilin 1 | cortisol | |
| Eotaxin 3 | NrCAM | Tenascin C | |
| Eotaxin 3 | NrCAM | VCAM1 | |
| Eotaxin 3 | NrCAM | cortisol | |
| Eotaxin 3 | Tenascin C | VCAM1 | |
| Eotaxin 3 | Tenascin C | cortisol | |
| Eotaxin 3 | VCAM1 | cortisol | |
| FABP | FGF basic | myoglobin | |
| FABP | FGF basic | resistin | |
| FABP | FGF basic | TRAIL R3 | |
| FABP | FGF basic | endothilin 1 | |
| FABP | FGF basic | NrCAM | |
| FABP | FGF basic | Tenascin C | |
| FABP | FGF basic | VCAM1 | |
| FABP | FGF basic | cortisol | |
| FABP | myoglobin | resistin | |
| FABP | myoglobin | TRAIL R3 | |
| FABP | myoglobin | endothilin 1 | |
| FABP | myoglobin | NrCAM | |
| FABP | myoglobin | Tenascin C | |
| FABP | myoglobin | VCAM1 | |
| FABP | myoglobin | cortisol | |
| FABP | resistin | TRAIL R3 | |
| FABP | resistin | endothilin 1 | |
| FABP | resistin | NrCAM | |
| FABP | resistin | Tenascin C | |
| FABP | resistin | VCAM1 | |
| FABP | resistin | cortisol | |
| FABP | TRAIL R3 | endothilin 1 | |
| FABP | TRAIL R3 | NrCAM | |
| FABP | TRAIL R3 | Tenascin C | |
| FABP | TRAIL R3 | VCAM1 | |
| FABP | TRAIL R3 | cortisol | |
| FABP | endothilin 1 | NrCAM | |
| FABP | endothilin 1 | Tenascin C | |
| FABP | endothilin 1 | VCAM1 | |
| FABP | endothilin 1 | cortisol | |
| FABP | NrCAM | Tenascin C | |
| FABP | NrCAM | VCAM1 | |
| FABP | NrCAM | cortisol | |
| FABP | Tenascin C | VCAM1 | |
| FABP | Tenascin C | cortisol | |
| FABP | VCAM1 | cortisol | |
| FGF basic | myoglobin | resistin | |
| FGF basic | myoglobin | TRAIL R3 | |
| FGF basic | myoglobin | endothilin 1 | |
| FGF basic | myoglobin | NrCAM | |
| FGF basic | myoglobin | Tenascin C | |
| FGF basic | myoglobin | VCAM1 | |
| FGF basic | myoglobin | cortisol | |
| FGF basic | resistin | TRAIL R3 | |
| FGF basic | resistin | endothilin 1 | |
| FGF basic | resistin | NrCAM | |
| FGF basic | resistin | Tenascin C | |
| FGF basic | resistin | VCAM1 | |
| FGF basic | resistin | cortisol | |
| FGF basic | TRAIL R3 | endothilin 1 | |
| FGF basic | TRAIL R3 | NrCAM | |
| FGF basic | TRAIL R3 | Tenascin C | |
| FGF basic | TRAIL R3 | VCAM1 | |
| FGF basic | TRAIL R3 | cortisol | |
| FGF basic | endothilin 1 | NrCAM | |
| FGF basic | endothilin 1 | Tenascin C | |
| FGF basic | endothilin 1 | VCAM1 | |
| FGF basic | endothilin 1 | cortisol | |
| FGF basic | NrCAM | Tenascin C | |
| FGF basic | NrCAM | VCAM1 | |
| FGF basic | NrCAM | cortisol | |
| FGF basic | Tenascin C | VCAM1 | |
| FGF basic | Tenascin C | cortisol | |
| FGF basic | VCAM1 | cortisol | |
| myoglobin | resistin | TRAIL R3 | |
| myoglobin | resistin | endothilin 1 | |
| myoglobin | resistin | NrCAM | |
| myoglobin | resistin | Tenascin C | |
| myoglobin | resistin | VCAM1 | |
| myoglobin | resistin | cortisol | |
| myoglobin | TRAIL R3 | endothilin 1 | |
| myoglobin | TRAIL R3 | NrCAM | |
| myoglobin | TRAIL R3 | Tenascin C | |
| myoglobin | TRAIL R3 | VCAM1 | |
| myoglobin | TRAIL R3 | cortisol | |
| myoglobin | endothilin 1 | NrCAM | |
| myoglobin | endothilin 1 | Tenascin C | |
| myoglobin | endothilin 1 | VCAM1 | |
| myoglobin | endothilin 1 | cortisol | |
| myoglobin | NrCAM | Tenascin C | |
| myoglobin | NrCAM | VCAM1 | |
| myoglobin | NrCAM | cortisol | |
| myoglobin | Tenascin C | VCAM1 | |
| myoglobin | Tenascin C | cortisol | |
| myoglobin | VCAM1 | cortisol | |
| resistin | TRAIL R3 | endothilin 1 | |
| resistin | TRAIL R3 | NrCAM | |
| resistin | TRAIL R3 | Tenascin C | |
| resistin | TRAIL R3 | VCAM1 | |
| resistin | TRAIL R3 | cortisol | |
| resistin | endothilin 1 | NrCAM | |
| resistin | endothilin 1 | Tenascin C | |
| resistin | endothilin 1 | VCAM1 | |
| resistin | endothilin 1 | cortisol | |
| resistin | NrCAM | Tenascin C | |
| resistin | NrCAM | VCAM1 | |
| resistin | NrCAM | cortisol | |
| resistin | Tenascin C | VCAM1 | |
| resistin | Tenascin C | cortisol | |
| resistin | VCAM1 | cortisol | |
| TRAIL R3 | endothilin 1 | NrCAM | |
| TRAIL R3 | endothilin 1 | Tenascin C | |
| TRAIL R3 | endothilin 1 | VCAM1 | |
| TRAIL R3 | endothilin 1 | cortisol | |
| TRAIL R3 | NrCAM | Tenascin C | |
| TRAIL R3 | NrCAM | VCAM1 | |
| TRAIL R3 | NrCAM | cortisol | |
| TRAIL R3 | Tenascin C | VCAM1 | |
| TRAIL R3 | Tenascin C | cortisol | |
| TRAIL R3 | VCAM1 | cortisol | |
| endothilin 1 | NrCAM | Tenascin C | |
| endothilin 1 | NrCAM | VCAM1 | |
| endothilin 1 | NrCAM | cortisol | |
| endothilin 1 | Tenascin C | VCAM1 | |
| endothilin 1 | Tenascin C | cortisol | |
| endothilin 1 | VCAM1 | cortisol | |
| NrCAM | Tenascin C | VCAM1 | |
| NrCAM | Tenascin C | cortisol | |
| NrCAM | VCAM1 | cortisol | |
| Tenascin C | VCAM1 | cortisol | |
III. Test Sample
The method for diagnosing, monitoring, or determining a renal disorder involves determining the presence of sample analytes in a test sample. A test sample, as defined herein, is an amount of bodily fluid taken from a mammal. Non-limiting examples of bodily fluids include urine, blood, plasma, serum, saliva, semen, perspiration, tears, mucus, and tissue lysates. In an exemplary embodiment, the bodily fluid contained in the test sample is urine, plasma, or serum.
(a) Mammals
A mammal, as defined herein, is any organism that is a member of the class Mammalia. Non-limiting examples of mammals appropriate for the various embodiments may include humans, apes, monkeys, rats, mice, dogs, cats, pigs, and livestock including cattle and oxen. In an exemplary embodiment, the mammal is a human.
(b) Devices and Methods of Taking Bodily Fluids from Mammals
The bodily fluids of the test sample may be taken from the mammal using any known device or method so long as the analytes to be measured by the multiplexed assay are not rendered undetectable by the multiplexed assay. Non-limiting examples of devices or methods suitable for taking bodily fluid from a mammal include urine sample cups, urethral catheters, swabs, hypodermic needles, thin needle biopsies, hollow needle biopsies, punch biopsies, metabolic cages, and aspiration.
In order to adjust the expected concentrations of the sample analytes in the test sample to fall within the dynamic range of the multiplexed assay, the test sample may be diluted to reduce the concentration of the sample analytes prior to analysis. The degree of dilution may depend on a variety of factors including but not limited to the type of multiplexed assay used to measure the analytes, the reagents utilized in the multiplexed assay, and the type of bodily fluid contained in the test sample. In one embodiment, the test sample is diluted by adding a volume of diluent ranging from about ½ of the original test sample volume to about 50,000 times the original test sample volume.
In one exemplary embodiment, if the test sample is human urine and the multiplexed assay is an antibody-based capture-sandwich assay, the test sample is diluted by adding a volume of diluent that is about 100 times the original test sample volume prior to analysis. In another exemplary embodiment, if the test sample is human serum and the multiplexed assay is an antibody-based capture-sandwich assay, the test sample is diluted by adding a volume of diluent that is about 5 times the original test sample volume prior to analysis. In yet another exemplary embodiment, if the test sample is human plasma and the multiplexed assay is an antibody-based capture-sandwich assay, the test sample is diluted by adding a volume of diluent that is about 2,000 times the original test sample volume prior to analysis.
The diluent may be any fluid that does not interfere with the function of the multiplexed assay used to measure the concentration of the analytes in the test sample. Non-limiting examples of suitable diluents include deionized water, distilled water, saline solution, Ringer's solution, phosphate buffered saline solution, TRIS-buffered saline solution, standard saline citrate, and HEPES-buffered saline.
IV. Multiplexed Assay Device
In one embodiment, the concentration of a combination of sample analytes is measured using a multiplexed assay device capable of measuring up to 189 of the biomarker analytes. A multiplexed assay device, as defined herein, is an assay capable of simultaneously determining the concentration of three or more, four or more, five or more, six or more, seven or more, eight or more, nine or more, ten or more, eleven or more, twelve or more, thirteen or more, fourteen or more, fifteen or more, sixteen or more, seventeen or more, eighteen or more, nineteen or more, or twenty or more of the biomarker analytes using a single device and/or method. Any known method of measuring the concentration of the biomarker analytes may be used for the multiplexed assay device. Non-limiting examples of measurement methods suitable for the multiplexed assay device include electrophoresis, mass spectrometry, protein microarrays, surface plasmon resonance, and immunoassays including, but not limited to western blot, immunohistochemical staining, enzyme-linked immunosorbent assay (ELISA) methods, vibrational detection using MicroElectroMagnetic Devices (MEMS), and particle-based capture-sandwich immunoassays.
(a) Multiplexed Immunoassay Device
In one embodiment, the concentrations of the analytes in the test sample are measured using a multiplexed immunoassay device that utilizes capture antibodies marked with indicators to determine the concentration of the sample analytes.
(i) Capture Antibodies
In the same embodiment, the multiplexed immunoassay device includes three or more capture antibodies. Capture antibodies, as defined herein, are antibodies in which the antigenic determinant is one of the Biomarker Analytes known in the art to have a documented association with early renal damage in humans. The biomarker analytes include, but are note limited to alpha-1-microglobulin, beta-2-microglobulin, calbindin, clusterin, CTGF, creatinine, cystatin C, GST-alpha, KIM-1, microalbumin, NGAL, osteopontin, THP, TIMP-1, TFF-3, and VEGF. Each of the at least three capture antibodies has a unique antigenic determinant that is one of the biomarker analytes. When contacted with the test sample, the capture antibodies form antigen-antibody complexes in which the analytes serve as antigens.
The term “antibody,” as used herein, encompasses a monoclonal ab, an antibody fragment, a chimeric antibody, and a single-chain antibody.
In some embodiments, the capture antibodies may be attached to a platform or other substrate having a contact surface in order to immobilize any analytes captured by the capture antibodies. The platform generally incorporates a porous material for immobilizing the analytes. Non-limiting examples of suitable substrates include paper, nitrocellulose, cellulose, glass, glass fiber mesh, silica gel, synthetic resins, or plastic strips, beads, or surfaces, such as the inner surface of the well of a microtitration tray. Suitable beads may include polystyrene or latex microspheres.
(ii) indicators
In one embodiment of the multiplexed immunoassay device, an indicator is attached to each of the three or more capture antibodies. The indicator, as defined herein, is any compound that registers a measurable change to indicate the presence of one of the sample analytes when bound to one of the capture antibodies. Non-limiting examples of indicators include visual indicators and electrochemical indicators.
Visual indicators, as defined herein, are compounds that register a change by reflecting a limited subset of the wavelengths of light illuminating the indicator, by fluorescing light after being illuminated, or by emitting light via chemiluminescence. The change registered by visual indicators may be in the visible light spectrum, in the infrared spectrum, or in the ultraviolet spectrum. Non-limiting examples of visual indicators suitable for the multiplexed immunoassay device include nanoparticulate gold, organic particles such as polyurethane or latex microspheres loaded with dye compounds, carbon black, fluorophores, phycoerythrin, radioactive isotopes, nanoparticles, quantum dots, and enzymes such as horseradish peroxidase or alkaline phosphatase that react with a chemical substrate to form a colored or chemiluminescent product.
Electrochemical indicators, as defined herein, are compounds that register a change by altering an electrical property. The changes registered by electrochemical indicators may be an alteration in conductivity, resistance, capacitance, current conducted in response to an applied voltage, or voltage required to achieve a desired current. Non-limiting examples of electrochemical indicators include redox species such as ascorbate (vitamin C), vitamin E, glutathione, polyphenols, catechols, quercetin, phytoestrogens, penicillin, carbazole, murranes, phenols, carbonyls, benzoates, and trace metal ions such as nickel, copper, cadmium, iron and mercury.
In this same embodiment, the test sample containing a combination of three or more sample analytes is contacted with the capture antibodies and allowed to form antigen-antibody complexes in which the sample analytes serve as the antigens. After removing any uncomplexed capture antibodies, the concentrations of the three or more analytes are determined by measuring the change registered by the indicators attached to the capture antibodies.
In one exemplary embodiment, the indicators are polyurethane or latex microspheres loaded with dye compounds and phycoerythrin.
(b) Multiplexed Sandwich Immunoassay Device
In another embodiment, the multiplexed immunoassay device has a sandwich assay format. In this embodiment, the multiplexed sandwich immunoassay device includes three or more capture antibodies as previously described. However, in this embodiment, each of the capture antibodies is attached to a capture agent that includes an antigenic moiety. The antigenic moiety serves as the antigenic determinant of a detection antibody, also included in the multiplexed immunoassay device of this embodiment. In addition, an indicator is attached to the detection antibody.
In this same embodiment, the test sample is contacted with the capture antibodies and allowed to form antigen-antibody complexes in which the sample analytes serve as antigens. The detection antibodies are then contacted with the test sample and allowed to form antigen-antibody complexes in which the capture agent serves as the antigen for the detection antibody. After removing any uncomplexed detection antibodies the concentration of the analytes are determined by measuring the changes registered by the indicators attached to the detection antibodies.
(c) Multiplexing Approaches
In the various embodiments of the multiplexed immunoassay devices, the concentrations of each of the sample analytes may be determined using any approach known in the art. In one embodiment, a single indicator compound is attached to each of the three or more antibodies. In addition, each of the capture antibodies having one of the sample analytes as an antigenic determinant is physically separated into a distinct region so that the concentration of each of the sample analytes may be determined by measuring the changes registered by the indicators in each physically separate region corresponding to each of the sample analytes.
In another embodiment, each antibody having one of the sample analytes as an antigenic determinant is marked with a unique indicator. In this manner, a unique indicator is attached to each antibody having a single sample analyte as its antigenic determinant. In this embodiment, all antibodies may occupy the same physical space. The concentration of each sample analyte is determined by measuring the change registered by the unique indicator attached to the antibody having the sample analyte as an antigenic determinant.
(d) Microsphere-Based Capture-Sandwich Immunoassay Device
In an exemplary embodiment, the multiplexed immunoassay device is a microsphere-based capture-sandwich immunoassay device. In this embodiment, the device includes a mixture of three or more capture-antibody microspheres, in which each capture-antibody microsphere corresponds to one of the biomarker analytes. Each capture-antibody microsphere includes a plurality of capture antibodies attached to the outer surface of the microsphere. In this same embodiment, the antigenic determinant of all of the capture antibodies attached to one microsphere is the same biomarker analyte.
In this embodiment of the device, the microsphere is a small polystyrene or latex sphere that is loaded with an indicator that is a dye compound. The microsphere may be between about 3 μm and about 5 μm in diameter. Each capture-antibody microsphere corresponding to one of the biomarker analytes is loaded with the same indicator. In this manner, each capture-antibody microsphere corresponding to a biomarker analyte is uniquely color-coded.
In this same exemplary embodiment, the multiplexed immunoassay device further includes three or more biotinylated detection antibodies in which the antigenic determinant of each biotinylated detection antibody is one of the biomarker analytes. The device further includes a plurality of streptaviden proteins complexed with a reporter compound. A reporter compound, as defined herein, is an indicator selected to register a change that is distinguishable from the indicators used to mark the capture-antibody microspheres.
The concentrations of the sample analytes may be determined by contacting the test sample with a mixture of capture-antigen microspheres corresponding to each sample analyte to be measured. The sample analytes are allowed to form antigen-antibody complexes in which a sample analyte serves as an antigen and a capture antibody attached to the microsphere serves as an antibody. In this manner, the sample analytes are immobilized onto the capture-antigen microspheres. The biotinylated detection antibodies are then added to the test sample and allowed to form antigen-antibody complexes in which the analyte serves as the antigen and the biotinylated detection antibody serves as the antibody. The streptaviden-reporter complex is then added to the test sample and allowed to bind to the biotin moieties of the biotinylated detection antibodies. The antigen-capture microspheres may then be rinsed and filtered.
In this embodiment, the concentration of each analyte is determined by first measuring the change registered by the indicator compound embedded in the capture-antigen microsphere in order to identify the particular analyte. For each microsphere corresponding to one of the biomarker analytes, the quantity of analyte immobilized on the microsphere is determined by measuring the change registered by the reporter compound attached to the microsphere.
For example, the indicator embedded in the microspheres associated with one sample analyte may register an emission of orange light, and the reporter may register an emission of green light. In this example, a detector device may measure the intensity of orange light and green light separately. The measured intensity of the green light would determine the concentration of the analyte captured on the microsphere, and the intensity of the orange light would determine the specific analyte captured on the microsphere.
Any sensor device may be used to detect the changes registered by the indicators embedded in the microspheres and the changes registered by the reporter compound, so long as the sensor device is sufficiently sensitive to the changes registered by both indicator and reporter compound. Non-limiting examples of suitable sensor devices include spectrophotometers, photosensors, colorimeters, cyclic coulometry devices, and flow cytometers. In an exemplary embodiment, the sensor device is a flow cytometer.
(e) Vibrational Detection Device
In another exemplary embodiment, the multiplexed immunoassay device has a vibrational detection format using a MEMS. In this embodiment, the immunoassay device uses capture antibodies as previously described. However, in this embodiment, the capture antibodies are attached to a microscopic silicon microcantilever beam structure. The microcantilevers are micromechanical beams that are anchored at one end, such as diving spring boards that can be readily fabricated on silicon wafers and other materials. The microcantilever sensors are physical sensors that respond to surface stress changes due to chemical or biological processes. When fabricated with very small force constants, they can measure forces and stresses with extremely high sensitivity. The very small force constant of a cantilever allows detection not surface stress variation due to the binding of an analyte to the capture antibody on the microcantilever. Binding of the analyte results in a differential surface stress due to adsorption-induced forces, which manifests as a deflection which can be measured. The vibrational detection may be multiplexed. For more details, see Datar et al., MRS Bulletin (2009) 34:449-459 and Gaster et al., Nature Medicine (2009) 15:1327-1332, both of which are hereby incorporated by reference in their entireties.
It will be understood by one skilled in the art that the devices described herein, as well as all those embodiments within the scope of the current invention may be incorporated into a kit. Generally, the kit may include any of the devices described herein in addition to a collection apparatus suitable for collecting a sample of bodily fluid from the mammal. The collection apparatus may include, but it not limited to urine sample cups, urethral catheters, swabs, hypodermic needles, thin needles, hollow needles, metabolic cages, aspiration needles, and combinations thereof.
EXAMPLES
The following examples illustrate various iterations of the invention.
Example 1
Least Detectable Dose and Lower Limit of Quantitation of Assay for Analytes Associated with Renal Disorders
To assess the least detectable doses (LDD) and lower limits of quantitation (LLOQ) of a variety of analytes associated with renal disorders, the following experiment was conducted. The analytes measured were alpha-1 microglobulin (A1M), beta-2 microglobulin (B2M), calbindin, clusterin, CTGF, cystatin C, GST-alpha, KIM-1, NGAL, osteopontin (OPN), THP, TIMP-1, TFF-3, and VEGF.
The concentrations of the analytes were measured using a capture-sandwich assay using antigen-specific antibodies. For each analyte, a range of standard sample dilutions ranging over about four orders of magnitude of analyte concentration were measured using the assay in order to obtain data used to construct a standard dose response curve. The dynamic range for each of the analytes, defined herein as the range of analyte concentrations measured to determine its dose response curve, is presented below.
To perform the assay, 5 μL of a diluted mixture of capture-antibody microspheres were mixed with 5 μL of blocker and 10 μL of pre-diluted standard sample in each of the wells of a hard-bottom microtiter plate. After incubating the hard-bottom plate for 1 hour, 10 μL of biotinylated detection antibody was added to each well, and then the hard-bottom plate was incubated for an additional hour. 10 μL of diluted streptavidin-phycoerythrin was added to each well and then the hard-bottom plate was incubated for another 60 minutes.
A filter-membrane microtiter plate was pre-wetted by adding 100 μL wash buffer, and then aspirated using a vacuum manifold device. The contents of the wells of the hard-bottom plate were then transferred to the corresponding wells of the filter-membrane plate. All wells of the hard-bottom plate were vacuum-aspirated and the contents were washed twice with 100 μL of wash buffer. After the second wash, 100 μL of wash buffer was added to each well, and then the washed microspheres were resuspended with thorough mixing. The plate was then analyzed using a Luminex 100 Analyzer (Luminex Corporation, Austin, Tex., USA). Dose response curves were constructed for each analyte by curve-fitting the median fluorescence intensity (MFI) measured from the assays of diluted standard samples containing a range of analyte concentrations.
The least detectable dose (LDD) was determined by adding three standard deviations to the average of the MFI signal measured for 20 replicate samples of blank standard solution (i.e. standard solution containing no analyte). The MFI signal was converted to an LDD concentration using the dose response curve and multiplied by a dilution factor of 2.
The lower limit of quantification (LLOQ), defined herein as the point at which the coefficient of variation (CV) for the analyte measured in the standard samples was 30%, was determined by the analysis of the measurements of increasingly diluted standard samples. For each analyte, the standard solution was diluted by 2 fold for 8 dilutions. At each stage of dilution, samples were assayed in triplicate, and the CV of the analyte concentration at each dilution was calculated and plotted as a function of analyte concentration. The LLOQ was interpolated from this plot and multiplied by a dilution factor of 2.
The LDD and LLOQ results for each analyte are summarized in Table 2:
| TABLE 2 |
| LDD, LLOQ, and Dynamic Range of Analyte Assay |
| Dynamic Range |
| Analyte | Units | LDD | LLOQ | minimum | maximum |
| Calbindin | ng/mL | 1.1 | 3.1 | 0.516 | 2580 |
| Clusterin | ng/mL | 2.4 | 2.3 | 0.676 | 3378 |
| CTGF | ng/mL | 1.3 | 3.8 | 0.0794 | 400 |
| GST-alpha | ng/mL | 1.4 | 3.6 | 0.24 | 1,200 |
| KIM-1 | ng/mL | 0.016 | 0.028 | 0.00478 | 24 |
| VEGF | pg/mL | 4.4 | 20 | 8.76 | 44,000 |
| β-2M | μg/mL | 0.012 | 0.018 | 0.0030 | 15 |
| Cystatin C | ng/mL | 2.8 | 3.7 | 0.60 | 3,000 |
| NGAL | ng/mL | 4.1 | 7.8 | 1.2 | 6,000 |
| Osteopontin | ng/mL | 29 | 52 | 3.9 | 19,500 |
| TIMP-1 | ng/mL | 0.71 | 1.1 | 0.073 | 365 |
| A-1M | μg/mL | 0.059 | 0.29 | 0.042 | 210 |
| THP | μg/mL | 0.46 | 0.30 | 0.16 | 800 |
| TFF-3 | μg/mL | 0.06 | 0.097 | 0.060 | 300 |
The results of this experiment characterized the least detectible dose and the lower limit of quantification for fourteen analytes associated with various renal disorders using a capture-sandwich assay.
Example 2
Precision of Assay for Analytes Associated with Renal Disorders
To assess the precision of an assay used to measure the concentration of analytes associated with renal disorders, the following experiment was conducted. The analytes measured were alpha-1 microglobulin (A1M), beta-2 microglobulin (B2M), calbindin, clusterin, CTGF, cystatin C, GST-alpha, KIM-1, NGAL, osteopontin (OPN), THP, TIMP-1, TFF-3, and VEGF. For each analyte, three concentration levels of standard solution were measured in triplicate during three runs using the methods described in Example 1. The percent errors for each run at each concentration are presented in Table 3 for all of the analytes tested:
| TABLE 3 |
| Precision of Analyte Assay |
| Average | Run 2 | Interrun | |||
| concentration | Run 1 | Error | Run 2 | Error | |
| Analyte | (ng/mL) | Error (%) | (%) | Error (%) | (%) |
| Calbindin | 4.0 | 6 | 2 | 6 | 13 |
| 36 | 5 | 3 | 2 | 7 | |
| 281 | 1 | 6 | 0 | 3 | |
| Clusterin | 4.4 | 4 | 9 | 2 | 6 |
| 39 | 5 | 1 | 6 | 8 | |
| 229 | 1 | 3 | 0 | 2 | |
| CTGF | 1.2 | 10 | 17 | 4 | 14 |
| 2.5 | 19 | 19 | 14 | 14 | |
| 18 | 7 | 5 | 13 | 9 | |
| GST-alpha | 3.9 | 14 | 7 | 5 | 10 |
| 16 | 13 | 7 | 10 | 11 | |
| 42 | 1 | 16 | 6 | 8 | |
| KIM-1 | 0.035 | 2 | 0 | 5 | 13 |
| 0.32 | 4 | 5 | 2 | 8 | |
| 2.9 | 0 | 5 | 7 | 4 | |
| VEGF | 65 | 10 | 1 | 6 | 14 |
| 534 | 9 | 2 | 12 | 7 | |
| 5,397 | 1 | 13 | 14 | 9 | |
| β-2M | 0.040 | 6 | 1 | 8 | 5 |
| 0.43 | 2 | 2 | 0 | 10 | |
| 6.7 | 6 | 5 | 11 | 6 | |
| Cystatin C | 10.5 | 4 | 1 | 7 | 13 |
| 49 | 0 | 0 | 3 | 9 | |
| 424 | 2 | 6 | 2 | 5 | |
| NGAL | 18.1 | 11 | 3 | 6 | 13 |
| 147 | 0 | 0 | 6 | 5 | |
| 1,070 | 5 | 1 | 2 | 5 | |
| Osteopontin | 44 | 1 | 10 | 2 | 11 |
| 523 | 9 | 9 | 9 | 7 | |
| 8,930 | 4 | 10 | 1 | 10 | |
| TIMP-1 | 2.2 | 13 | 6 | 3 | 13 |
| 26 | 1 | 1 | 4 | 14 | |
| 130 | 1 | 3 | 1 | 4 | |
| A-1M | 1.7 | 11 | 7 | 7 | 14 |
| 19 | 4 | 1 | 8 | 9 | |
| 45 | 3 | 5 | 2 | 4 | |
| THP | 9.4 | 3 | 10 | 11 | 11 |
| 15 | 3 | 7 | 8 | 6 | |
| 37 | 4 | 5 | 0 | 5 | |
| TFF-3 | 0.3 | 13 | 3 | 11 | 12 |
| 4.2 | 5 | 8 | 5 | 7 | |
| 1.2 | 3 | 7 | 0 | 13 | |
The results of this experiment characterized the precision of a capture-sandwich assay for fourteen analytes associated with various renal disorders over a wide range of analyte concentrations. The precision of the assay varied between about 1% and about 15% error within a given run, and between about 5% and about 15% error between different runs. The percent errors summarized in Table 2 provide information concerning random error to be expected in an assay measurement caused by variations in technicians, measuring instruments, and times of measurement.
Example 3
Linearity of Assay for Analytes Associated with Renal Disorders
To assess the linearity of an assay used to measure the concentration of analytes associated with renal disorders, the following experiment was conducted. The analytes measured were alpha-1 microglobulin (A1M), beta-2 microglobulin (B2M), calbindin, clusterin, CTGF, cystatin C, GST-alpha, KIM-1, NGAL, osteopontin (OPN), THP, TIMP-1, TFF-3, and VEGF. For each analyte, three concentration levels of standard solution were measured in triplicate during three runs using the methods described in Example 1. Linearity of the assay used to measure each analyte was determined by measuring the concentrations of standard samples that were serially-diluted throughout the assay range. The % recovery was calculated as observed vs. expected concentration based on the dose-response curve. The results of the linearity analysis are summarized in Table 4.
| TABLE 4 |
| Linearity of Analyte Assay |
| Expected | Observed | Recovery | ||
| Analyte | Dilution | concentration | concentration | (%) |
| Calbindin | 1:2 | 61 | 61 | 100 |
| (ng/mL) | 1:4 | 30 | 32 | 106 |
| 1:8 | 15 | 17 | 110 | |
| Clusterin | 1:2 | 41 | 41 | 100 |
| (ng/mL) | 1:4 | 21 | 24 | 116 |
| 1:8 | 10 | 11 | 111 | |
| CTGF | 1:2 | 1.7 | 1.7 | 100 |
| (ng/mL) | 1:4 | 0.84 | 1.0 | 124 |
| 1:8 | 0.42 | 0.51 | 122 | |
| GST-alpha | 1:2 | 25 | 25 | 100 |
| (ng/mL) | 1:4 | 12 | 14 | 115 |
| 1:8 | 6.2 | 8.0 | 129 | |
| KIM-1 | 1:2 | 0.87 | 0.87 | 100 |
| (ng/mL) | 1:4 | 0.41 | 0.41 | 101 |
| 1:8 | 0.21 | 0.19 | 93 | |
| VEGF | 1:2 | 2,525 | 2,525 | 100 |
| (pg/mL) | 1:4 | 1,263 | 1,340 | 106 |
| 1:8 | 631 | 686 | 109 | |
| β-2M | 1:100 | 0.63 | 0.63 | 100 |
| (μg/mL) | 1:200 | 0.31 | 0.34 | 106 |
| 1:400 | 0.16 | 0.17 | 107 | |
| Cystatin C | 1:100 | 249 | 249 | 100 |
| (ng/mL) | 1:200 | 125 | 122 | 102 |
| 1:400 | 62 | 56 | 110 | |
| NGAL | 1:100 | 1,435 | 1,435 | 100 |
| (ng/mL) | 1:200 | 718 | 775 | 108 |
| 1:400 | 359 | 369 | 103 | |
| Osteopontin | 1:100 | 6,415 | 6,415 | 100 |
| (ng/mL) | 1:200 | 3,208 | 3,275 | 102 |
| 1:400 | 1,604 | 1,525 | 95 | |
| TIMP-1 | 1:100 | 35 | 35 | 100 |
| (ng/mL) | 1:200 | 18 | 18 | 100 |
| 1:400 | 8.8 | 8.8 | 100 | |
| A-1M | 1:2000 | 37 | 37 | 100 |
| (μg/mL) | 1:4000 | 18 | 18 | 99 |
| 1:8000 | 9.1 | 9.2 | 99 | |
| THP | 1:2000 | 28 | 28 | 100 |
| (μg/mL) | 1:4000 | 14 | 14 | 96 |
| 1:8000 | 6.7 | 7.1 | 94 | |
| TFF-3 | 1:2000 | 8.8 | 8.8 | 100 |
| (μg/mL) | 1:4000 | 3.8 | 4.4 | 86 |
| 1:8000 | 1.9 | 2.2 | 86 | |
The results of this experiment demonstrated reasonably linear responses of the sandwich-capture assay to variations in the concentrations of the analytes in the tested samples.
Example 4
Spike Recovery of Analytes Associated with Renal Disorders
To assess the recovery of analytes spiked into urine, serum, and plasma samples by an assay used to measure the concentration of analytes associated with renal disorders, the following experiment was conducted. The analytes measured were alpha-1 microglobulin (A1M), beta-2 microglobulin (B2M), calbindin, clusterin, CTGF, cystatin C, GST-alpha, KIM-1, NGAL, osteopontin (OPN), THP, TIMP-1, TFF-3, and VEGF. For each analyte, three concentration levels of standard solution were spiked into known urine, serum, and plasma samples. Prior to analysis, all urine samples were diluted 1:2000 (sample: diluent), all plasma samples were diluted 1:5 (sample: diluent), and all serum samples were diluted 1:2000 (sample: diluent).
The concentrations of the analytes in the samples were measured using the methods described in Example 1. The average % recovery was calculated as the proportion of the measurement of analyte spiked into the urine, serum, or plasma sample (observed) to the measurement of analyte spiked into the standard solution (expected). The results of the spike recovery analysis are summarized in Table 5.
| TABLE 5 |
| Spike Recovery of Analyte Assay in Urine, Serum, and Plasma Samples |
| Recovery in | Recovery in | Recovery in | ||
| Spike | Urine | Serum | Plasma | |
| Analyte | Concentration | Sample (%) | Sample (%) | Sample (%) |
| Calbindin | 66 | 76 | 82 | 83 |
| (ng/mL) | 35 | 91 | 77 | 71 |
| 18 | 80 | 82 | 73 | |
| average | 82 | 80 | 76 | |
| Clusterin | 80 | 72 | 73 | 75 |
| (ng/mL) | 37 | 70 | 66 | 72 |
| 20 | 90 | 73 | 70 | |
| average | 77 | 70 | 72 | |
| CTGF | 8.4 | 91 | 80 | 79 |
| (ng/mL) | 4.6 | 114 | 69 | 78 |
| 2.4 | 76 | 80 | 69 | |
| average | 94 | 77 | 75 | |
| GST-alpha | 27 | 75 | 84 | 80 |
| (ng/mL) | 15 | 90 | 75 | 81 |
| 7.1 | 82 | 84 | 72 | |
| average | 83 | 81 | 78 | |
| KIM-1 | 0.63 | 87 | 80 | 83 |
| (ng/mL) | .029 | 119 | 74 | 80 |
| 0.14 | 117 | 80 | 78 | |
| average | 107 | 78 | 80 | |
| VEGF | 584 | 88 | 84 | 82 |
| (pg/mL) | 287 | 101 | 77 | 86 |
| 123 | 107 | 84 | 77 | |
| average | 99 | 82 | 82 | |
| β-2M | 0.97 | 117 | 98 | 98 |
| (μg/mL) | 0.50 | 124 | 119 | 119 |
| 0.24 | 104 | 107 | 107 | |
| average | 115 | 108 | 105 | |
| Cystatin C | 183 | 138 | 80 | 103 |
| (ng/mL) | 90 | 136 | 97 | 103 |
| 40 | 120 | 97 | 118 | |
| average | 131 | 91 | 108 | |
| NGAL | 426 | 120 | 105 | 111 |
| (ng/mL) | 213 | 124 | 114 | 112 |
| 103 | 90 | 99 | 113 | |
| average | 111 | 106 | 112 | |
| Osteopontin | 1,245 | 204 | 124 | 68 |
| (ng/mL) | 636 | 153 | 112 | 69 |
| 302 | 66 | 103 | 67 | |
| average | 108 | 113 | 68 | |
| TIMP-1 | 25 | 98 | 97 | 113 |
| (ng/mL) | 12 | 114 | 89 | 103 |
| 5.7 | 94 | 99 | 113 | |
| average | 102 | 95 | 110 | |
| A-1M | 0.0028 | 100 | 101 | 79 |
| (μg/mL) | 0.0012 | 125 | 80 | 81 |
| 0.00060 | 118 | 101 | 82 | |
| average | 114 | 94 | 81 | |
| THP | 0.0096 | 126 | 108 | 90 |
| (μg/mL) | 0.0047 | 131 | 93 | 91 |
| 0.0026 | 112 | 114 | 83 | |
| average | 123 | 105 | 88 | |
| TFF-3 | 0.0038 | 105 | 114 | 97 |
| (μg/mL) | 0.0019 | 109 | 104 | 95 |
| 0.0010 | 102 | 118 | 93 | |
| average | 105 | 112 | 95 | |
The results of this experiment demonstrated that the sandwich-type assay is reasonably sensitive to the presence of all analytes measured, whether the analytes were measured in standard samples, urine samples, plasma samples, or serum samples.
Example 5
Matrix Interferences of Analytes Associated with Renal Disorders
To assess the matrix interference of hemoglobin, bilirubin, and triglycerides spiked into standard samples, the following experiment was conducted. The analytes measured were alpha-1 microglobulin (A1M), beta-2 microglobulin (B2M), calbindin, clusterin, CTGF, cystatin C, GST-alpha, KIM-1, NGAL, osteopontin (OPN), THP, TIMP-1, TFF-3, and VEGF. For each analyte, three concentration levels of standard solution were spiked into known urine, serum, and plasma samples. Matrix interference was assessed by spiking hemoglobin, bilirubin, and triglyceride into standard analyte samples and measuring analyte concentrations using the methods described in Example 1. A % recovery was determined by calculating the ratio of the analyte concentration measured from the spiked sample (observed) divided by the analyte concentration measured form the standard sample (expected). The results of the matrix interference analysis are summarized in Table 6.
| TABLE 6 |
| Matrix Interference of Hemoglobin, Bilirubin, and Triglyceride on |
| the Measurement of Analytes |
| Matrix | ||||
| Compound | Maximum | Overall | ||
| Spiked into | Spike | Recovery | ||
| Analyte | Sample | Concentration | (%) | |
| Calbindin | Hemoglobin | 500 | 110 | |
| (mg/mL) | Bilirubin | 20 | 98 | |
| Triglyceride | 500 | 117 | ||
| Clusterin | Hemoglobin | 500 | 125 | |
| (mg/mL) | Bilirubin | 20 | 110 | |
| Triglyceride | 500 | 85 | ||
| CTGF | Hemoglobin | 500 | 91 | |
| (mg/mL) | Bilirubin | 20 | 88 | |
| Triglyceride | 500 | 84 | ||
| GST-alpha | Hemoglobin | 500 | 100 | |
| (mg/mL) | Bilirubin | 20 | 96 | |
| Triglyceride | 500 | 96 | ||
| KIM-1 | Hemoglobin | 500 | 108 | |
| (mg/mL) | Bilirubin | 20 | 117 | |
| Triglyceride | 500 | 84 | ||
| VEGF | Hemoglobin | 500 | 112 | |
| (mg/mL) | Bilirubin | 20 | 85 | |
| Triglyceride | 500 | 114 | ||
| β-2M | Hemoglobin | 500 | 84 | |
| (μg/mL) | Bilirubin | 20 | 75 | |
| Triglyceride | 500 | 104 | ||
| Cystatin C | Hemoglobin | 500 | 91 | |
| (ng/mL) | Bilirubin | 20 | 102 | |
| Triglyceride | 500 | 124 | ||
| NGAL | Hemoglobin | 500 | 99 | |
| (ng/mL) | Bilirubin | 20 | 92 | |
| Triglyceride | 500 | 106 | ||
| Osteopontin | Hemoglobin | 500 | 83 | |
| (ng/mL) | Bilirubin | 20 | 86 | |
| Triglyceride | 500 | 106 | ||
| TIMP-1 | Hemoglobin | 500 | 87 | |
| (ng/mL) | Bilirubin | 20 | 86 | |
| Triglyceride | 500 | 93 | ||
| A-1M | Hemoglobin | 500 | 103 | |
| (μg/mL) | Bilirubin | 20 | 110 | |
| Triglyceride | 500 | 112 | ||
| THP | Hemoglobin | 500 | 108 | |
| (μg/mL) | Bilirubin | 20 | 101 | |
| Triglyceride | 500 | 121 | ||
| TFF-3 | Hemoglobin | 500 | 101 | |
| (μg/mL) | Bilirubin | 20 | 101 | |
| Triglyceride | 500 | 110 | ||
The results of this experiment demonstrated that hemoglobin, bilirubin, and triglycerides, three common compounds found in urine, plasma, and serum samples, did not significantly degrade the ability of the sandwich-capture assay to detect any of the analytes tested.
Example 6
Sample Stability of Analytes Associated with Renal Disorders
To assess the ability of analytes spiked into urine, serum, and plasma samples to tolerate freeze-thaw cycles, the following experiment was conducted. The analytes measured were alpha-1 microglobulin (A1M), beta-2 microglobulin (B2M), calbindin, clusterin, CTGF, cystatin C, GST-alpha, KIM-1, NGAL, osteopontin (OPN), THP, TIMP-1, TFF-3, and VEGF. Each analyte was spiked into known urine, serum, and plasma samples at a known analyte concentration. The concentrations of the analytes in the samples were measured using the methods described in Example 1 after the initial addition of the analyte, and after one, two and three cycles of freezing and thawing. In addition, analyte concentrations in urine, serum and plasma samples were measured immediately after the addition of the analyte to the samples as well as after storage at room temperature for two hours and four hours, and after storage at 4° C. for 2 hours, four hours, and 24 hours.
The results of the freeze-thaw stability analysis are summarized in Table 7. The % recovery of each analyte was calculated as a percentage of the analyte measured in the sample prior to any freeze-thaw cycles.
| TABLE 7 |
| Freeze-Thaw Stability of the Analytes in Urine, Serum, and Plasma |
| Period | Urine Sample | Serum Sample | Plasma Sample |
| and | Recovery | Recovery | Recovery | ||||
| Analyte | Temp | Concentration | (%) | Concentration | (%) | Concentration | (%) |
| Calbindin | Control | 212 | 100 | 31 | 100 | 43 | 100 |
| (ng/mL) | 1X | 221 | 104 | 30 | 96 | 41 | 94 |
| 2X | 203 | 96 | 30 | 99 | 39 | 92 | |
| 3X | 234 | 110 | 30 | 97 | 40 | 93 | |
| Clusterin | 0 | 315 | 100 | 232 | 100 | 187 | 100 |
| (ng/mL) | 1X | 329 | 104 | 227 | 98 | 177 | 95 |
| 2X | 341 | 108 | 240 | 103 | 175 | 94 | |
| 3X | 379 | 120 | 248 | 107 | 183 | 98 | |
| CTGF | 0 | 6.7 | 100 | 1.5 | 100 | 1.2 | 100 |
| (ng/mL) | 1X | 7.5 | 112 | 1.3 | 82 | 1.2 | 94 |
| 2X | 6.8 | 101 | 1.4 | 90 | 1.2 | 100 | |
| 3X | 7.7 | 115 | 1.2 | 73 | 1.3 | 107 | |
| GST- | 0 | 12 | 100 | 23 | 100 | 11 | 100 |
| alpha | 1X | 13 | 104 | 24 | 105 | 11 | 101 |
| (ng/mL) | 2X | 14 | 116 | 21 | 92 | 11 | 97 |
| 3X | 14 | 111 | 23 | 100 | 12 | 108 | |
| KIM-1 | 0 | 1.7 | 100 | 0.24 | 100 | 0.24 | 100 |
| (ng/mL) | 1X | 1.7 | 99 | 0.24 | 102 | 0.22 | 91 |
| 2X | 1.7 | 99 | 0.22 | 94 | 0.19 | 78 | |
| 3X | 1.8 | 107 | 0.23 | 97 | 0.22 | 93 | |
| VEGF | 0 | 1,530 | 100 | 1,245 | 100 | 674 | 100 |
| (pg/mL) | 1X | 1,575 | 103 | 1,205 | 97 | 652 | 97 |
| 2X | 1,570 | 103 | 1,140 | 92 | 612 | 91 | |
| 3X | 1,700 | 111 | 1,185 | 95 | 670 | 99 | |
| β-2M | 0 | 0.0070 | 100 | 1.2 | 100 | 15 | 100 |
| (μg/mL) | 1X | 0.0073 | 104 | 1.1 | 93 | 14 | 109 |
| 2X | 0.0076 | 108 | 1.2 | 103 | 15 | 104 | |
| 3X | 0.0076 | 108 | 1.1 | 97 | 13 | 116 | |
| Cystatin C | 0 | 1,240 | 100 | 1,330 | 100 | 519 | 100 |
| (ng/mL) | 1X | 1,280 | 103 | 1,470 | 111 | 584 | 113 |
| 2X | 1,410 | 114 | 1,370 | 103 | 730 | 141 | |
| 3X | 1,420 | 115 | 1,380 | 104 | 589 | 113 | |
| NGAL | 0 | 45 | 100 | 245 | 100 | 84 | 100 |
| (ng/mL) | 1X | 46 | 102 | 179 | 114 | 94 | 112 |
| 2X | 47 | 104 | 276 | 113 | 91 | 108 | |
| 3X | 47 | 104 | 278 | 113 | 91 | 109 | |
| Osteopontin | 0 | 38 | 100 | 1.7 | 100 | 5.0 | 100 |
| (ng/mL) | 1X | 42 | 110 | 1.8 | 102 | 5.5 | 110 |
| 2X | 42 | 108 | 1.5 | 87 | 5.5 | 109 | |
| 3X | 42 | 110 | 1.3 | 77 | 5.4 | 107 | |
| TIMP-1 | 0 | 266 | 100 | 220 | 100 | 70 | 100 |
| (ng/mL) | 1X | 265 | 100 | 220 | 10 | 75 | 108 |
| 2X | 255 | 96 | 215 | 98 | 77 | 110 | |
| 3X | 295 | 111 | 228 | 104 | 76 | 109 | |
| A-1M | 0 | 14 | 100 | 26 | 100 | 4.5 | 100 |
| (μg/mL) | 1X | 13 | 92 | 25 | 96 | 4.2 | 94 |
| 2X | 15 | 107 | 25 | 96 | 4.3 | 97 | |
| 3X | 16 | 116 | 23 | 88 | 4.0 | 90 | |
| THP | 0 | 4.6 | 100 | 31 | 100 | 9.2 | 100 |
| (μg/mL) | 1X | 4.4 | 96 | 31 | 98 | 8.8 | 95 |
| 2X | 5.0 | 110 | 31 | 100 | 9.2 | 100 | |
| 3X | 5.2 | 114 | 27 | 85 | 9.1 | 99 | |
| TFF-3 | 0 | 4.6 | 100 | 24 | 100 | 22 | 100 |
| (μg/mL) | 1X | 4.4 | 96 | 23 | 98 | 22 | 103 |
| 2X | 5.0 | 110 | 24 | 103 | 22 | 101 | |
| 3X | 5.2 | 114 | 19 | 82 | 22 | 102 | |
The results of the short-term stability assessment are summarized in Table 8. The % recovery of each analyte was calculated as a percentage of the analyte measured in the sample prior to any short-term storage.
| TABLE 8 |
| Short-Term Stability of Analytes in Urine, Serum, and Plasma |
| Storage | Urine Sample | Serum Sample | Plasma Sample |
| Time/ | Sample | Recovery | Sample | Recovery | Sample | Recovery | |
| Analyte | Temp | Conc. | (%) | Conc. | (%) | Conc. | (%) |
| Calbindin | Control | 226 | 100 | 33 | 100 | 7 | 100 |
| (ng/mL) | 2 hr/ | 242 | 107 | 30 | 90 | 6.3 | 90 |
| room | |||||||
| temp | |||||||
| 2 hr. @ | 228 | 101 | 29 | 89 | 6.5 | 93 | |
| 4° C. | |||||||
| 4 hr @ | 240 | 106 | 28 | 84 | 5.6 | 79 | |
| room | |||||||
| temp | |||||||
| 4 hr. @ | 202 | 89 | 29 | 86 | 5.5 | 79 | |
| 4° C. | |||||||
| 24 hr. @ | 199 | 88 | 26 | 78 | 7.1 | 101 | |
| 4° C. | |||||||
| Clusterin | Control | 185 | 100 | 224 | 100 | 171 | 100 |
| (ng/mL) | 2 hr @ | 173 | 94 | 237 | 106 | 180 | 105 |
| room | |||||||
| temp | |||||||
| 2 hr. @ | 146 | 79 | 225 | 100 | 171 | 100 | |
| 4° C. | |||||||
| 4 hr @ | 166 | 89 | 214 | 96 | 160 | 94 | |
| room | |||||||
| temp | |||||||
| 4 hr. @ | 157 | 85 | 198 | 88 | 143 | 84 | |
| 4° C. | |||||||
| 24 hr. @ | 185 | 100 | 207 | 92 | 162 | 94 | |
| 4° C. | |||||||
| CTGF | Control | 1.9 | 100 | 8.8 | 100 | 1.2 | 100 |
| (ng/mL) | 2 hr @ | 1.9 | 99 | 6.7 | 76 | 1 | 83 |
| room | |||||||
| temp | |||||||
| 2 hr. @ | 1.8 | 96 | 8.1 | 92 | 1.1 | 89 | |
| 4° C. | |||||||
| 4 hr @ | 2.1 | 113 | 5.6 | 64 | 1 | 84 | |
| room | |||||||
| temp | |||||||
| 4 hr. @ | 1.7 | 91 | 6.4 | 74 | 0.9 | 78 | |
| 4° C. | |||||||
| 24 hr. @ | 2.2 | 116 | 5.9 | 68 | 1.1 | 89 | |
| 4° C. | |||||||
| GST- | Control | 14 | 100 | 21 | 100 | 11 | 100 |
| alpha | 2 hr @ | 11 | 75 | 23 | 107 | 11 | 103 |
| (ng/mL) | room | ||||||
| temp | |||||||
| 2 hr. @ | 13 | 93 | 22 | 104 | 9.4 | 90 | |
| 4° C. | |||||||
| 4 hr @ | 11 | 79 | 21 | 100 | 11 | 109 | |
| room | |||||||
| temp | |||||||
| 4 hr. @ | 12 | 89 | 21 | 98 | 11 | 100 | |
| 4° C. | |||||||
| 24 hr. @ | 13 | 90 | 22 | 103 | 14 | 129 | |
| 4° C. | |||||||
| KIM-1 | Control | 1.5 | 100 | 0.23 | 100 | 0.24 | 100 |
| (ng/mL) | 2 hr @ | 1.2 | 78 | 0.2 | 86 | 0.22 | 90 |
| room | |||||||
| temp | |||||||
| 2 hr. @ | 1.6 | 106 | 0.23 | 98 | 0.21 | 85 | |
| 4° C. | |||||||
| 4 hr @ | 1.3 | 84 | 0.19 | 82 | 0.2 | 81 | |
| room | |||||||
| temp | |||||||
| 4 hr. @ | 1.4 | 90 | 0.22 | 93 | 0.19 | 80 | |
| 4° C. | |||||||
| 24 hr. @ | 1.1 | 76 | 0.18 | 76 | 0.23 | 94 | |
| 4° C. | |||||||
| VEGF | Control | 851 | 100 | 1215 | 100 | 670 | 100 |
| (pg/mL) | 2 hr @ | 793 | 93 | 1055 | 87 | 622 | 93 |
| room | |||||||
| temp | |||||||
| 2 hr. @ | 700 | 82 | 1065 | 88 | 629 | 94 | |
| 4° C. | |||||||
| 4 hr @ | 704 | 83 | 1007 | 83 | 566 | 84 | |
| room | |||||||
| temp | |||||||
| 4 hr. @ | 618 | 73 | 1135 | 93 | 544 | 81 | |
| 4° C. | |||||||
| 24 hr. @ | 653 | 77 | 1130 | 93 | 589 | 88 | |
| 4° C. | |||||||
| β-2M | Control | 0.064 | 100 | 2.6 | 100 | 1.2 | 100 |
| (μg/mL) | 2 hr @ | 0.062 | 97 | 2.4 | 92 | 1.1 | 93 |
| room | |||||||
| temp | |||||||
| 2 hr. @ | 0.058 | 91 | 2.2 | 85 | 1.2 | 94 | |
| 4° C. | |||||||
| 4 hr @ | 0.064 | 101 | 2.2 | 83 | 1.2 | 94 | |
| room | |||||||
| temp | |||||||
| 4 hr. @ | 0.057 | 90 | 2.2 | 85 | 1.2 | 98 | |
| 4° C. | |||||||
| 24 hr. @ | 0.06 | 94 | 2.5 | 97 | 1.3 | 103 | |
| 4° C. | |||||||
| Cystatin C | Control | 52 | 100 | 819 | 100 | 476 | 100 |
| (ng/mL) | 2 hr @ | 50 | 96 | 837 | 102 | 466 | 98 |
| room | |||||||
| temp | |||||||
| 2 hr. @ | 44 | 84 | 884 | 108 | 547 | 115 | |
| 4° C. | |||||||
| 4 hr @ | 49 | 93 | 829 | 101 | 498 | 105 | |
| room | |||||||
| temp | |||||||
| 4 hr. @ | 46 | 88 | 883 | 108 | 513 | 108 | |
| 4° C. | |||||||
| 24 hr. @ | 51 | 97 | 767 | 94 | 471 | 99 | |
| 4° C. | |||||||
| NGAL | Control | 857 | 100 | 302 | 100 | 93 | 100 |
| (ng/mL) | 2 hr @ | 888 | 104 | 287 | 95 | 96 | 104 |
| room | |||||||
| temp | |||||||
| 2 hr. @ | 923 | 108 | 275 | 91 | 92 | 100 | |
| 4° C. | |||||||
| 4 hr @ | 861 | 101 | 269 | 89 | 88 | 95 | |
| room | |||||||
| temp | |||||||
| 4 hr. @ | 842 | 98 | 283 | 94 | 94 | 101 | |
| 4° C. | |||||||
| 24 hr. @ | 960 | 112 | 245 | 81 | 88 | 95 | |
| 4° C. | |||||||
| Osteopontin | Control | 2243 | 100 | 6.4 | 100 | 5.2 | 100 |
| (ng/mL) | 2 hr @ | 2240 | 100 | 6.8 | 107 | 5.9 | 114 |
| room | |||||||
| temp | |||||||
| 2 hr. @ | 2140 | 95 | 6.4 | 101 | 6.2 | 120 | |
| 4° C. | |||||||
| 4 hr @ | 2227 | 99 | 6.9 | 108 | 5.8 | 111 | |
| room | |||||||
| temp | |||||||
| 4 hr. @ | 2120 | 95 | 7.7 | 120 | 5.2 | 101 | |
| 4° C. | |||||||
| 24 hr. @ | 2253 | 100 | 6.5 | 101 | 6 | 116 | |
| 4° C. | |||||||
| TIMP-1 | Control | 17 | 100 | 349 | 100 | 72 | 100 |
| (ng/mL) | 2 hr @ | 17 | 98 | 311 | 89 | 70 | 98 |
| room | |||||||
| temp | |||||||
| 2 hr. @ | 16 | 94 | 311 | 89 | 68 | 95 | |
| 4° C. | |||||||
| 4 hr @ | 17 | 97 | 306 | 88 | 68 | 95 | |
| room | |||||||
| temp | |||||||
| 4 hr. @ | 16 | 93 | 329 | 94 | 74 | 103 | |
| 4° C. | |||||||
| 24 hr. @ | 18 | 105 | 349 | 100 | 72 | 100 | |
| 4° C. | |||||||
| A-1M | Control | 3.6 | 100 | 2.2 | 100 | 1 | 100 |
| (μg/mL) | 2 hr @ | 3.5 | 95 | 2 | 92 | 1 | 105 |
| room | |||||||
| temp | |||||||
| 2 hr. @ | 3.4 | 92 | 2.1 | 97 | 0.99 | 99 | |
| 4° C. | |||||||
| 4 hr @ | 3.2 | 88 | 2.2 | 101 | 0.99 | 96 | |
| room | |||||||
| temp | |||||||
| 4 hr. @ | 3 | 82 | 2.2 | 99 | 0.97 | 98 | |
| 4° C. | |||||||
| 24 hr. @ | 3 | 83 | 2.2 | 100 | 1 | 101 | |
| 4° C. | |||||||
| THP | Control | 1.2 | 100 | 34 | 100 | 2.1 | 100 |
| (μg/mL) | 2 hr @ | 1.2 | 99 | 34 | 99 | 2 | 99 |
| room | |||||||
| temp | |||||||
| 2 hr. @ | 1.1 | 90 | 34 | 100 | 2 | 98 | |
| 4° C. | |||||||
| 4 hr @ | 1.1 | 88 | 27 | 80 | 2 | 99 | |
| room | |||||||
| temp | |||||||
| 4 hr. @ | 0.95 | 79 | 33 | 97 | 2 | 95 | |
| 4° C. | |||||||
| 24 hr. @ | 0.91 | 76 | 33 | 98 | 2.4 | 116 | |
| 4° C. | |||||||
| TFF-3 | Control | 1230 | 100 | 188 | 100 | 2240 | 100 |
| (μg/mL) | 2 hr @ | 1215 | 99 | 179 | 95 | 2200 | 98 |
| room | |||||||
| temp | |||||||
| 2 hr. @ | 1200 | 98 | 195 | 104 | 2263 | 101 | |
| 4° C. | |||||||
| 4 hr @ | 1160 | 94 | 224 | 119 | 2097 | 94 | |
| room | |||||||
| temp | |||||||
| 4 hr. @ | 1020 | 83 | 199 | 106 | 2317 | 103 | |
| 4° C. | |||||||
| 24 hr. @ | 1030 | 84 | 229 | 122 | 1940 | 87 | |
| 4° C. | |||||||
The results of this experiment demonstrated that the analytes associated with renal disorders tested were suitably stable over several freeze/thaw cycles, and up to 24 hrs. of storage at a temperature of 4° C.
Example 8
Diagnosis of Renal Damage Using Detection of Analytes in Human Urine Samples
To assess the effectiveness of a human kidney toxicity panel to detect renal damage due to disease states, the following experiment was conducted. Urine samples were obtained from healthy control patients (n=5), renal cancer patients (n=4) and “other” cancer patients (n=8) afflicted with lung cancer, pancreatic cancer, liver cancer, or colon cancer. All urine samples were diluted as described in Example 4 and subjected to a sandwich-capture assay as described in Example 1. Urine concentrations of analytes included in a human kidney toxicity panel were measured by the assay, including alpha-1 microglobulin (A1M), beta-2 microglobulin (B2M), calbindin, clusterin, CTGF, cystatin C, GST-alpha, KIM-1, NGAL, osteopontin (OPN), THP, TIMP-1, TFF-3, and VEGF.
FIG. 1 summarizes the urine concentrations of those analytes that differed significantly from control urine concentrations. The urine concentrations of A1M, NGAL, and THP were slightly elevated for the renal cancer patient group and more significantly elevated for the “other” cancer patient group. Urine B2M concentrations appeared to be elevated for both the renal cancer and “other” cancer patient groups, although the BRM concentrations exhibited more variability than the other analyte concentrations shown in FIG. 1.
The results of this experiment demonstrated that panels of analytes detected in urine samples were capable of identifying patients having renal damage resulting from renal cancer and other cancers.
Example 9
Analysis of Kidney Biomarkers in Plasma and Urine from Patients with Renal Injury
A screen for potential protein biomarkers in relation to kidney toxicity/damage was performed using a panel of biomarkers, in a set of urine and plasma samples from patients with documented renal damage. The investigated patient groups included diabetic nephropathy (DN), obstructive uropathy (OU), analgesic abuse (AA) and glomerulonephritis (GN) along with age, gender and BMI matched control groups. Multiplexed immunoassays were applied in order to quantify the following protein analytes: Alpha-1 Microglobulin (α1M), KIM-1, Microalbumin, Beta-2-Microglobulin (β32M), Calbindin, Clusterin, CystatinC, TreFoilFactor-3 (TFF-3), CTGF, GST-alpha, VEGF, Calbindin, Osteopontin, Tamm-HorsfallProtein (THP), TIMP-1 and NGAL.
Li-Heparin plasma and mid-stream spot urine samples were collected from four different patient groups. Samples were also collected from age, gender and BMI matched control subjects. 20 subjects were included in each group resulting in a total number of 160 urine and plasma samples. All samples were stored at −80° C. before use. Glomerular filtration rate for all samples was estimated using two different estimations (Modification of Diet in Renal Disease or MDRD, and the Chronic Kidney Disease Epidemiology Collaboration or CKD-EPI) to outline the eGFR (estimated glomerular filtration rate) distribution within each patient group (FIG. 2). Protein analytes were quantified in human plasma and urine using multiplexed immunoassays in the Luminex xMAP™ platform. The microsphere-based multiplex immunoassays consist of antigen-specific antibodies and optimized reagents in a capture-sandwich format. Output data was given as g/ml calculated from internal standard curves. Because urine creatinine (uCr) correlates with renal filtration rate, data analysis was performed without correction for uCr. Univariate and multivariate data analysis was performed comparing all case vs. control samples as well as cases vs. control samples for the various disease groups.
The majority of the measured proteins showed a correlation to eGFR. Measured variables were correlated to eGFR using Pearson's correlations coefficient, and samples from healthy controls and all disease groups were included in the analysis. 11 and 7 proteins displayed P-values below 0.05 for plasma and urine (Table 9) respectively.
| TABLE 9 |
| Correlation analysis of eGFR and variables for all case samples |
| URINE | PLASMA |
| Variable | Pearson's r | P-Value | Variable | Pearson's r | P-Value |
| Alpha-1- | −0.08 | 0.3 | Alpha-1- | −0.33 | |
| Microglobulin | Microglobulin | ||||
| Beta-2- | −0.23 | 0.003 | Beta-2- | −0.39 | |
| Microglobulin | Microglobulin | ||||
| Calbindin | −0.16 | 0.04 | Calbindin | −0.18 | <0.02 |
| Clusterin | −0.07 | 0.4 | Clusterin | −0.51 | |
| CTGF | −0.08 | 0.3 | CTGF | −0.05 | 0.5 |
| Creatinine | −0.32 | Cystatin-C | −0.42 | <0.0001 | |
| Cystatin-C | −0.24 | 0.002 | GST-alpha | −0.12 | 0.1 |
| GST-alpha | −0.11 | 0.2 | KIM-1 | −0.17 | 0.03 |
| KIM-1 | −0.08 | 0.3 | NGAL | −0.28 | <0.001 |
| Microalbumin_UR | −0.17 | 0.03 | Osteopontin | −0.33 | |
| NGAL | −0.15 | 0.07 | THP | −0.31 | |
| Osteopontin | −0.19 | 0.02 | TIMP-1 | −0.28 | <0.001 |
| THP | −0.05 | 0.6 | TFF3 | −0.38 | |
| TIMP-1 | −0.19 | 0.01 | VEGF | −0.14 | 0.08 |
| TFF2 | −0.09 | 0.3 | |||
| VEGF | −0.07 | 0.4 | |||
| P values <0.0001 are shown in bold italics | |||||
| P values <0.005 are shown in bold | |||||
| P values <0.05 are shown in italics |
For the various disease groups, univariate statistical analysis revealed that in a direct comparison (T-test) between cases and controls, a number of proteins were differentially expressed in both urine and plasma (Table 10 and FIG. 3). In particular, clusterin showed a marked differential pattern in plasma.
| TABLE 10 |
| Differentially regulated proteins by |
| univariate statistical analysis |
| Group | Matrix | Protein | p-value | |
| AA | Urine | Calbindin | 0.016 | |
| AA | Urine | NGAL | 0.04 | |
| AA | Urine | Osteopontin | 0.005 | |
| AA | Urine | Creatinine | 0.001 | |
| AA | Plasma | Calbindin | 0.05 | |
| AA | Plasma | Clusterin | 0.003 | |
| AA | Plasma | KIM-1 | 0.03 | |
| AA | Plasma | THP | 0.001 | |
| AA | Plasma | TIMP-1 | 0.02 | |
| DN | Urine | Creatinine | 0.04 | |
| DN | Plasma | Clusterin | 0.006 | |
| DN | Plasma | KIM-1 | 0.01 | |
| GN | Urine | Creatinine | 0.004 | |
| GN | Urine | Microalbumin | 0.0003 | |
| GN | Urine | NGAL | 0.05 | |
| GN | Urine | Osteopontin | 0.05 | |
| GN | Urine | TFF3 | 0.03 | |
| GN | Plasma | Alpha 1 Microglobulin | 0.002 | |
| GN | Plasma | Beta 2 Microglobulin | 0.03 | |
| GN | Plasma | Clusterin | 0.00 | |
| GN | Plasma | Cystatin C | 0.01 | |
| GN | Plasma | KIM-1 | 0.003 | |
| GN | Plasma | NGAL | 0.03 | |
| GN | Plasma | THP | 0.001 | |
| GN | Plasma | TIMP-1 | 0.003 | |
| GN | Plasma | TFF3 | 0.01 | |
| GN | Plasma | VEGF | 0.02 | |
| OU | Urine | Clusterin | 0.02 | |
| OU | Urine | Microalbumin | 0.007 | |
| OU | Plasma | Clusterin | 0.00 | |
Application of multivariate analysis yielded statistical models that predicted disease from control samples (plasma results are shown in FIG. 4).
In conclusion, these results form a valuable base for further studies on these biomarkers in urine and plasma both regarding baseline levels in normal populations and regarding the differential expression of the analytes in various disease groups. Using this panel of analytes, error rates from adaboosting and/or random forest were low enough (<10%) to allow a prediction model to differentiate between control and disease patient samples. Several of the analytes showed a greater correlation to eGFR in plasma than in urine.
Example 10
Statistical Analysis of Kidney Biomarkers in Plasma and Urine from Patients with Renal Injury
Urine and plasma samples were taken from 80 normal control group subjects and 20 subjects from each of four disorders: analgesic abuse, diabetic nephropathy, glomerulonephritis, and obstructive uropathy. The samples were analyzed for the quantity and presence of 16 different proteins (alpha-1 microglobulin (α1M), beta-2 microglobulin (β2M), calbindin, clusterin, CTGF, creatinine, cystatin C, GST-alpha, KIM-1, microalbumin, NGAL, osteopontin, THP, TIMP-1, TFF-3, and VEGF) as described in Example 1 above. The goal was to determine the analytes that distinguish between a normal sample and a diseased sample, a normal sample and an obstructive uropathy (OU) sample, and finally, an glomerulonephritis sample from the other disease samples (diabetic nephropathy (DN), analgesic abuse (AA), and glomerulonephritis (GN)).
From the above protein analysis data, bootstrap analysis was used to estimate the future performance of several classification algorithms. For each bootstrap run, training data and testing data was randomly generated. Then, the following algorithms were applied on the training data to generate models and then apply the models to the testing data to make predictions: automated Matthew's classification algorithm, classification and regression tree (CART), conditional inference tree, bagging, random forest, boosting, logistic regression, SVM, and Lasso. The accuracy rate and ROC areas were recorded for each method on the prediction of the testing data. The above was repeated 100 times. The mean and the standard deviation of the accuracy rates and of the ROC areas were calculated.
The mean error rates and AUROC were calculated from urine and AUROC was calculated from plasma for 100 runs of the above method for each of the following comparisons: disease (AA+GN+OU+DN) vs. normal (FIG. 5, Table 11), AA vs. normal (FIG. 7, Table 13), DN vs. AA (FIG. 9, Table 15, AA vs. GN (FIG. 11, Table 17), and AA vs. OU (FIG. 13, Table 19).
The average relative importance of 16 different analytes (alpha-1 microglobulin, beta-2 microglobulin, calbindin, clusterin, CTGF, creatinine, cystatin C, GST-alpha, KIM-1, microalbumin, NGAL, osteopontin, THP, TIMP-1, TFF-3, and VEGF) and 4 different clinical variables (weight, BMI, age, and gender) from 100 runs were analyzed with two different statistical methods—random forest (plasma and urine samples) and boosting (urine samples)—for each of the following comparisons: disease (AA+GN+OU+DN) vs. normal (FIG. 6, Table 12), AA vs. normal (FIG. 8, Table 14), DN vs. AA (FIG. 10, Table 16), AA vs. GN (FIG. 12, Table 18), and AA vs. OU (FIG. 14, Table 20).
| TABLE 11 |
| Disease v. Normal |
| Standard | |||
| Mean | deviation | ||
| method | AUROC | AUROC | |
| random | 0.931 | 0.039 | |
| forest | |||
| bagging | 0.919 | 0.045 | |
| svm | 0.915 | 0.032 | |
| boosting | 0.911 | 0.06 | |
| lasso | 0.897 | 0.044 | |
| logistic | 0.891 | 0.041 | |
| regression | |||
| ctree | 0.847 | 0.046 | |
| cart | 0.842 | 0.032 | |
| matt | 0.83 | 0.023 | |
| TABLE 12 |
| Disease v. Normal |
| relative | ||
| analyte | importance | |
| Creatinine | 11.606 | |
| Kidney_Injury_M | 8.486 | |
| Tamm_Horsfall_P | 8.191 | |
| Total_Protein | 6.928 | |
| Osteopontin | 6.798 | |
| Neutrophil_Gela | 6.784 | |
| Tissue_Inhibito | 6.765 | |
| Vascular_Endoth | 6.716 | |
| Trefoil_Factor— | 6.703 | |
| Cystatin_C | 6.482 | |
| Alpha_1_Microgl | 6.418 | |
| Beta_2_Microglo | 6.228 | |
| Glutathione_S_T | 6.053 | |
| clusterin | 5.842 | |
| TABLE 13 |
| AA v. NL |
| Standard | |||
| deviation | |||
| Mean | of | ||
| method | AUROC | AUROC | |
| cart | 1 | 0 | |
| bagging | 1 | 0 | |
| boosting | 1 | 0 | |
| lasso | 0.998 | 0.008 | |
| ctree | 0.998 | 0.015 | |
| random | 0.997 | 0.012 | |
| forest | |||
| svm | 0.977 | 0.033 | |
| logistic | 0.933 | 0.092 | |
| regression | |||
| matt | 0.873 | 0.112 | |
| TABLE 14 |
| AA v. NL |
| Relative | ||
| analyte | importance | |
| Creatinine | 17.800 | |
| Tissue_Inhibito | 9.953 | |
| Total_Protein | 8.837 | |
| Tamm_Horsfall_P | 7.379 | |
| Cystatin_C | 6.237 | |
| Kidney_Injury_M | 6.174 | |
| Beta_2_Microglo | 5.915 | |
| Neutrophil_Gela | 5.761 | |
| Alpha_1_Microgl | 5.742 | |
| Trefoil_Factor— | 5.736 | |
| Osteopontin | 5.561 | |
| Vascular_Endoth | 5.338 | |
| clusterin | 4.892 | |
| Glutathione_S_T | 4.675 | |
| TABLE 15 |
| AA v. DN |
| Standard | |||
| Mean | deviation | ||
| method | AUROC | AUROC | |
| lasso | 0.999 | 0.008 | |
| random | 0.989 | 0.021 | |
| forest | |||
| svm | 0.988 | 0.039 | |
| boosting | 0.988 | 0.022 | |
| bagging | 0.972 | 0.036 | |
| logistic | 0.969 | 0.057 | |
| regression | |||
| cart | 0.93 | 0.055 | |
| ctree | 0.929 | 0.063 | |
| matt | 0.862 | 0.12 | |
| TABLE 16 |
| AA v. DN |
| Relative | ||
| analyte | importance | |
| Creatinine | 17.57 | |
| Total_Protein | 10.90 | |
| Tissue_Inhibito | 8.77 | |
| clusterin | 6.89 | |
| Glutathione_S_T | 6.24 | |
| Alpha_1_Microgl | 6.15 | |
| Beta_2_Microglo | 6.06 | |
| Cystatin_C | 5.99 | |
| Trefoil_Factor— | 5.88 | |
| Kidney_Injury_M | 5.49 | |
| Vascular_Endoth | 5.38 | |
| Tamm_Horsfall_P | 5.33 | |
| Osteopontin | 4.86 | |
| Neutrophil_Gela | 4.47 | |
| TABLE 17 |
| AA v. GN |
| Standard | |||
| deviation | |||
| Mean | of | ||
| method | AUROC | AUROC | |
| svm | 0.689 | 0.11 | |
| boosting | 0.675 | 0.102 | |
| bagging | 0.674 | 0.106 | |
| random | 0.66 | 0.096 | |
| forest | |||
| matt | 0.631 | 0.085 | |
| cart | 0.626 | 0.089 | |
| logistic | 0.614 | 0.091 | |
| regression | |||
| lasso | 0.606 | 0.102 | |
| ctree | 0.53 | 0.061 | |
| TABLE 18 |
| AA v. GN |
| Relative | ||
| analyte | importance | |
| Creatinine | 10.780 | |
| Alpha_1_Microgl | 8.847 | |
| Kidney_Injury_M | 8.604 | |
| clusterin | 8.109 | |
| Total_Protein | 7.679 | |
| Glutathione_S_T | 7.493 | |
| Neutrophil_Gela | 6.721 | |
| Vascular_Endoth | 6.461 | |
| Cystatin_C | 6.444 | |
| Beta_2_Microglo | 6.261 | |
| Trefoil_Factor— | 6.184 | |
| Tamm_Horsfall_P | 5.872 | |
| Tissue_Inhibito | 5.690 | |
| Osteopontin | 4.855 | |
| TABLE 19 |
| AA v. OU |
| Standard | |||
| deviation | |||
| Mean | of | ||
| method | AUROC | AUROC | |
| random | 0.814 | 0.11 | |
| forest | |||
| bagging | 0.792 | 0.115 | |
| svm | 0.788 | 0.112 | |
| lasso | 0.786 | 0.118 | |
| boosting | 0.757 | 0.117 | |
| matt | 0.687 | 0.111 | |
| logistic | 0.683 | 0.116 | |
| regression | |||
| cart | 0.665 | 0.097 | |
| ctree | 0.659 | 0.118 | |
| TABLE 20 |
| AA v. OU |
| Relative | ||
| analyte | importance | |
| Total_Protein | 11.502 | |
| Tissue_Inhibito | 9.736 | |
| Cystatin_C | 9.161 | |
| Alpha_1_Microgl | 8.637 | |
| Trefoil_Factor— | 7.329 | |
| Osteopontin | 7.326 | |
| Beta_2_Microglo | 6.978 | |
| Neutrophil_Gela | 6.577 | |
| Glutathione_S_T | 6.100 | |
| Tamm_Horsfall_P | 6.066 | |
| Kidney_Injury_M | 6.038 | |
| Vascular_Endoth | 5.946 | |
| clusterin | 4.751 | |
| Creatinine | 3.854 | |
It should be appreciated by those of skill in the art that the techniques disclosed in the examples above represent techniques discovered by the inventors to function well in the practice of the invention. Those of skill in the art should, however, in light of the present disclosure, appreciate that many changes can be made in the specific embodiments that are disclosed and still obtain a like or similar result without departing from the spirit and scope of the invention, therefore all matter set forth or shown in the accompanying drawings is to be interpreted as illustrative and not in a limiting sense.
Claims
What is claimed is:1. An assay device for diagnosing, monitoring, or determining a renal disorder in a mammal, the device comprising a panel of biomarkers for diagnosing, monitoring, or determining a renal disorder comprising six antibodies immobilized on a contact surface, wherein the antigenic determinants of the antibodies are analytes associated with renal disorder, wherein the analytes are selected from the group consisting of alpha-1 microglobulin, beta-2 microglobulin, cystatin C, KIM-1, THP, and TIMP-1.
2. An assay device for diagnosing, monitoring, or determining a renal disorder in a mammal, the device comprising a panel of biomarkers for diagnosing, monitoring, or determining a renal disorder comprising three or more antibodies immobilized on a contact surface, wherein the antigenic determinants of the antibodies are analytes associated with renal disorder, wherein the analytes are selected from the group consisting of alpha-1 microglobulin, beta-2 microglobulin, calbindin, clusterin, CTGF, creatinine, cystatin C, GST-alpha, KIM-1, microalbumin, NGAL, osteopontin, THP, TIMP-1, TFF-3, VEGF, BLC, CD40, IGF BP2, MMP3, peptide YY, stem cell factor, TNF RII, AXL, Eotaxin 3, FABP, FGF basic, myoglobin, resistin, TRAIL R3, endothelin 1, NrCAM, Tenascin C, VCAM1, and cortisol.
3. The assay device of claim 2, wherein the three or more antibodies have antigenic determinants for analytes selected from the group consisting of alpha-1 microglobulin, beta-2 microglobulin, cystatin C, KIM-1, THP, and TIMP-1.
4. The assay device of claim 2, wherein the renal disorder comprises obstructive uropathy, and wherein the three or more antibodies have antigenic determinants for analytes selected from the group consisting of creatinine, THP, A1M, clusterin, NGAL, and osteopontin.
5. The assay device of claim 2, wherein the renal disorder comprises obstructive uropathy, wherein the panel of biomarkers has six antibodies having antigenic determinants for analytes selected from the group consisting of creatinine, THP, alpha-1 microglobulin, clusterin, NGAL, and osteopontin.
6. The assay device of claim 2, wherein the renal disorder comprises glomerulonephritis, and wherein the three or more antibodies have antigenic determinants for analytes selected from the group consisting of creatinine, KIM-1, TIMP-1, alpha-1 microglobulin, THP, and osteopontin.
7. The assay device of claim 2, wherein the renal disorder comprises glomerulonephritis, and wherein the panel of biomarkers has six antibodies having antigenic determinants for analytes selected from the group consisting of creatinine, KIM-1, TIMP-1, alpha-1 microglobulin, THP, and osteopontin.
8. The assay device of claim 2, wherein the renal disorder comprises kidney toxicity, and wherein the three or more antibodies have antigenic determinants for analytes selected from the group consisting of creatinine, KIM-1, THP, osteopontin, NGAL, and TIMP-1.
9. The assay device of claim 2, wherein the renal disorder comprises kidney toxicity, and wherein the panel of biomarkers has six antibodies having antigenic determinants for analytes selected from the group consisting of creatinine, KIM-1, THP, osteopontin, NGAL, and TIMP-1.
10. The assay device of claim 2, wherein the renal disorder comprises diabetic nephropathy, and wherein the three or more antibodies have antigenic determinants for analytes selected from the group consisting of microalbumin, alpha-1 microglobulin, NGAL, KIM-1, THP, and clusterin.
11. The assay device of claim 2, wherein the renal disorder comprises diabetic nephropathy, and wherein the panel of biomarkers has six antibodies having antigenic determinants for analytes selected from the group consisting of microalbumin, alpha-1 microglobulin, NGAL, KIM-1, THP, and clusterin.
12. The assay device of claim 2, wherein the renal disorder comprises kidney transplant rejection and chronic allograft nephropathy, and wherein the panel comprises three or more antibodies having antigenic determinants for analytes selected from the group consisting of BLC, CD40, IGF BP2, MMP3, peptide YY, stem cell factor, TNF RII, AXL, Eotaxin 3, FABP, FGF basic, myoglobin, resistin, TRAIL R3, endothelin 1, NrCAM, Tenascin C, VCAM1, and cortisol.
13. The assay device of claim 2, wherein the panel of biomarkers comprises ten or more antibodies having antigenic determinants for analytes selected from the group consisting of alpha-1 microglobulin, beta-2 microglobulin, calbindin, clusterin, CTGF, creatinine, cystatin C, GST-alpha, KIM-1, microalbumin, NGAL, osteopontin, THP, TIMP-1, TFF-3, and VEGF.
14. The assay device of claim 2, wherein the panel of biomarkers has sixteen antibodies having antigenic determinants for the analytes comprising alpha-1 microglobulin, beta-2 microglobulin, calbindin, clusterin, CTGF, creatinine, cystatin C, GST-alpha, KIM-1, microalbumin, NGAL, osteopontin, THP, TIMP-1, TFF-3, and VEGF.
15. The assay device of claim 2, wherein the contact surface comprises a substrate capable of immobilizing analytes captured by the antibodies.
16. The assay device of claim 15, wherein the substrate comprises a porous material selected from the group consisting of paper, nitrocellulose, cellulose, glass, glass fiber mesh, silica gel, synthetic resins, plastic strips, beads, the inner surface of a well, the surface of a microtitration tray, and combinations thereof.
17. The assay device of claim 2, further comprising a plurality of indicators, wherein one of the plurality of indicators is attached to one of the three or more antibodies
18. The assay device of claim 2, wherein the plurality of indicators comprises visual indicators and electrochemical indicators.
19. The assay device of claim 18, wherein the visual indicators are selected from the group consisting of nanoparticulate gold, polyurethane microspheres loaded with dye compounds, latex microspheres loaded with dye compounds, carbon black, fluorophores, phycoerythrin, radioactive isotopes, nanoparticles, and enzymes such as horseradish peroxidase or alkaline phosphatase that react with a chemical substrate to form a colored product.
20. The assay device of claim 18, wherein the electrochemical indicators are selected from the group consisting of ascorbate, vitamin E, glutathione, polyphenols, catechols, quercetin, phytoestrogens, penicillin, carbazole, murranes, phenols, carbonyls, benzoates, and trace metal ions such as nickel, copper, cadmium, iron, and mercury.
21. The assay device of claim 2, wherein the assay method comprises electrophoresis, mass spectrometry, protein microarrays, western blot, immunohistochemical staining, enzyme-linked immunosorbent assay methods, and particle-based capture-sandwich immunoassays.
22. The assay device of claim 2, wherein the renal disorder comprises glomerulonephritis, interstitial nephritis, tubular damage, vasculitis, glomerulosclerosis, acute renal failure, chronic renal failure, nephrosis, nephropathy, polycystic kidney disease, Bright's disease, renal transplant, chronic unilateral obstructive uropathy, chronic bilateral obstructive uropathy, acute unilateral obstructive uropathy, and acute bilateral obstructive uropathy.
23. The assay device of claim 2, wherein the renal disorder comprises renal damage caused by exposure to secondary agents and conditions including therapeutic drugs, recreational drugs, contrast agents, toxins, nephrolithiasis, ischemia, liver transplantation, heart transplantation, lung transplantation, and hypovolemia.
24. The assay device of claim 2, wherein the renal disorder comprises renal damage secondary to a primary disease state including diabetes, hypertension, autoimmune diseases including lupus, Wegener's granulomatosis, and Goodpasture syndrome, primary hyperoxaluria, kidney transplant rejection, sepsis, nephritis secondary to infection of the kidney, rhabdomyolysis, multiple myeloma, and prostate diseases.
25. The assay device of claim 2, wherein the mammal is selected from the group consisting of humans, apes, monkeys, rats, mice, dogs, cats, pigs, and livestock including cattle and oxen.
26. An assay device for diagnosing, monitoring, or determining a renal disorder in a mammal, the device comprising:
a. three or more capture antibodies, wherein the antigenic determinants of the capture antibodies are analytes associated with a renal disorder, wherein the analytes are selected from the group consisting of alpha-1 microglobulin, beta-2 microglobulin, calbindin, clusterin, CTGF, creatinine, cystatin C, GST-alpha, KIM-1, microalbumin, NGAL, osteopontin, THP, TIMP-1, TFF-3, VEGF, BLC, CD40, IGF BP2, MMP3, peptide YY, stem cell factor, TNF RII, AXL, Eotaxin 3, FABP, FGF basic, myoglobin, resistin, TRAIL R3, endothelin 1, NrCAM, Tenascin C, VCAM1, and cortisol;
b. three or more capture agents comprising an antigenic moiety, wherein one of the capture agents is attached to each of the capture antibodies;
c. three or more detection antibodies, wherein the antigenic determinant of the detection antibodies is the antigenic moiety; and
d. three or more indicators, wherein each of the indicators is attached to one of the detection antibodies.
27. The assay device of claim 26, wherein the three or more capture antibodies have antigenic determinants for the analytes selected from the group consisting of alpha-1 microglobulin, beta-2 microglobulin, cystatin C, KIM-1, THP, and TIMP-1.
28. The assay device of claim 26, wherein the panel of biomarkers comprises six or more antibodies having antigenic determinants for the analytes comprising alpha-1 microglobulin, beta-2 microglobulin, cystatin C, KIM-1, THP, and TIMP-1.
29. The assay device of claim 26, wherein the panel of biomarkers comprises ten or more antibodies having antigenic determinants for the analytes comprising alpha-1 microglobulin, beta-2 microglobulin, calbindin, clusterin, CTGF, creatinine, cystatin C, GST-alpha, KIM-1, microalbumin, NGAL, osteopontin, THP, TIMP-1, TFF-3, and VEGF.
30. The assay device of claim 26, wherein the panel of biomarkers comprises sixteen or more antibodies having antigenic determinants for the analytes comprising alpha-1 microglobulin, beta-2 microglobulin, calbindin, clusterin, CTGF, creatinine, cystatin C, GST-alpha, KIM-1, microalbumin, NGAL, osteopontin, THP, TIMP-1, TFF-3, and VEGF.
31. A kit for diagnosing, monitoring, or determining a renal disorder in a mammal, the kit comprising:
a. the assay device of claim 2; and
b. a collection apparatus suitable for collecting a sample of bodily fluid from the mammal.
32. The kit of claim 31, wherein the collection apparatus comprises urine sample cups, urethral catheters, swabs, hypodermic needles, thin needles, hollow needles, metabolic cages, and aspiration needles.
33. A kit for diagnosing, monitoring, or determining a renal disorder in a mammal, the kit comprising:
a. the assay device of claim 26; and
b. a collection apparatus suitable for collecting a sample of bodily fluid from the mammal.
34. The kit of claim 33, wherein the collection apparatus comprises urine sample cups, urethral catheters, swabs, hypodermic needles, thin needles, hollow needles, metabolic cages, and aspiration needles.
35. An assay device for diagnosing, monitoring, or determining a renal disorder in a mammal, the device comprising a panel of biomarkers having sixteen antibodies immobilized on a contact surface, wherein the antigenic determinants of the antibodies are analytes associated with renal disorder, wherein the analytes are selected from the group consisting of alpha-1-microglobulin, beta-2-microglobulin, calbindin, clusterin, CTGF, creatinine, cystatin C, GST-alpha, KIM-1, microalbumin, NGAL, osteopontin, THP, TIMP-1, TFF-3, and VEGF.
36. A platform for diagnosing, monitoring, or determining a renal disorder in a mammal, the platform comprising at least 6 antibodies selected from the group consisting of alpha-1-microglobulin, beta-2-microglobulin, calbindin, clusterin, CTGF, creatinine, cystatin C, GST-alpha, KIM-1, microalbumin, NGAL, osteopontin, THP, TIMP-1, TFF-3, and VEGF.
Images & Drawings included:
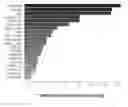


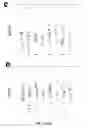
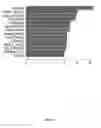
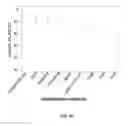
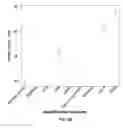


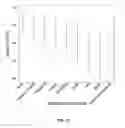


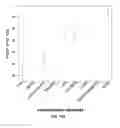

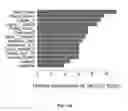


Sources:
- United States Patent and Trademark Office - verify current appl. status at the USPTO↗
Recent applications in this class:
- » 20250172572 2025-05-29
NONINVASIVE METHOD TO QUANTIFY KIDNEY FUNCTION AND FUNCTIONAL DECLINE - » 20250172571 2025-05-29
Biosignatures for Fatigue Syndromes - » 20250164507 2025-05-22
COMPOSITIONS AND METHODS FOR DIAGNOSING AND TREATING CARDIOMYOPATHY IN A FELINE - » 20250164506 2025-05-22
SENSING DEVICE FOR PREDICTING THE RISK OF AN COPD AND/OR ASTHMA ATTACK, MEASUREMENT ARRANGEMENT AND METHOD FOR THE MAINTENANCE OF THE SENSING DEVICE - » 20250164505 2025-05-22
DETECTION OF EXTRACELLULAR VESICLE BIOMARKERS FOR THE DIAGNOSIS OF AUTISM SPECTRUM DISORDER - » 20250155454 2025-05-15
METHOD OF DETECTING TISSUE DAMAGE - » 20250147048 2025-05-08
METHODS OF DIAGNOSTIC SCREENING AND EARLY DETECTION OF ADENOMYOSIS - » 20250147047 2025-05-08
Methods and Applications of Analyzing the Perfusate of an Ex Situ Perfused Kidney - » 20250147046 2025-05-08
NEW METHOD FOR IDENTIFYING HERV-DERIVED EPITOPES - » 20250138027 2025-05-01
METHODS FOR IMPROVING LUNG TRANSPLANTS
Recent applications for this Assignee:
- » 20240384440 2024-11-21
ANTIBODY LIBRARIES WITH MAXIMIZED ANTIBODY DEVELOPABILITY CHARACTERISTICS - » 20240384439 2024-11-21
ANTIBODY LIBRARIES WITH MAXIMIZED ANTIBODY DEVELOPABILITY CHARACTERISTICS - » 20240384438 2024-11-21
ANTIBODY AFFINITY MATURATION USING NATURAL LIABILITY-FREE CDRS - » 20240384437 2024-11-21
ANTIBODY LIBRARIES WITH MAXIMIZED ANTIBODY DEVELOPABILITY CHARACTERISTICS - » 20240240360 2024-07-18
ANTIBODY LIBRARIES WITH MAXIMIZED ANTIBODY DEVELOPABILITY CHARACTERISTICS - » 20240229297 2024-07-11
ANTIBODY LIBRARIES WITH MAXIMIZED ANTIBODY DEVELOPABILITY CHARACTERISTICS - » 20210171936 2021-06-10
Antibody libraries with maximized antibody developability characteristics - » 20140147863 2014-05-29
METHODS AND DEVICES FOR DIAGNOSING ALZHEIMERS DISEASE - » 20130053266 2013-02-28
ILCS BASED PATTERN RECOGNITION OF SEPSIS - » 20120129162 2012-05-24
Cell culture system for determining the sensitizing, allergenic and/or irritating effect of a substance