BACTERIAL STRAIN IDENTIFICATION METHOD AND SYSTEM
US20120115740A1
2012-05-10
12/856,417
2010-08-13
Abstract:
Methods for identifying bacterial strains by using sets of distributed genes that are present in some but not all strains of a given species, associated methods for treating bacterial infections are disclosed. The methods may include examining a sample of a bacterial species, selecting a strain of interest based on possession of a unique genetic characteristic that is present in only the strain of interest and not in the other strains, examining the distributed genes possessed by the strain of interest, and detecting gene-possession variation in the distributed genes of the sample strains as compared to genes of known strains.
Inventors:
- Garth David Ehrlich 4 🇺🇸 Pittsburgh, PA, United States
- Barry G. Hall 1 🇺🇸 Bellingham, WA, United States
- Fen Hu 1 🇺🇸 Oshkosh, WI, United States
Assignee:
- ALLEGHENY-SINGER RESEARCH INSTITUTE 55 🇺🇸 Pittsburgh, PA, United States
Interested in similar patents?
Get notified when new applications in this technology area are published.
Classification:
Y02A50/30 » CPC further
in human health protection, e.g. against extreme weather Against vector-borne diseases, e.g. mosquito-borne, fly-borne, tick-borne or waterborne diseases whose impact is exacerbated by climate change
C12Q1/6827 » CPC main
Measuring or testing processes involving enzymes, nucleic acids or microorganisms ; Compositions therefor; Processes of preparing such compositions involving nucleic acids; Hybridisation assays for detection of mutation or polymorphism
C12Q1/6837 » CPC further
Measuring or testing processes involving enzymes, nucleic acids or microorganisms ; Compositions therefor; Processes of preparing such compositions involving nucleic acids; Hybridisation assays; Enzymatic or biochemical coupling of nucleic acids to a solid phase using probe arrays or probe chips
C12Q2565/518 » CPC further
Nucleic acid analysis characterised by mode or means of detection; Detection characterised by immobilisation to a surface characterised by the immobilisation of the nucleic acid sample or target
C40B30/04 IPC
Methods of screening libraries by measuring the ability to specifically bind a target molecule, e.g. antibody-antigen binding, receptor-ligand binding
C40B30/00 IPC
Methods of screening libraries
C12Q1/68 IPC
Measuring or testing processes involving enzymes, nucleic acids or microorganisms ; Compositions therefor; Processes of preparing such compositions involving nucleic acids
Description
CROSS REFERENCE TO RELATED APPLICATIONS
This patent application claims priority to U.S. Provisional Patent Application No. 61/233,642, filed Aug. 13, 2009, titled “Bacterial Strain Identification Methods and Compositions,” the disclosure of which is incorporated herein by reference in its entirety.
INCORPORATION OF PROGRAM LISTING
The computer programs “GetGenomes.pl”, “NG.pl”, “NG_from_scores.pl”, SGF2.pl, and “Sgroup.pl” are filed herewith, incorporated by reference, and the source code is included on compact disc as files Code.doc. The computer programs “GetGenomes.pl”, “NG.pl”, “NG_from_scores.pl”, SGF2.pl, and “Sgroup.pl” are each subject to the copyright notice provided below.
COPYRIGHT NOTICE
A portion of the disclosure of this patent document contains material which is subject to copyright protection. The copyright owner has no objection to the facsimile reproduction by anyone of the patent document or the patent disclosure, as it appears in the Patent and Trademark Office patent file or records, but otherwise reserves all copyright rights whatsoever.
BACKGROUND
The risk of dying from infectious disease even in first world countries has a much higher heritability factor than that associated with any other type of disease including heart attack and cancer. Moreover, even in the twenty-first century epidemic infectious disease is responsible for more mortality and morbidity worldwide than all other disease states combined. In spite of this overwhelming burden to humankind and society we are still not able to rapidly and accurately distinguish among the many strains and substrains of even the most common pathogenic agents. This is particularly true for many bacterial pathogens due in part to the fact that they often evolve rapidly either through horizontal gene transfer mechanisms or through their ability to rapidly produce a cloud of related organisms through the use of highly mutable genes. Thus, there is an urgent need for improved molecular diagnostics to discriminate among the large numbers of related strains, and for better models for determining the relatedness among strains to aid in understanding the evolution and epidemiology of both established and emergent pathogens. Together the development of these tools will aid prognosis, treatment, and our ability to track epidemics.
Microbial epidemiologists track the spread of pathogens associated with disease in order to determine the sources of outbreaks and to understand their dynamics. The ability to accurately characterize and follow epidemics is reliant on strain-typing methods, sometimes called subtyping, to distinguish among isolates of the same species and is usually accomplished using one or more DNA-based methods. The most widely used molecular strain typing method is multi-locus sequence typing (MLST) in which specific segments of seven or more house keeping genes are sequenced. Each unique sequence of a locus is assigned an allele number, and an allele profile of a strain is defined as the set of allele numbers for that strain. Each unique allele profile is assigned a sequence type (ST) number. Strains that have the same ST number are identical at all of the sequenced loci and are considered to be members of the same clone because they cannot be distinguished from one another. At this time there are 57 MLST schemes, representing 53 microbial species (as described on the World Wide Web at http://pubmlst.org/databases.shtml). The MLST database spans a range from 12,798 isolates representing 7,393 STs (Neisseria sp) down to 8 isolates represents 8 STs (Campylobacter helveticus). MLST, unlike earlier molecular typing methods such as pulse-filed gel electrophoresis, is highly reproducible, is well suited for simple representation in databases, and is relatively inexpensive.
Often multiple outbreaks result from infection by clonally related strains that are descended from a common ancestor and share biochemical and virulence properties. Understanding the dynamics of disease outbreaks requires estimating the relationships among isolates that are identified by strain typing, and the most common approach to estimating those relationships is via phylogenetic analysis.
Phylogenetic analysis is a means of estimating the evolutionary history of a set of taxa (species, genes, individuals, etc.) that are descended from a common ancestor and depends absolutely on the assumption that the taxa are genetically isolated from one another. When the taxa are species, the validity of that assumption is implicit in the definition of a biological species. Although it is well understood that there is some genetic exchange among microbial species the amount of that exchange accounts for only a minor fraction of the variation between species, and molecular-sequence based phylogenetic trees of microbial species are generally robust.
Over the last several years it has become apparent from MLST studies that many species including Neisseria gonorrhoeae, Streptococcus pneumoniae, Streptococcus pyogenes, Helicobacter pylori and Haemophilus influenzae undergo very considerable intra-species horizontal genetic exchange. In Escherichia coli and Staphylococcus aureus, in contrast, genetic exchange was thought to be rare enough to be ignored for phylogenetic purposes, but a more recent study contradicts that view for E. coli. In a recent study Perez-Losada attempted to estimate the population recombination parameters from MLST data for 13 species and concluded that H. pylori, N. gonorrhoeae, and S. pneumoniae populations experience high levels of recombination; but that Bacillus cereus, H. influenzae, Streptococcus agalactiae, and S. pyogenes only experience moderate levels of recombination; while Vibrio vulnificus, Campylobacter jejuni, Enterococcus faecium, E. coli, S. aureus and Moraxella catarrhalis experience low levels of recombination. Again, other studies have contradicted some of those assessments. The program ClonalFrame is reported to be able to extract sufficient phylogenetic signal from MLST data to permit estimation of phylogenetic relationships among some 58 isolates of various Bacillus species. That program is, however, computationally intensive and it is not clear that it would be practical to apply it to several hundred isolates of a single species.
The major limitation of MLST is its inability to resolve many isolates from each other. For instance, the S. aureus MLST database includes 2425 isolates that fall into 958 sequence types. However, 142 of those isolates are ST8 and thus indistinguishable from each other, as are the 120 ST239 isolates. MLST involves sequencing portions of seven to ten housekeeping genes, and thus samples only about 0.1% to 0.2% of a microbial genome, so it follows that 142 isolates might appear to be identical when only a fraction of their genomes are analyzed. The question is whether all, or many, of those isolates are actually different from each other. It seems likely that all ST8 isolates are not, in fact, identical and that higher resolution methods can usefully distinguish them from each other.
Comparisons of multiple whole-genomes sequence of Streptococcus agalactiae (n=8), Haemophilus influenzae (n=13) and Streptococcus pneumoniae (n=17) has led to the concepts of the “supragenome” (or “pan-genome”) and the distributed genome hypothesis. More recent studies have extended the concept to E. coli, S. aureus, Streptococcus pyogenes, and even to the set of all bacteria. For each of those species there is a set of genes that are present in each member of the species (the core genes), and an additional set of genes that are present in some, but not all, members of the species (the distributed genes).
SUMMARY
Embodiments disclosed in this document include methods of identifying and distinguishing a bacterial strain within a species from another bacterial strain in the same species comprising examining a sample of a bacterial species, the sample having a plurality of strains, the strains having a plurality of core genes that are common to all of the strains and a plurality of distributed genes that are not common to all strains of the species, selecting a strain of interest based on possession of a unique genetic characteristic that is present in only the strain of interest and not in the other strains, examining the distributed genes possessed by the strain of interest, accessing a database of information corresponding to known strains of bacterial species, comparing data gathered in the examining of the distributed genes with data from the database, detecting gene-possession variation in the distributed genes of the sample strains as compared to genes of the known strains, and identifying the bacterial strain of the sample strain based on the detected gene-possession variation, and optionally also based on phenotypic potential.
In yet another embodiment, the examination of the set of the distributed genes in the sample may comprise mass spectroscopy, base composition analysis based on moleculare weight and combinations thereof. In yet another embodiment, the examination of the set of the distributed genes in the sample may comprise DNA sequencing. In yet another embodiment, the examination of the set of the distributed genes in the sample may comprise a use of a gene array.
In yet another embodiment, the method of identifying a bacterial strain within a species may further comprise correlating the gene-possession variation with a phenotypic character change in a host eukaryotic organism. A phenotypic character change may comprise, but is not limited to, pathogenesis, virulence, drug resistance, viability and combinations thereof.
In yet another embodiment, methods of identifying a bacterial strain within a species from a sample comprising: examining a bacterial species sample comprising at least two strains, wherein the strains possess a plurality of core genes common to all of strains and a plurality of distributed genes that are not common to all of the strains; depositing a first set of polynucleotide capture probes for less than half of the core genes at corresponding addresses on a substrate, each probe corresponding to an address of one of the core genes; depositing a second set of polynucleotide capture probes corresponding to the set of distributed genes on the substrate; examining, with the second set of probes, the set of distributed genes to detect gene-possession variation between genes in the set; comparing data gathered in the examining of the distributed genes with data from a database of information corresponding to known strains of bacterial species; and identifying the bacterial strain of the sample based on the detected gene-possession variation.
In another embodiment, the substrate may comprise a pool of addressable particles on a two-dimensional solid surface. In yet another embodiment, the substrate may be a glass, a polymer or combinations thereof.
In another embodiment, wherein the bacterial species is selected from the group consisting of Bacillus anthracis, Borrelia burgdorferi, Bacillus cereus, Burkholderia mallei, Clostridium botulinum, Clostridium difficile, Campylobacter jejuni, Clostridium perfringens, Escherichia coli, Haemophilus influenzae, Listeria monocytogenes, Mycobacterium tuberculosis, Pseudomonas aeruginosa, Streptococcus agalactiae, Staphylococcus aureus, Salmonella enterica, Shigella, Streptococcus pneumoniae, Yersinia pestis, Burkholderia pseudomallei, Streptococcus pyogenes, Gardnerella vaginalis, Moraxella catarrhalis, Listeria monocytogenes, and combinations thereof.
An embodiment disclosed herein relates to compositions for the use of distributed genes identified in distinct bacterial strains of a given bacterial species to identify and/or categorize new isolates of that species. In certain embodiments, arrays comprising sets of polynucleotide capture probes for a plurality of distributed genes but containing less than half of the core genes of a given bacterial species are provided. Such arrays are useful for identifying or categorizing a bacterial strain. In still other embodiments, sets of oligonucleotide probes and related methods that permit production of amplification product(s) comprising a fragment of one or more distributed gene(s) of at least one unidentified bacterial strain are provided. Such amplification products can be analyzed by non-sequencing based methods including, but not limited to, mass spectrometry, to identify and/or categorize a bacterial strain.
Embodiments disclosed herein relate to methods of using distributed genes identified in distinct bacterial strains of a given bacterial species to identify and/or categorize new isolates of that species. Also provided herein are methods of treating bacteria infections of subjects that comprise use of distributed genes to identify or categorize bacterial isolates from the subjects and administration of suitable therapeutic agents based on the identification and comparison of the bacterial isolate's distributed gene composition to that of a known bacterial isolate. In certain embodiments provided herein, such methods comprise the use of existing array or mass spectroscopy based methods that provide for the parallel analysis and subsequent comparison of a newly isolated bacterial strain's distributed gene composition to the distributed gene compositions of characterized, or otherwise known, bacterial strains. Nonetheless, it is further contemplated that other technologies not specifically cited herein but that nonetheless provide for the parallel analysis and subsequent comparison of a given bacterial strain's distributed gene composition can also be used in the methods of bacterial identification and/or treatment of the invention. Such technologies can be hybridization-based or mass spectroscopy based.
BRIEF DESCRIPTION OF THE DRAWINGS
FIG. 1 is a block diagram illustrating an exemplary array for the identification of a bacterial strain.
FIG. 2 provides a flow chart showing a method of creating an array and identifying isolates on the array.
FIG. 3 provides diagrams of the relationships among Staphylococcus aureus genomes estimated by the Neighbor Grouping method. Solid arrows are drawn from a genome to its nearest neighbor and are drawn roughly to scale corresponding to the distances between those neighbors. Numbers adjacent to the arrows show the actual distances. Members of a group are interconnected by solid arrows. Dashed arrows connect members of different groups that are valid neighbors, associating those groups into complexes. Only a single dashed arrow is drawn between any two groups. Panel A shows groupings estimated from distances calculated from core gene similarities. Panel B shows groupings estimated from distances calculated from the presence or absence of distributed genes.
FIG. 4 is a plot that shows N, the number of distributed genes in supragenome, versus subset N>0.97, the size of the “good” subset that will generate a score of 0.97.
FIG. 5 is a plot that shows N, the number of distributed genes in supragenome, versus subset N>0.97, the size of the “good” subset that will generate a score of 0.97, when N>4,000.
DETAILED DESCRIPTION
This disclosure is not limited to the particular systems, methodologies or protocols described, as these may vary. The terminology used in this description is for the purpose of describing the particular versions or embodiments only, and is not intended to limit the scope.
As used in this document, the singular forms “a,” “an,” and “the” include plural reference unless the context clearly dictates otherwise. Unless defined otherwise, all technical and scientific terms used herein have the same meanings as commonly understood by one of ordinary skill in the art. All publications mentioned in this document are incorporated by reference. All sizes recited in this document are by way of example only, and the invention is not limited to structures having the specific sizes or dimensions recited below. Nothing in this document is to be construed as an admission that the embodiments described in this document are not entitled to antedate such disclosure by virtue of prior invention. As used herein, the term “comprising” means “including, but not limited to.”
As used herein, the term “array” refers to any set of addressable physical entities or any physical entity comprising a plurality of addressable points.
As used herein, the phrase “core genes” refers to genes that are possessed by all members of a species.
As used herein, the phrase “distributed genes” refers to genes that are possessed by some, but not all, members of a species.
As used herein, the phrase “substrate” refers to a platform or a solid surface.
As used herein, the phrase “gene possession variation” refers to unique genetic characteristics that are only present in a particular strain of a bacterial species.
As used herein in the context of a polynucleotide capture probe used in an array or an array-based method, the phrase “stringent hybridization” condition refers to conditions that provide for hybridization of only those nucleic acid molecules with at least 90% sequence identity to the capture probe. In still other embodiments, a stringent hybridization condition can provide for hybridization of only those nucleic acid molecules with at least 95%, at least 98%, at least 99%, or at least 100% sequence identity to a polynucleotide capture probe of an array or array-based-method.
As used herein in the context of methods of treating bacterial infections methods, the term “subject” includes humans, non-human mammals, birds, amphibians, reptiles, and fish.
As used herein, the term “supragenome” refers to the set of all genes possessed by members of a bacterial species. The supragenome thus consists of core genes and distributed genes. The term “pan-genome” is considered herein to be synonymous with the term “supragenome”.
I. Methods for Identifying Bacterial Strains by Distributed Gene Compositions
Various embodiments described below include methods of identifying a bacterial strain of a bacterial species. This identification may be performed in various ways. In some embodiments, a method of identifying a bacterial strain of a given bacterial species may include the steps of: a) determining a distributed gene composition of a bacterial isolate of a given bacterial species, wherein a core gene composition for less than half the core genes is determined (described in more detail in the discussion of steps 201-209 of FIG. 2 below); and, b) identifying the bacterial isolate by a comparison of the distributed gene composition of the isolate of step (a) to a distributed gene composition of a known bacterial strain of a given bacterial species (step 205 in FIG. 2). In certain embodiments of these methods, the distributed gene composition determined is a binary (i.e. “present” or “absent”) representation of the distributed gene set of the bacterial strain examined. This binary representation is then compared to the binary representation of distributed genes in a known bacterial strain to permit strain identification. In certain embodiments, the determination of step (a) does not comprise sequencing. In certain embodiments of the methods, a distributed gene composition of at least 10, at least 50, at least 100, at least 250, or at least 500 distributed genes is determined. In certain embodiments, a composition of no more than about 10, no more than about 50, or no more than about 200 core genes of the bacterial isolate are determined. In certain embodiments, the determination of step (a) comprises an hybridization-based gene analysis technique or a mass spectroscopy-based gene analysis technique.
It is thus not necessary to utilize all of the known distributed genes in a supragenome of a given bacterial to type strains of that species. Instead, a subset of those distributed genes may be employed. For a randomly selected subset of distributed genes obtained from a set of bacterial strains, the resolving power (i.e. the ability to distinguish either all or some of the bacterial strains) of that subset of distributed genes may be related in part to the size of the subset. However, in certain embodiments, sufficient resolving power of a subset of distributed genes may be achieved when the subset is non-randomly selected. Non-random selections can provide for subsets of distributed genes that are optimized to provide for the best representation of distributed genes that distinguish the strains. In certain embodiments, non-random subsets of distributed genes may be used to ascertain the presence, or the probability of the presence, of certain medically, agriculturally, or ecologically important phenotypes in strains. Those phenotypes may include, but are not limited to, adhesion, antibiotic resistance, biofilm formation, increased invasiveness, toxin production, increased host range, increased survivorship outside of a host, and virulence.
Also provided herein are methods of treating a bacterial infection in a subject in need thereof, the method comprising the steps of: (a) determining an identity of a bacterial strain by the method of any of the aforementioned methods; and, (b) administering to the subject at least one therapeutic agent shown to effective in controlling a bacterial strain substantially similar to said bacterial strain identified in step (a). In this context, a bacterial strain can be considered to be substantially similar to another bacterial strain when the strains differ in the presence of any of 0, 1, 2, 3, 4, or 5 distributed genes of at least 100, at least 200, or at least 250 distributed genes assayed.
Without seeking to be limited by theory, bacterial strain identification via comparisons of strain distributed gene content can yield a number of distinct advantages over bacterial strain identification by analysis of core gene sequences. Whole-genome sequences provide two distinct ways to distinguish, or type, strains within a species: on the basis of core gene similarities and on the basis of the presence or absence of distributed genes. Both approaches sample an enormously greater proportion of the genome than does MLST. Core genes sample a greater fraction of the genome (56% for E. coli and 72% for S. aureus) than do distributed genes, but the degree of variation among the core genomes is much less than in the smaller fraction of the genome sampled by distributed genes. For instance, S. aureus strains JH1 and JH9 differ at 10−5 of the bases, or about 20 base pairs, in their core genes, but they differ at 0.0553 of the distributed genes in the S. aureus supragenome, i.e. in the presence or absence of 125 genes. Similarly, E. coli K12 strains MG1655 and W3110 differ at only 1.23×10⁻⁶ of the base pairs in their 2610 core genes, or at about 4 base pairs, but they differ in the presence of 0.0195 of the 10,489 distributed genes in the E. coli supragenome; i.e., in 205 distributed genes.
II. Arrays Comprising Distributed Genes
Provided herein are arrays comprising polynucleotide capture probes for distributed genes that are useful for identifying a bacterial strain. In certain embodiments, referring to FIG. 1 the array 100 comprises a substrate 103 having a plurality of addresses 105. Polynucleotide capture probes 110 for a set of distributed genes from each of at least two bacterial strains of a given bacterial species are deposited at corresponding addresses on said substrate. The set of distributed genes contains at least one distributed gene present in one of said strains and absent in another of said strains, and wherein polynucleotide capture probes 120 for less than half of all core genes common to both of said bacterial strains are deposited at corresponding addresses on said substrate. In certain embodiments, one or more polynucleotide capture probes 110 for each of said distributed genes specifically hybridizes to only one of said distributed genes under stringent hybridization conditions. Arrays where at least one to at least ten polynucleotide capture probes 110 for detection of each distributed gene are thus provided.
It is not necessary to utilize all of the known distributed genes in a supragenome of a given bacterial species to identify or type strains of that species. Instead, a subset of those distributed genes may be employed. The set of distinct distributed genes detectable by the array can vary according to the number of strains to be identified and/or the extent to which distributed gene sets vary from strain to strain of a given species. The resolving power of a given subset of distributed genes can be directly related to the size of the subset as well as to the use of distributed genes that have the greatest degree of inter-strain variability (i.e. are either present or absent in the greatest number of known or characterized strains). It is thus anticipated that arrays aimed at distinguishing a large number of strains characterized by the presence or absence of only a few distributed genes can comprise polynucleotide capture probes corresponding to larger sets of distributed genes and/or distributed genes selected for inter-strain variability. In certain embodiments, the set of distributed genes is sufficient to distinguish two bacterial strains of the species when the strains differ in the presence or absence of at least 1% of distributed genes identified for the species. In still other embodiments, the set of distributed genes is sufficient to distinguish two bacterial strains of the species when the strains differ in the presence or absence of at least 0.4% of distributed genes identified for said species. In certain embodiments, the arrays can detect a set of distributed genes that comprises at least 100 distributed genes. In still other embodiments, the arrays can detect a set of distributed genes that comprises at least 250, at least 300, at least 500, or at least 1,000 distributed genes. In certain embodiments, the arrays provided herein are thus capable of distinguishing at least 2, at least 5, at least 10, at least 12, at least 14, at least 16, at least 20, or at least 22 distinct strains of a given bacterial species.
Another feature of arrays provided herein is that they may comprise polynucleotide capture probes for less than half of all core genes common to the bacterial strains to be analyzed. Advantages of such arrays include, but are not limited to, reduced manufacturing costs, reduced data storage requirements, and simplification of data acquisition and analysis. In certain embodiments, the arrays may comprise a set of polynucleotide capture probes for core genes that comprises less than about 200 of the core genes of a given bacterial species. In still other embodiments, the arrays may comprise a set of polynucleotide capture probes for core genes that comprise less than about 100, less than about 50, less than about 25, or less than about 10 of the core genes of a given bacterial species. In such arrays, the presence or absence of hybridization to the core genes may be used as an internal control for array manufacturing quality control, target strain nucleic acid preparation, labeling, and/or hybridization, and the like.
A variety of distinct types of arrays comprising polynucleotide capture probes corresponding to sets of distributed genes are provided. In one embodiment, the substrate may be made of glass or plastic, the array substrate may include a pool of addressable particles. Such addressable particles may include microspheres or beads that are coupled to the polynucleotide capture probes and then coded such that hybridization of a target nucleic acid to a particular capture probe can be scored. Methods, compositions, and related apparati that use such encoded beads to analyze multiple analytes including nucleic acids are provided in U.S. Pat. Nos. 6,023,540, 5,981,180, and 6,649,414, each of which are incorporated by reference herein in their entireties. In other embodiments, a two-dimensional solid surface that provides for deposition of polynucleotide capture probes at defined positions on the surface such that hybridization to specific capture probes can be determined. Methods, compositions, and related apparati that provide for such arrays and analysis of data obtained from the same are provided in U.S. Pat. Nos. 6,261,776, 5,981,733, 6,408,308, 6,613,529, 7,157,229, and 6,423,535, each of which are incorporated by reference herein in their entireties. Also contemplated herein is the use of composite arrays comprising surfaces with both assay locations and microspheres that include, but are not limited to arrays such as those described in U.S. Pat. Nos. 7,510,841, 7,226,734, and 6,429,027, each of which are incorporated by reference herein in their entireties.
It is contemplated that the polynucleotide capture probes for the array can be obtained for detection of distributed genes from any bacterial species for which multiple strains have been subjected to whole genome sequencing. Furthermore, it is also contemplated that as databases become populated with additional genomic sequences of additional strains of a given bacterial species, new distributed genes that are useful in the practice of this invention will be identified. In certain embodiments, the bacterial species is Bacillus anthracis and the set of distributed genes detected comprises at least 250 genes found within that species. In certain embodiments, the bacterial species is Borrelia burgdorferi and the set of distributed genes detected comprises at least 250 genes found within that species. In certain embodiments, the bacterial species is Bacillus cereus and the set of distributed genes detected comprises at least 250 genes found within that species. In certain embodiments, the bacterial species is Burkholderia mallei and the set of distributed genes detected comprises at least 250 genes found within that species. In certain embodiments, the bacterial species is Clostridium botulinum and the set of distributed genes detected comprises at least 250 genes found within that species. In certain embodiments, the bacterial species is Clostridium difficile and the set of distributed genes detected comprises at least 250 genes found within that species. In certain embodiments, the bacterial species is Campylobacter jejuni and the set of distributed genes comprises at least 250 genes found within that species. In certain embodiments, the bacterial species is Clostridium perfringens and the set of distributed genes detected comprises at least 250 genes found within that species. In certain embodiments, the bacterial species is Escherichia coli and the set of distributed genes detected comprises at least 250 genes found within that species. In certain embodiments, the bacterial species is bacterial species is Haemophilus influenzae and the set of distributed genes detected comprises at least 250 genes found within that species. In certain embodiments, the bacterial species is Listeria monocytogenes and the set of distributed genes detected comprises at least 250 genes found within that species. In certain embodiments, the bacterial species is Mycobacterium tuberculosis and the set of distributed genes detected comprises at least 250 genes found within that species. In certain embodiments, the bacterial species is Pseudomonas aeruginosa and the set of distributed genes detected comprises at least 250 genes found within that species. In certain embodiments, the bacterial species is Streptococcus agalactiae and the set of distributed genes found within that species. In certain embodiments, the bacterial species is Staphylococcus aureus and the set of distributed genes detected comprises at least 250 genes found within that species. In certain embodiments, the bacterial species is Salmonella enterica and the set of distributed genes detected comprises at least 250 genes found within that species. In certain embodiments, the bacterial species is Shigella and the set of distributed genes detected comprises at least 250 genes found within that species. In certain embodiments, the bacterial species is Streptococcus pneumoniae and the set of distributed genes comprises at least 250 genes found within that species. In certain embodiments, the bacterial species is Yersinia pestis and the set of distributed genes detected comprises at least 250 genes found within that species. In certain embodiments, the bacterial species is Burkholderia pseudomallei and the set of distributed genes detected comprises at least 250 genes found within that species. In certain embodiments, the bacterial species is Streptococcus pyogenes and the set of distributed genes detected comprises at least 250 genes found within that species.
Any of the arrays provided herein can further comprise polynucleotide capture probes for one or more genes that confer resistance to an antibiotic. Such genes that confer resistance to an antibiotic can be genes that confer resistance to beta-lactam, aminoglycoside, macrolide, tetracycline-type, fluoroquinoline, rifamycin, and/or chloramphenicol-type antibiotics. A listing of antibiotic resistance genes is provided in Liu B, Pop M. ARDB-Antibiotic Resistance Genes Database. Nucleic Acids Res. 2009 January; 37(Database issue):D443-7. Antibiotic resistance genes used can include, but are not limited to: i) aminoglycoside resistance genes ii) beta lactamases (beta-lactam resistance); iii) Macrolide-Lincosamide-Streptogramin B (MLSB) resistance genes; iv) multidrug transporters (major facilitator superfamily (MFS) transporters, ATP-Binding Cassette transporters, Resistance-Nodulation-Cell Division (RND) transporters, Small Multidrug Resistance (SMR) transporter); v) Tetracycline Resistance genes; and vi) vancomycin resistance genes.
III. Methods for Making the Arrays and/or Identifying Distributed Genes Useful in Strain Typing
Also provided herein are methods of making arrays and associated methods for identifying distributed genes for use in the arrays or other methods for strain typing provided herein. Referring to FIG. 2, methods of making an array comprising a substrate having a plurality of addresses comprising the steps of depositing at corresponding addresses on said substrate: i) a first set of polynucleotide capture probes for a first set of distributed genes from each of at least two bacterial strains of a given bacterial species, wherein the set of distributed genes contain at least one distributed gene present in one of said strains and absent in another of said strains (step 211); and ii) a second set polynucleotide capture probes for less than half of all core genes common to both of said bacterial strains (step 213). In certain embodiments, the array comprises a first set of distributed genes that is selected from a second larger set of distributed genes obtained from a representative set of bacterial strains for said bacterial species.
In certain instances, a single contiguous and essentially complete genomic sequence is available for each strain in the representative strain set. A strain may be identified by determining a distributed gene composition of each bacterial isolate in the array (step 201). In certain embodiments of the methods wherein a single contiguous and essentially complete genomic sequence is available for each strain in said representative set, wherein all or some of the second larger set of distributed genes and wherein all or some of the core genes can be identified by: a) creating or accessing a searchable database file comprising each gene of each strain (step 203); b) querying the searchable file with each gene of each identified strain (step 205); and b) identifying: i) the second set of distributed genes comprising genes that occur in a genome of at least one of said strains but not in the genomes of all of said strains (step 207) and ii) the core genes comprising genes that occur in each of genome of all of said strains (step 209). One exemplary scheme for obtaining sets of distributed genes for use in arrays of the invention comprises the following steps of:
(1) downloading a series microbial genomes obtained from distinct strains of the same species, as files in a computer readable format, where the format includes but is not limited to a GenBank format;
(2) creating from those downloaded genomes of (1) a file, in a computer readable format including, but not limited to, fasta, containing each of the genes in each of those genomes;
(3) creating a searchable database from that file of (2) (i.e. a database can be searched by a sequence recognition or alignment algorithm including, but not limited to, BLAST);
(4) searching the database with each of the genes in the file of (3) in order to identify those genes that occur in each of the genomes (core genes) and the genes that occur in some, but not all, of the genomes (distributed genes or, in the context of these programs and files “shared genes”);
(5) making a computer readable file (including, but not limited to, a FASTA file) that contains one example of each of the core genes (for example, a “Core.fasta” file) and another file that contains one example of each of the distributed genes (i.e. “shared genes”) (for example, a “Shared.fasta” file);
(6) making a set of computer readable files (including, but not limited to, FASTA files) for each of the core genes that occur exactly once in each genome in which the file includes all of the alleles of that gene;
(7) making a corresponding set of computer readable files (including, but not limited to, a FASTA files) the distributed (i.e. “shared genes”) that occur once in the genomes in which they are present;
(8) determine for each shared gene whether it is present in each genome and on the basis of the presence or absence of each of the distributed genes (i.e. “shared genes”) calculate distances between all possible pairs of genomes.
An exemplary and non-limiting series of computer programs that can be used sequentially to obtain a set of distributed genes for detection in an array or other method of the invention as per the scheme outlined above are provided herein. This scheme is also alternatively referred to herein as a “Hall Algorithm”. In certain embodiments, application of this exemplary software requires that the stand-alone BLAST suite of programs be installed. Stand-alone BLAST is available on the Internet from ftp://ftp.ncbi.nlm.nih.gov/blast/executables/LATEST-BLAST/. The first such program is entitled “GetGenomes” that entails use of an “infileName” and a “baseFileName”. The infileName is a list of GI numbers (GenBank Gene Identification Numbers) for the genomes. Each line consists of the GI number separated by a tab from the genome length. The baseFileName is the name for the output fasta file and for the database index files and is usually a species name (i.e. “Ecoli” and the like). GetGenomes writes each genome to a GenBank file and puts those GenBank files into a folder named GenBank files. GetGenomes writes a fasta file named baseFileName.fa that includes each gene feature in each of the genome files. GetGenomes writes a database consisting of three files baseFileName.nhr, baseFileName.nin, and baseFileName.nsq. GetGenomes also writes a file named GenomeNames that consists of a list of each of the accession numbers of each genome, one per line. That file (GenomeNames) is used by SGF2 (Supra-genome finder2). Use of SGF2 entails a queryFileName databaseFileName where queryFileName is the name of the baseFileName.fa file produced by GetGenomes and databaseFileName is the name of the database produced by GetGenomes (i.e. the baseFileName). A file named GenomeNames, generated by GetGenomes, is also in the folder that is accessible to SGF2. The SGF2 program writes: (1) a fasta file named “Core.sequences” that includes the a representative of each sequence that occurred in all of the genomes; (2) a fasta file named “Shared.sequences” that includes a representative of each gene that occurs in some, but not all, of the genomes; (3) Individual fasta files for each gene that occurs exactly once in each genome and that consist of the sequences of each allele of that core gene which are gathered into the folder named Core Fasta files; (4) individual fasta files for each gene that occurs in some but not all genomes and that consist of each allele of that distributed gene which are gathered together in the folder Shared Fasta Files; and (5) individual fasta files for each gene that occurs at least once in each genome, but may occur multiple times in some or all genomes and that consist of each allele of that gene which are gathered together in the folder “Excess hits Fasta files” which is populated with core genes; and (6) a log file named databaseFileName.logfile that lists the number of core and shared genes in the supra genome and the distribution of genes that occur in 1, 2, 3, . . . (et cetera) genomes as each genome is scanned. Also provided is a program entitled “SGroup” which requires no input file. “SGroup” must be run from within the Shared Fasta Genes folder and that folder must contain a copy of the file “GenomeNames”. Output files of “SGroup” are “SGroup.logfile” and “SGroup.scores”. The SGroup.logfile includes a matrix of the distances between all possible pairs of genomes where distances are the fraction of shared genes that are present in one genome but not in the other.
The SGroup.logfile also includes Groups of genomes and a list of related groups. Grouping is based on the concept of valid neighbors and nearest valid neighbors. A pair of genomes are valid neighbors if the distance between them is less than the average distance among all of the genomes minus the standard errors of the average distance. Members of a Group are the nearest valid neighbor of at least one other member of the Group. Two Groups are related if at least one genome in the first Group is a valid neighbor of at least one genome in the second Group. The SGroup.scores file can be used as the input to a computer program provided herein that is referred to as Neighbor Grouping (NG) to generate a file that is virtually identical to SGroup.logfile. Such groupings can be used as described herein in a following section (VII. Computational Methods for Identifying Bacterial Strains by Distributed Gene Composition).
The source code for the files listed above is included in a source code appendix file that is included with this application, and which is incorported by reference herewith.
The software described above may be stored as computer program instructions in a computer-readable medium that instruct a processor to perform the functions. Any computing device containing a central processing unit that performs calculations and logic operations may execute the program. Read only memory (ROM) and random access memory (RAM) constitute exemplary computer-readable media. Memory devices also may include, for example, an external or internal DVD drive with corresponding media, a CD ROM, a hard drive, flash memory, a USB drive or the like.
In certain instances, a set of non-overlapping genomic sequences comprising an essentially complete genomic sequence is available for each strain in said representative set for a given bacterial species. In certain embodiments of the methods where a set of non-overlapping genomic sequences comprising an essentially complete genomic sequence is available for each strain in said representative set, and wherein all or some of said second larger set of distributed genes and wherein all or some of said core genes are identified by: a) identifying one or more clusters of orthologous coding sequences; b) identifying both: i) clusters of distributed genes wherein said cluster includes orthologous genes from only a subset of said strains; and ii) clusters of core genes wherein said cluster includes orthologous genes from all of said strains; and c) selecting one representative distributed gene from a plurality of distributed gene cluster(s) and one representative core gene from a plurality of core gene clusters. An exemplary and non-limiting description of this method for identifying distributed genes by this method is described in Hogg et al., Genome Biol 2007, 8(6):R103.
In certain instances, it is the case that a single contiguous and essentially complete genomic sequence is available for some strains in the representative strain set and a set of non-overlapping genomic sequences comprising an essentially complete genomic sequence is available for other strains in said representative set for a given bacterial species. Under these circumstances, a set of distributed genes to be detected can be obtained by using a combination of the aforementioned methods that are suited to each circumstance of genome sequence status. Thus in certain embodiments of the methods, wherein a single contiguous and essentially complete genomic sequence is available for some strains in said representative set, and some of said second larger set of distributed genes and wherein all or some of said core genes are identified by: a) creating a searchable database file comprising each gene of each strain; b) querying said searchable file with each gene of each strain; and c) identifying: i) said second set of distributed genes comprising genes that occur in a genome of at least one of said strains but not in the genomes of all of said strains and ii) said core genes comprising genes that occur in each of genome of all of said strains; and wherein a set of non-overlapping genomic sequences comprising an essentially complete genomic sequence is available for other strains in said representative set, and wherein some of said second larger set of distributed genes and wherein all or some of said core genes are identified by: d) identifying one or more clusters of orthologous coding sequences; e) identifying both: i) clusters of distributed genes wherein said cluster includes orthologous genes from only a subset of said strains; and ii) clusters of core genes wherein said cluster includes orthologous genes from all of said strains; and f) selecting one representative distributed gene from a plurality of distributed gene cluster(s) and one representative core gene from a plurality of core gene clusters.
It is contemplated that the arrays can be made with polynucleotide capture probes for detection of distributed genes from any bacterial species for which multiple strains have been subjected to whole genome sequencing. Furthermore, it is also contemplated that as databases become populated with additional genomic sequences of additional strains of a given bacterial species, new distributed genes that are useful in the practice of this invention will be identified. In certain embodiments, the bacterial species is Bacillus anthracis and the set of distributed genes detected comprises at least 250 genes found within that species. In certain embodiments, the bacterial species is Borrelia burgdorferi and the set of distributed genes detected comprises at least 250 genes found within that species. In certain embodiments, the bacterial species is Bacillus cereus and the set of distributed genes detected comprises at least 250 genes found within that species. In certain embodiments, the bacterial species is Burkholderia mallei and the set of distributed genes detected comprises at least 250 genes found within that species. In certain embodiments, the bacterial species is Clostridium botulinum and the set of distributed genes detected comprises at least 250 genes found within that species. In certain embodiments, the bacterial species is Clostridium difficile and the set of distributed genes detected comprises at least 250 genes found within that species. In certain embodiments, the bacterial species is Campylobacter jejuni and the set of distributed genes comprises at least 250 genes found within that species. In certain embodiments, the bacterial species is Clostridium perfringens and the set of distributed genes detected comprises at least 250 genes found within that species. In certain embodiments, the bacterial species is Escherichia coli and the set of distributed genes detected comprises at least 250 genes found within that species. In certain embodiments, the bacterial species is Haemophilus influenzae and said set of distributed genes detected comprises at least 250 genes found within that species. In certain embodiments, the bacterial species is Listeria monocytogenes and the set of distributed genes detected comprises at least 250 genes found within that species. In certain embodiments, the bacterial species is Mycobacterium tuberculosis and the set of distributed genes detected comprises at least 250 genes found within that species. In certain embodiments, the bacterial species is Pseudomonas aeruginosa and the set of distributed genes detected comprises at least 250 genes found within that species. In certain embodiments, the bacterial species is Streptococcus agalactiae and the set of distributed genes detected comprises at least 250 genes found within that species. In certain embodiments, the bacterial species is Staphylococcus aureus and the set of distributed genes detected comprises at least 250 genes found within that species. In certain embodiments, the bacterial species is Salmonella enterica and the set of distributed genes detected comprises at least 250 genes found within that species. In certain embodiments, the bacterial species is Shigella and the set of distributed genes detected comprises at least 250 genes found within that species. In certain embodiments, the bacterial species is Streptococcus pneumoniae and the set of distributed genes comprises at least 250 genes found within that species. In certain embodiments, the bacterial species is Yersinia pestis and the set of distributed genes detected comprises at least 250 genes found within that species. In certain embodiments, the bacterial species is Burkholderia pseudomallei and the set of distributed genes detected comprises at least 250 genes found within that species. In certain embodiments, the bacterial species is Streptococcus pyogenes and the set of distributed genes detected comprises at least 250 found within that species.
IV. Methods for Treating a Bacterial Infection
Methods of treating bacterial infections by determination of distributed gene compositions of bacterial isolates are also provided herein. It is contemplated that the methods of treating subjects such as humans, non-human mammals, birds, amphibians, reptiles, and fish provided herein are useful in applications including but not limited to, medical applications, veterinary applications, aquaculture, and the like.
Exemplary and non-limiting methods of treating a bacterial infection in a subject in need thereof may comprise the steps of: a) detecting hybridization of genomic DNA from at least one bacterial strain obtained from said subject to capture polynucleotides of the array of the invention; b) determining an identity of said bacterial strain based on presence or absence of hybridization to polynucleotide capture probes for a set of distributed genes on said array; and, c) administering to said subject at least one therapeutic agent shown to effective in controlling a bacterial strain substantially similar to said bacterial strain identified in step (b) are provided herein. In this context, a bacterial strain can be considered to be substantially similar to another bacterial strain when the strains differ in the presence of any of 0, 1, 2, 3, 4, or 5 distributed genes of at least 100, at least 200, or at least 250 distributed genes assayed. In certain embodiments of the methods, the presence or absence of hybridization to said distributed genes can be normalized to hybridization to one or more polynucleotide capture probes for at least one core gene. In certain embodiments, hybridization of said genomic DNA to said polynucleotide capture probes is under stringent hybridization conditions. In certain embodiments of the methods, identity of said bacterial strain is determined in step (b) by: a) scoring presence of hybridization or absence of hybridization to one or more polynucleotide capture probes corresponding to each of said distributed genes deposited on said array to obtain a binary output file; b) comparing said binary output file obtained for said hybridization to at least one binary output file obtained from at least one reference bacterial strain; and, c) identifying said bacterial strain as either related or distinct from said reference strain based upon said comparison in (b). In still other embodiments, step (b) comprises a comparison of all available pairs of strains available to determine: i) a mean distance and a standard error of the mean (s.e.m.) distance for all available pairs of strains that is the fraction of distributed genes in which said pairs of strains differ with respect to presence or absence of a distributed gene; and ii) a distance for two pairs of strains that is the fraction of distributed genes in which said pairs of strains differs with respect to presence or absence of a distributed gene; and wherein step (c) comprises identification of a pair of strains wherein said distance is less than the mean distance minus the standard error of measurement (s.e.m), thereby identifying a set of related strains.
Still other exemplary and non-limiting methods of treating a bacterial infection in a subject in need thereof that comprise the steps of: a. determining an identity of a bacterial strain by the method of: (i) obtaining one or more amplification product(s) comprising a fragment of one or more distributed gene(s) of at least one unidentified bacterial strain; (ii) determining the molecular mass of said amplification products by mass spectrometry; and (iii) determining an identity of said unidentified bacterial strain based on a comparison of said molecular mass from an amplification product from (ii) to a calculated or measured molecular masses of a corresponding amplification product from one or more known bacterial strains; and, b. administering to said subject at least one therapeutic agent shown to effective in controlling a bacterial strain substantially similar to said bacterial strain identified in step (a). Exemplary and non-limiting examples of methods for determining identities of unknown bioagents using amplification and mass determination are disclosed in U.S. Pat. No. 7,108,974, which is incorporated by reference herein in its entirety. In this context, a bacterial strain can be considered to be substantially similar to another bacterial strain when the strains differ in the presence of any of 0, 1, 2, 3, 4, or 5 distributed genes of at least 100, at least 200, or at least 250 distributed genes assayed.
It is contemplated that the methods of treatment of bacterial infections provided herein can be applied to any bacterial species for which multiple strains have been subjected to whole genome sequencing. Furthermore, it is also contemplated that as databases become populated with additional genomic sequences of additional strains of a given bacterial species, new distributed genes that are useful in the practice of this invention will be identified. In certain embodiments, the bacterial species is Bacillus anthracis and the set of distributed genes detected comprises at least 250 genes found within that species. In certain embodiments, the bacterial species is Borrelia burgdorferi and the set of distributed genes detected comprises at least 250 genes found within that species. In certain embodiments, the bacterial species is Bacillus cereus and the set of distributed genes detected comprises at least 250 genes found within that species. In certain embodiments, the bacterial species is Burkholderia mallei and the set of distributed genes detected comprises at least 250 genes found within that species. In certain embodiments, the bacterial species is Clostridium botulinum and the set of distributed genes detected comprises at least 250 found within that species. In certain embodiments, the bacterial species is Clostridium difficile and the set of distributed genes detected comprises at least 250 genes found within that species. In certain embodiments, the bacterial species is Campylobacter jejuni and the set of distributed genes comprises at least 250 genes found within that species. In certain embodiments, the bacterial species is Clostridium perfringens and the set of distributed genes detected comprises at least 250 genes found within that species. In certain embodiments, the bacterial species is Escherichia coli and the set of distributed genes detected comprises at least 250 genes found within that species. In certain embodiments, the bacterial species is bacterial species is Haemophilus influenzae and the set of distributed genes detected comprises at least 250 genes found within that species. In certain embodiments, the bacterial species is Listeria monocytogenes and the set of distributed genes detected comprises at least 250 genes found within that species. In certain embodiments, the bacterial species is Mycobacterium tuberculosis and the set of distributed genes detected comprises at least 250 genes found within that species. In certain embodiments, the bacterial species is Pseudomonas aeruginosa and the set of distributed genes detected comprises at least 250 genes found within that species. In certain embodiments, the bacterial species is Streptococcus agalactiae and the set of distributed genes detected comprises at least 250 genes found within that species. In certain embodiments, the bacterial species is Staphylococcus aureus and the set of distributed genes detected comprises at least 250 genes found within that species. In certain embodiments, the bacterial species is Salmonella enterica and the set of distributed genes detected comprises at least 250 genes found within that species. In certain embodiments, the bacterial species is Shigella and the set of distributed genes detected comprises at least 250 genes found within that species. In certain embodiments, the bacterial species is Streptococcus pneumoniae and the set of distributed genes comprises at least 250 genes found within that species. In certain embodiments, the bacterial species is Yersinia pestis and the set of distributed genes detected comprises at least 250 genes found within that species. In certain embodiments, the bacterial species is Burkholderia pseudomallei and the set of distributed genes detected comprises at least 250 genes found within that species. In certain embodiments, the bacterial species is Streptococcus pyogenes and the set of distributed genes detected comprises at least 250 genes found within that species.
V. Methods of Identifying Bacterial Strains
It is contemplated that the methods of identifying bacterial strains provided herein are useful in applications including, but not limited to, medical applications, veterinary applications, aquaculture, agricultural applications, food quality control (QC) applications, fermentation process QC applications, drug manufacturing QC applications, cosmetics manufacturing QC applications, personal healthcare product QC applications, water quality monitoring, and the like.
In certain exemplary and non-limiting embodiments, methods of identifying a bacterial strain comprise the steps of: a) isolating genomic DNA from at least one identified bacterial strain; b) detecting hybridization of the isolated genomic DNA to capture polynucleotides of an array; and c) determining an identity of said bacterial strain based on presence or absence of hybridization to polynucleotide capture probes for a set of distributed genes on the array (or by another method such as sequencing or mass spectroscopy). In certain embodiments of the methods, the presence or absence of hybridization to said distributed genes is normalized to hybridization to one or more polynucleotide capture probes for at least one core gene. In certain embodiments, hybridization of the genomic DNA to the polynucleotide capture probes is under stringent hybridization conditions. In certain embodiments of the methods, identity of said bacterial strain may be determined in step (b) by: a) scoring presence of hybridization or absence of hybridization to one or more polynucleotide capture probes corresponding to each of said distributed genes deposited on the array to obtain a binary output file; b) comparing the binary output file obtained for the hybridization to all other available binary output file(s) obtained from at least one reference bacterial strain; and, c) identifying the bacterial strain as either related or distinct from the reference strain based upon the comparison in (b). In certain embodiments of the methods, step (b) comprises a comparison of all available pairs of strains available to determine: i) a mean distance and a standard error of the mean standard error of mean (s.e.m.) distance for all available pairs of strains that is the fraction of distributed genes in which said pairs of strains differ with respect to presence or absence of a distributed gene; and ii) a distance for two pairs of strains that make up the fraction of distributed genes in which the pairs of strains differ with respect to presence or absence of a distributed gene; and wherein step (c) comprises identification of a pair of strains wherein the distance is less than the mean distance minus the s.e.m, thereby identifying a set of related strains. In still other embodiments, the methods can further comprise the steps of; d) analyzing a genome of a strain in a database for presence or absence of the set of distributed genes by a comparison of sequence data; e) comparing said presence or absence of the distributed genes to a presence or absence for the distributed genes in step (b); and f) determining an identity of the strain from the database based upon the comparison in step (e).
In other exemplary and non-limiting methods of identifying a bacterial strain provided herein, the methods comprise the steps of: a) obtaining one or more amplification product(s) comprising a fragment of one or more distributed gene(s) of at least one unidentified bacterial strain; b) determining the molecular mass of the amplification products by mass spectrometry; and c) determining an identity of the unidentified bacterial strain based on a comparison of the molecular mass from an amplification product (b) to a calculated or measured molecular masses of a corresponding amplification product from one or more known bacterial strains. Exemplary and non-limiting examples of methods for determining identities of unknown bioagents using amplification and mass determination are disclosed in U.S. Pat. No. 7,108,974, which is incorporated by reference herein in its entirety. In certain embodiments of these methods, the amplification product(s) from step (a) may or may not be sequenced. In still other embodiments, the presence of at least one of said distributed genes in a bacterial strain is positively associated with a phenotype of clinical relevance. In certain embodiments, the phenotype is selected from the group consisting of adhesion, antibiotic resistance, biofilm formation, increased invasiveness, toxin production, increased host range, increased survivorship outside of a host, and virulence.
It is contemplated that the methods of identifying bacterial strains provided herein can be applied to any bacterial species for which multiple strains have been subjected to whole genome sequencing. Furthermore, it is also contemplated that as databases become populated with additional genomic sequences of additional strains of a given bacterial species, new distributed genes that are useful in the practice of this invention will be identified. In certain embodiments, the bacterial species is Bacillus anthracis and the set of distributed genes detected comprises at least 250 genes found within that species. In certain embodiments, the bacterial species is Borrelia burgdorferi and the set of distributed genes detected comprises at least 250 genes found within that species. In certain embodiments, the bacterial species is Bacillus cereus and the set of distributed genes detected comprises at least 250 genes found within that species. In certain embodiments, the bacterial species is Burkholderia mallei and the set of distributed genes detected comprises at least 250 genes found within that species. In certain embodiments, the bacterial species is Clostridium botulinum and the set of distributed genes detected comprises at least 250 genes found within that species. In certain embodiments, the bacterial species is Clostridium difficile and the set of distributed genes detected comprises at least 250 genes found within that species. In certain embodiments, the bacterial species is Campylobacter jejuni and the set of distributed genes comprises at least 250 genes found within that species. In certain embodiments, the bacterial species is Clostridium perfringens and the set of distributed genes detected comprises at least 250 genes found within that species. In certain embodiments, the bacterial species is Escherichia coli and the set of distributed genes detected comprises at least 250 genes found within that species. In certain embodiments, the bacterial species is bacterial species is Haemophilus influenzae and the set of distributed genes detected comprises at least 250 genes found within that species. In certain embodiments, the bacterial species is Listeria monocytogenes and the set of distributed genes detected comprises at least 250 genes found within that species. In certain embodiments, the bacterial species is Mycobacterium tuberculosis and the set of distributed genes detected comprises at least 250 genes found within that species. In certain embodiments, the bacterial species is Pseudomonas aeruginosa and the set of distributed genes detected comprises at least 250 genes found within that species. In certain embodiments, the bacterial species is Streptococcus agalactiae and the set of distributed genes detected comprises at least 250 genes found within that species. In certain embodiments, the bacterial species is Staphylococcus aureus and the set of distributed genes detected comprises at least 250 genes found within that species. In certain embodiments, the bacterial species is Salmonella enterica and the set of distributed genes detected comprises at least 250 genes found within that species. In certain embodiments, the bacterial species is Shigella and the set of distributed genes detected comprises at least 250 genes found within that species. In certain embodiments, the bacterial species is Streptococcus pneumoniae and the set of distributed genes comprises at least 250 genes found within that species. In certain embodiments, the bacterial species is Yersinia pestis and the set of distributed genes detected comprises at least 250 genes found within that species. In certain embodiments, the bacterial species is Burkholderia pseudomallei and the set of distributed genes detected comprises at least 250 genes found within that species. In certain embodiments, the bacterial species is Streptococcus pyogenes and the set of distributed genes detected comprises at least 250 genes found within that species. In certain embodiments of the methods, the bacterial strain identified is a strain of the genus Acinetobacter, Aeromonas, Bacillus, Bacteriodes, Bartonella, Bordetella, Borrelia, Brucella, Burkholderia, Campylobacter, Chiamydia, Chiamydophila, Clostridium, Coxiella, Enterococcus, Escherichia, Francisella, Fusobacterium, Haemophilus, Helicobacter, Klebsiella, Legionella, Leptospira, Listeria, Moraxella, Mycobacterium, Mycoplasma, Neisseria, Proteus, Pseudomonas, Rhodobacter, Ricketsia, Salmonella, Shigella, Staphylococcus, Streptobacillus, Streptomyces, Treponema, Ureaplasma, Vibrio, or Yersinia. In certain embodiments of the methods, the bacterial strain identified is a strain of a bacterial species selected from the group consisting of Francisella tularensis, Gardnerella vaginalis, Moraxella catarrhalis, Haemophilus haemolyticus, Brucella suis, Brucella abortus, Brucella melitensis, Salmonella typhi, Coxiella burnetii, Rhodobacter capsulatus, Shigella dysenteriae, Shigella flexneri, Coxiella burnetti, Pseudomonas aeruginosa, Legionella pneumophila, Vibrio cholerae and Streptococcus mitis.
VI. Computational Methods for Identifying Bacterial Strains by Distributed Gene Composition
It is anticipated that a variety of computerized software programs can be used to compare distributed gene compositions of unidentified bacterial strain isolates to the distributed gene compositions of known bacterial strain isolates to identify the unknown isolate. Such computer software programs can be used to analyze output data obtained by any method or technique for scoring the presence or absence of one or more distributed genes in the unidentified isolate and comparing that output data to the distributed gene composition for an identified strain. Method or techniques for scoring the presence or absence of one or more distributed genes include, but are not limited to, methods or techniques based on hybridization of genomic DNAs of bacterial isolates to arrays, mass-spectroscopy of amplification products, and the like. The methods provided herein also provide for comparison of the output data generated for an unidentified strain by any method or technique to be compared to any database of distributed gene compositions for one or more known strains. Thus the database of distributed gene compositions for one or more known strains includes, but is not limited to, databases generated either by the same method used to obtain the distributed gene composition for the unknown isolate, databases generated by a distinct method, or databases generated by a combination of methods.
One such exemplary and non-limiting software program that can be used to identify bacterial strains is provided herein is a Neighbor Grouping (NG) analytical method. Neighbor Grouping (NG) methods estimate relationships among isolates of a species on the basis of the supragenome of that species and the distributed genes that are present or absent in each individual. NG methods groups genomes based on their distances from each other and whether they are valid neighbors. Each genome (corresponding to each bacterial isolate) is described by the presence or absence of each of the distributed genes in the supragenome of the species and is described by a binary string in which a zero indicates the absence of a particular gene and a one indicates the presence of that gene. The distance between a pair of genomes is based on comparison of the binary string descriptors of the two genomes. If a particular gene is present in both genomes, or is absent in both genomes a value of 1 is scored for that gene, indicating that the two genomes are identical with respect to the presence or absence of that gene. If the two genomes differ, i.e. one has the gene and the other does not, a value of zero is scored. The total score is the sum of the scores for the individual genes, and the similarity (S) is the total score divided by the number of distributed genes in the supragenome. The distance (D)=1−S and is the fraction of distributed genes in the supragenome for which the two genomes differ.
To estimate the relationships among genomes a matrix of all pairwise distances between genomes is calculated and the mean distance and standard error of the mean (s.e.m) are calculated. A pair of genomes are defined as being neighbors if their distance is less than the mean minus s.e.m (standard error of the mean). A group of genomes consists of a set in which each genome is the nearest neighbor of at least one other member of the group. Typically a set of genomes will sort into a few groups plus some singlets. A singlet is a genome that has no valid neighbors. Groups are linked into a set if at least one member of each group are valid neighbors.
A schematic diagram of an embodiment of the Neighbor Grouping method provided herein is provided in FIG. 3. The exemplary program NG.pl provided herein can take three input files: ClusterReport.txt, report_output, and GenomeNames. ClusterReport.txt and report_output are output files from the software algorithms described by Hogg et al., Genome Biol 2007, 8(6):R103. GenomeNames is a file consisting of a list of the names of the genomes as they appear in the ClusterReport.txt and report_output files, one name per line. NG writes two output files: NG.logfile and NG.scores. The NG.logfile includes the matrix of the distances between all possible pairs of genomes, and also includes Groups of genomes and a list of related groups. The NG.scores file gives, for each genome, the binary string that indicates the presence or absence of each distributed gene in the supragenome.
The program NG_from_scores.pl takes a single input file referred to herein as a “scores” file. Such a “scores file could be named XXX.scores where XXX is any descriptor. The scores file is a simple text (ASCI) file in which each line consists of a genome identifier separated by a tab character from a binary string that indicates the presence or absence of each of that species' distributed genes in the genome. The scores file might be generated by analysis of a completely sequenced genome, or it might be generated from the output of a distributed-gene microarray hybridization analysis. The program writes a single output file, a “logfile” that includes a matrix of all pairwise distances between the genomes in the scores file, the number of groups, and the composition of each group, the number of sets of groups, and the composition of each set. The program is written in Perl. The program consists of 267 lines of Perl code plus blank lines and comments for improved readability and facilitation of revision. Blank lines and comments are ignored during compilation and execution of the program: Usage: perl Ng_from_scores.pl MyFiles.scores.
The embodiments were chosen and described in order to best explain the principles of the invention and its practical application to thereby enable others skilled in the art to best utilize the invention in various embodiments and with various modifications as are suited to the particular use contemplated.
EXAMPLES
The following disclosed embodiments are merely representative of the invention, which may be embodied in various forms. Thus, specific structural and functional details disclosed herein are not to be interpreted as limiting.
Example 1
Determining Numbers of Randomly Selected Distributed Genes Required for Resolution of all Strains in a Given Data Set
A study was performed to identify the minimal number of randomly selected distributed genes necessary to resolve all of the strains of a selected group of species for which whole genome data was available. Of the 21 species we considered (Bacillus anthracis, Borrelia burgdorferi, Bacillus cereus, Burkholderia mallei, Burkholderia pseudomallei, Clostridium botulinum, Clostridium difficile, Campylobacter jejuni, Clostridium perfringens, Escherichia coli, Haemophilus influenzae, Listeria monocytogenes, Mycobacterium tuberculosis, Pseudomonas aeruginosa, Streptococcus agalactiae, Streptococcus pyogenes, Staphylococcus aureus, Salmonella enterica, Shigella, Streptococcus pneumoniae, and Yersinia pestis, only six include a sufficient number of closed genomes to estimate a supragenome by the Hall algorithms provided herein whereas the remaining 16 species are estimated by the Hogg algorithm (Hogg et al., Genome Biol 2007, 8(6):R103). The most closely related strains that have been observed are a pair of Haemophilus influenzae strains with a distance of 0.0064 (Hogg algorithm) and a pair of Staphylococcus aureus strains with a distance of 0.00453 (Hall algorithm). These distances represent strains that differ in the presence/absence of only 9 gene (H. influenzae) or 10 distributed genes (S. aureus). Since distance between the most closely related strains depends entirely on the strains that were sampled for genome sequencing purposes, it is reasonable to assume that the failure to detect similarly closely related strains within the other 20 species simply reflects sampling. It is therefore reasonable to define a sufficient subset of distributed genes as a number that is sufficient to resolve a pair of strains that differ in the presence/absence of 0.004 of the distributed genes with a reliability of at least 90%. As a starting point that number can be estimated as 250 genes; i.e. if 250 distributed genes are used a pair of strains that differ in the presence/absence of 0.004 of those genes is expected on average to differ at one gene.
With that in mind, subsets of N randomly sampled distributed genes from the H. influenzae and S. aureus supragenomes were used to estimate the relationships among the genomes of those species by the NG method. For both H. influenzae and S. aureus 90% of random subsets of 300 distributed genes resolved all of the genomes, while 80% and 60%, respectively, of random subsets of 250 distributed genes resolved all genomes.
Example 2
Analysis of Strains by MLST-Based Analyses
For each species the gene fragment sequences for each MLST locus were extracted from the genome sequences and the appropriate MLST web site was used to identify the allele numbers of the locus sequences and the ST number. In some cases allele numbers could not be assigned because of ambiguity codes in a sequence, and some novel alleles precluded assigning genomes to known STs. For the majority of genomes, however, sequence types could be as signed.
MLST-based analyses were able to resolve all 16 Salmonella enterica, all 11 Streptococcus pneumoniae, and all of the 10 Bacillus cereus strains that have been fully sequenced at the time of analysis.
In contrast, among 14 sequenced Staphylococcus aureus genomes, three strains (NCTC8325, USA300_FPR3757, and USA300_TCH1516) were ST8, three (Mu3,Mu50, and N315) were ST5, and two (JH1 and JH9) were ST105. Thus, among the 14 completely sequenced S. aureus genomes there are many strains that cannot be distinguished by MLST. There are 142 ST8, 137 ST5 and 41 ST105 isolates in the S. aureus database.
Similarly, among 22 Escherichia coli genomes, three strains (APEC01, UT189, and S88) were ST95, two (O157:H7_Sakai and O157:H7_EC4115) were ST11 and two (MG1655 and W3110) were ST10. Among 12 Streptococcus pyogenes genomes two (MGAS315 and SST-1) were ST15, two (MGAS9429 and MGAS2096) were ST36, and two (MGAS5005 and M1_GAS) were ST7.
Example 3
Analysis of Supragenomes
For each species we identified orthologous genes by conducting BLAST [26, 27] searches of each sequence identified as a gene in the GenBank annotations against a database of all such genes. A set of Perl scripts was used to determine which sets of orthologs constituted core genes and distributed genes in all genomes. Genes were classified as orthologous if they shared at least 70% sequence identity over at least 70% of the length of the query sequence [19]. Genes that were present in each of the genomes were classified as core genes, while those that were present in at least one, but not all, genomes were classified as distributed genes.
The core gene distances between all possible pairs of genomes of each species were calculated by a Perl program, C-group, that used the Blast program Blast2seq to calculate the sequence identities between all possible pairs of each set of core orthologs. Those identities were averaged over all core genes and the distance between a pair of genomes was defined as one minus the average nucleotide identity (ANI). A Perl program, S-group, was used to determine for each genome which distributed genes were present (scored as 1) and which were absent (scored as 0) in the genome. All possible pairs of genomes were compared and scored as 1 if a distributed gene was either present in both genomes or absent in each genome, and scored as 0 if the distributed gene was present in one genome but absent in the other genome. The scores for each of the distributed genes were summed and divided by the number of distributed genes to calculate the fraction of distributed genes (FDG) that were the same in both genomes. The distributed gene distance between the two genomes is 1-FDG.
Table 1 describes the detailed properties of the S. aureus supragenome, while Table 2 summarizes the supragenomes of E. coli, S. pyogenes, B. cereus, S. pneumoniae and S. enterica. These properties are consistent with earlier descriptions of the supragenomes of these and other species.
| TABLE 1 |
| Properties of the S. aureus supragenome |
| The Staphylococcus aureus supragenome includes |
| 4221 genes: 1923 core genes and 2298 distributed genes. |
| On average, 73% of an S. aureus genome is core genes |
| Core | Distributed | ||
| Distribution of genes | Strain | Genes | Genes |
| 741 genes are present | RF122 | 1923 | 652 |
| in 1 genome | |||
| 302 genes are present | COL | 1923 | 778 |
| in 2 genomes | |||
| 191 genes are present | JH1 | 1923 | 814 |
| in 3 genomes | |||
| 148 genes are present | JH9 | 1923 | 752 |
| in 4 genomes | |||
| 118 genes are present | MRSA252 | 1923 | 781 |
| in 5 genomes | |||
| 104 genes are present | MSSA476 | 1923 | 683 |
| in 6 genomes | |||
| 88 genes are present | MW2 | 1923 | 695 |
| in 7 genomes | |||
| 63 genes are present | Mu3 | 1923 | 749 |
| in 8 genomes | |||
| 63 genes are present | Mu50 | 1923 | 745 |
| in 9 genomes | |||
| 46 genes are present | N315 | 1923 | 624 |
| in 10 genomes | |||
| 62 genes are present | NCTC832 | 1923 | 953 |
| in 11 genomes | |||
| 114 genes are present | USA300_FPR3757 | 1923 | 636 |
| in 12 genomes | |||
| 258 genes are present | USA300_TCH1516 | 1923 | 783 |
| in 13 genomes | |||
| 1923 genes are present | Newman | 1923 | 622 |
| in 14 genomes | |||
| TABLE 2 |
| Summary of the supragenomes of six species. |
| Typical | |||||||
| genome, | |||||||
| Fraction of | fraction | MLST | |||||
| Core | Distributed | supragenome | that | resolves | |||
| genes in | genes in | that is core | is core | all | |||
| Species | Na | supragenome | supragenome | Total | genes | genes | genomes? |
| Bacillus cereus | 10 | 1993 | 10218 | 13099 | 0.1632 | 0.3842 | Yes |
| Escherichia coli | 22 | 2610 | 10489 | 10884 | 0.2398 | 0.5569 | No |
| Salmonella enterica | 16 | 2055 | 7911 | 9966 | 0.2062 | 0.4654 | Yes |
| Staphylococcus aureus | 14 | 1923 | 2298 | 4221 | 0.4556 | 0.7200 | No |
| Streptococcus | 11 | 1455 | 2479 | 3934 | 0.4004 | 0.6843 | Yes |
| pneumoniae | |||||||
| Streptococus pyogenes | 12 | 1311 | 1972 | 3283 | 0.3993 | 0.6941 | No |
| aN is the number of completely sequenced genomes that were analyzed. |
A compilation of analyses of sequenced genomes of 21 bacterial species is provided in Table 3.
| TABLE 3 |
| Summary of supragenomes of 21 species |
| Mean | ||||||||
| Fraction of | Fraction | |||||||
| Supra- | Supra- | of individual | ||||||
| genome | genome that | genome | ||||||
| Number | size, | is | that is | |||||
| of | Core | Distributed | total | distributed | distributed | |||
| Species | Genomes | Genes | Genes | genes | genes | genes | Groups | Sets |
| Bacillus anthrasis | 17 | 5043 | 506 | 5549 | 0.091 | 0.078 | 3:12-3-2 | 2 |
| BACILLUS CEREUS | 10 | 1993 | 10218 | 12211 | 0.837 | 0.616 | 4:3-3-3-1 | 1 |
| Borrelia burgdorferi | 13 | 1008 | 278 | 1286 | 0.216 | 0.125 | 4:2-3-4-3 | 1 |
| Burkholderia mallei | 10 | 4073 | 1084 | 5157 | 0.21 | 0.181 | 4:1-6-2-1 | 3 |
| Burkholderia | 14 | 5804 | 3006 | 8810 | 0.341 | 0.135 | 4:9-1-3-1 | 3 |
| pseudomallei | ||||||||
| Campylobacter jejuni | 10 | 1400 | 1111 | 2511 | 0.442 | 0.151 | 3:1-6-3 | 2 |
| Clostridium botulinum | 8 | 2881 | 2365 | 5246 | 0.451 | 0.202 | 3:1-6-1 | 3 |
| Clostridium difficille | 10 | 3100 | 1827 | 4927 | 0.371 | 0.158 | 3:8-1-1 | 3 |
| Clostridium | 9 | 2048 | 2928 | 4976 | 0.588 | 0.315 | 2:8-1 | 2 |
| perfringens | ||||||||
| ESCHERICHIA | 22 | 2610 | 10489 | 13099 | 0.801 | 0.443 | 4:8-6-3-5 | 1 |
| COLI | ||||||||
| Haemophilus | 23 | 1445 | 1405 | 2850 | 0.493 | 0.207 | 6:4-5-2- | 1 |
| influenzae | 6-2-4 | |||||||
| Listeria | 20 | 2475 | 1507 | 3982 | 0.378 | 0.15 | 4:5-4-8-3 | 1 |
| monocytogenes | ||||||||
| Mycobacterium | 16 | 3505 | 336 | 3841 | 0.087 | 0.075 | 6:3-2-6- | 3 |
| tuberculosis | 3-1-1 | |||||||
| Pseudomonas | 9 | 4717 | 2345 | 7062 | 0.332 | 0.157 | 4:2-2-4-1 | 2 |
| aeruginosa | ||||||||
| SALMONELLA | 16 | 2055 | 7911 | 9966 | 0.794 | 0.348 | 7:1-2-4- | 4 |
| ENTERICA | 1-1-3-4 | |||||||
| Shigella species | 8 | 2875 | 2567 | 5442 | 0.472 | 0.274 | 5:2-1-1- | 5 |
| 3-1 | ||||||||
| STAPHYLOCOCCUS | 14 | 1923 | 2298 | 4211 | 0.546 | 0.275 | 5:1-5-2- | 2 |
| AUREUS | 4-2 | |||||||
| Streptococcus | 8 | 1553 | 1109 | 2662 | 0.417 | 0.217 | 3:1-4-3 | 2 |
| agalactiae | ||||||||
| STREPTOCOCCUS | 11 | 1455 | 2479 | 3934 | 0.630 | 0.316 | 3:8-2-1 | 2 |
| PNEUMONIAE | ||||||||
| STREPTOCOCCUS | 12 | 1311 | 1972 | 3283 | 0.601 | 0.306 | 5:2-3-3- | 1 |
| PYOGENES | 2-2 | |||||||
| Yersinia pestis | 16 | 3412 | 1106 | 4518 | 0.245 | 0.178 | 3:13-1-2 | 2 |
| Mean ± s.e. | 0.445 ± 0.047 | 0.234 ± 0.028 | ||||||
| aGroups are indicated as G:N1-N2-N3-etc where G indicates the number of groups and N1, N2, etc indicate the number of genomes in each group, separated by dashes. | ||||||||
| bSets consist of related groups. The number of sets is shown. | ||||||||
| ALL CAPS indicates species in which all genomes were closed and distributed genes were determined by the Hall algorithm. |
Example 4
Resolution of Genomes within a Species by Allelic Analyses of Core Gene Sequences
Table 4 shows the core gene distances among the 14 S. aureus genomes. All genomes were resolved from each other, i.e. distances were >0, including those that could not be resolved by MLST. Notice that whereas the average distance between all genome pairs is 0.0073 the distances between genome pairs that could not be resolved by MLST is always ≦0.0002. Similarly, all 22 E. coli strains and all 12 S. pyogenes strains were resolved, and, as was the case for S. aureus, the distances among genomes of the same ST were much smaller than the average distance among genomes. All 16 S. enterica strains, all 10 B. cereus strains and all 11 S. pneumoniae strains were likewise resolved.
| TABLE 4 |
| Distances based on Staphylococcus aureus core gene similaritiesa |
| RF122 | COL | JH1 | JH9 | MRSA252 | MSSA476 | MW2 | |
| RF122 | 0 | 0.0141 | 0.0141 | 0.0141 | 0.0161 | 0.0139 | 0.0139 |
| COL | 0.0141 | 0 | 0.0063 | 0.0063 | 0.0172 | 0.0054 | 0.0054 |
| JH1 | 0.0141 | 0.0063 | 0 | 1e−5 | 0.0171 | 0.0062 | 0.0062 |
| JH9 | 0.0141 | 0.0063 | 1e−5 | 0 | 0.0171 | 0.0062 | 0.0062 |
| MRSA252 | 0.0161 | 0.0172 | 0.0171 | 0.0171 | 0 | 0.0171 | 0.0171 |
| MSSA476 | 0.0139 | 0.0054 | 0.0062 | 0.0062 | 0.0171 | 0 | 0.0001 |
| MW2 | 0.0139 | 0.0054 | 0.0062 | 0.0062 | 0.0171 | 0.0001 | 0 |
| Mu3 | 0.0141 | 0.0063 | 0.0002 | 0.0002 | 0.0171 | 0.0062 | 0.0062 |
| Mu50 | 0.0141 | 0.0063 | 0.0002 | 0.0002 | 0.0171 | 0.0062 | 0.0062 |
| N315 | 0.0141 | 0.0063 | 0.0001 | 0.0001 | 0.0171 | 0.0062 | 0.0061 |
| NCTC8325 | 0.0141 | 0.0002 | 0.0063 | 0.0063 | 0.0171 | 0.0054 | 0.0054 |
| USA300 | 0.0141 | 0.0002 | 0.0063 | 0.0064 | 0.0172 | 0.0054 | 0.0054 |
| FPR3757 | |||||||
| USA300 | 0.0141 | 0.0002 | 0.0063 | 0.0063 | 0.0172 | 0.0054 | 0.0054 |
| TCH1516 | |||||||
| Newman | 0.0141 | 0.0001 | 0.0063 | 0.0063 | 0.0171 | 0.0054 | 0.0054 |
| USA300 | USA300 | ||||||
| Mu3 | Mu50 | N315 | NCTC8325 | FPR3757 | TCH1516 | Newman | |
| RF122 | 0.0141 | 0.0141 | 0.0141 | 0.0141 | 0.0141 | 0.0141 | 0.0141 |
| COL | 0.0063 | 0.0063 | 0.0063 | 0.0002 | 0.0002 | 0.0002 | 0.0001 |
| JH1 | 0.0002 | 0.0002 | 0.0001 | 0.0063 | 0.0063 | 0.0063 | 0.0063 |
| JH9 | 0.0002 | 0.0002 | 0.0001 | 0.0063 | 0.0064 | 0.0063 | 0.0063 |
| MRSA252 | 0.0171 | 0.0171 | 0.0171 | 0.0171 | 0.0172 | 0.0172 | 0.0171 |
| MSSA476 | 0.0062 | 0.0062 | 0.0062 | 0.0054 | 0.0054 | 0.0054 | 0.0054 |
| MW2 | 0.0062 | 0.0062 | 0.0061 | 0.0054 | 0.0054 | 0.0054 | 0.0054 |
| Mu3 | 0 | 6e−5 | 0.0001 | 0.0063 | 0.0063 | 0.0063 | 0.0063 |
| Mu50 | 6e−5 | 0 | 0.0001 | 0.0063 | 0.0064 | 0.0063 | 0.0063 |
| N315 | 0.0001 | 0.0001 | 0 | 0.0063 | 0.0063 | 0.0063 | 0.0063 |
| NCTC8325 | 0.0063 | 0.0063 | 0.0063 | 0 | 0.0002 | 0.0002 | 0.0002 |
| USA300 | 0.0063 | 0.0064 | 0.0063 | 0.0002 | 0 | 2e−5 | 0.0002 |
| FPR3757 | |||||||
| USA300 | 0.0063 | 0.0063 | 0.0063 | 0.0002 | 2e−5 | 0 | 0.0002 |
| TCH1516 | |||||||
| Newman | 0.0063 | 0.0063 | 0.0063 | 0.0002 | 0.0002 | 0.0002 | 0 |
| The mean distance between genomes is 0.00733 ± 0.00042. | |||||||
| The maximum distance between valid neighbors is 0.00691. | |||||||
| aDistances are expressed as 1-ANI (Average Nucleotide Identity) in core genes. |
Example 5
Neighbor Grouping Based on the Presence or Absence of Distributed Genes
While it is both expensive and time consuming to determine the sequences of the core genes of a strain, it is relatively inexpensive and quick to determine the presence or absence of each of the distributed genes in a species' supragenome by performing comparative genome hybridization to microarrays imprinted with each of the distributed genes. Thus we determined for each of the six species identified above, whether the presence or absence of distributed genes provides as much resolution among strains as do core gene sequences, and, if so, whether clustering by NG based on distributed genes is consistent with both MLST clustering by eBURST and with NG clustering based on core gene sequences.
Table 5 shows the distributed gene distances for S. aureus. The distributed gene distances were calculated on the basis of the presence or absence in each genome of each of the distributed genes from the S. aureus supragenome. The distance between two genomes is defined as the fraction of distributed genes from the supragenome in which the two genomes differ with respect to presence or absence of a distributed gene. Thus, for S. aureus, whose supragenome includes 2298 distributed genes, a pair of strains that differ in the presence/absence of 150 distributed genes would have a distance of 0.065.
| TABLE 5 |
| Distances based on the presence or absence of distributed genes in Staphylococcus aureusa |
| RF122 | COL | JH1 | JH9 | MRSA252 | MSSA476 | MW2 | |
| RF122 | 0 | 0.358 | 0.3371 | 0.3235 | 0.3774 | 0.3086 | 0.314 |
| COL | 0.358 | 0 | 0.3054 | 0.2963 | 0.3675 | 0.2805 | 0.2886 |
| JH1 | 0.3371 | 0.3054 | 0 | 0.0553 | 0.3058 | 0.266 | 0.2768 |
| JH9 | 0.3235 | 0.2963 | 0.0553 | 0 | 0.3022 | 0.2605 | 0.2678 |
| MRSA252 | 0.3774 | 0.3675 | 0.3058 | 0.3022 | 0 | 0.2628 | 0.2918 |
| MSSA476 | 0.3086 | 0.2805 | 0.266 | 0.2605 | 0.2628 | 0 | 0.0942 |
| MW2 | 0.314 | 0.2886 | 0.2768 | 0.2678 | 0.2918 | 0.0942 | 0 |
| Mu3 | 0.3249 | 0.3493 | 0.208 | 0.1908 | 0.3172 | 0.2818 | 0.2728 |
| Mu50 | 0.324 | 0.3512 | 0.2107 | 0.1935 | 0.3172 | 0.2827 | 0.2737 |
| N315 | 0.2891 | 0.3063 | 0.1876 | 0.1749 | 0.2587 | 0.2361 | 0.2243 |
| NCTC 8325 | 0.4173 | 0.2442 | 0.3276 | 0.3276 | 0.4341 | 0.3099 | 0.3172 |
| USA300 | 0.338 | 0.2021 | 0.2655 | 0.2411 | 0.304 | 0.2333 | 0.2261 |
| FPR3757 | |||||||
| USA300 | 0.4599 | 0.256 | 0.3548 | 0.3521 | 0.4005 | 0.328 | 0.3335 |
| TCH1516 | |||||||
| Newman | 0.3036 | 0.2583 | 0.28 | 0.2619 | 0.3448 | 0.2605 | 0.2633 |
| USA300 | USA300 | ||||||
| Mu3 | Mu50 | N315 | NCTC8325 | FPR3757 | TCH1516 | Newman | |
| RF122 | 0.3249 | 0.324 | 0.2891 | 0.4173 | 0.338 | 0.4599 | 0.3036 |
| COL | 0.3493 | 0.3512 | 0.3063 | 0.2442 | 0.2021 | 0.256 | 0.2583 |
| JH1 | 0.208 | 0.2107 | 0.1876 | 0.3276 | 0.2655 | 0.3548 | 0.2800 |
| JH9 | 0.1908 | 0.1935 | 0.1749 | 0.3276 | 0.2411 | 0.3521 | 0.2619 |
| MRSA252 | 0.3172 | 0.3172 | 0.2587 | 0.4341 | 0.304 | 0.4005 | 0.3448 |
| MSSA476 | 0.2818 | 0.2827 | 0.2361 | 0.3099 | 0.2333 | 0.328 | 0.2605 |
| MW2 | 0.2728 | 0.2737 | 0.2243 | 0.3172 | 0.2261 | 0.3335 | 0.2633 |
| Mu3 | 0 | 0.0045 | 0.0847 | 0.396 | 0.2968 | 0.4024 | 0.2705 |
| Mu50 | 0.0045 | 0 | 0.0856 | 0.396 | 0.2968 | 0.4042 | 0.2723 |
| N315 | 0.0847 | 0.0856 | 0 | 0.3729 | 0.2447 | 0.3502 | 0.2383 |
| NCTC 8325 | 0.396 | 0.396 | 0.3729 | 0 | 0.2895 | 0.309 | 0.2778 |
| USA300 | 0.2968 | 0.2968 | 0.2447 | 0.2895 | 0 | 0.1953 | 0.1994 |
| FPR3757 | |||||||
| USA300 | 0.4024 | 0.4042 | 0.3502 | 0.309 | 0.1953 | 0 | 0.3131 |
| TCH1516 | |||||||
| Newman | 0.2705 | 0.2723 | 0.2383 | 0.2778 | 0.1994 | 0.3131 | 0 |
| The mean distance between genomes is 0.28418 ± 0.00585. | |||||||
| The maximum distance between valid neighbors is 0.27833. | |||||||
| aDistances are the fraction of the distributed genes in the supragenome at which the two strains differ with respect to presence or absence of the gene. |
Table 5 shows that all 14 S. aureus genomes were resolved on the basis of distributed gene distances. The NG groups are very similar to those estimated on the basis of core gene sequences and are consistent with MLST eBURST clustering. There are five groups: Group 1: (RF122), Group 2: (COL, USA300_FPR3757, NCTC8325, USA300_TCH1516, Newman), Group 3: (JH1, JH9), Group 4: (MRSA252, N315, Mu3, Mu50) and Group 5: (MSSA476,MW2). The differences between clustering on the basis of core gene sequences and on the basis of the presence or absence of distributed genes is that the latter combines the core gene groups 2 and 7 into a single group and it includes MRSA252 in the group with N315, Mu3, and Mu50. Groups 2-5 are linked into a single complex. Similarly, all genomes of the other five species under consideration were resolved by distributed gene distances.
In a Neighbor Grouping analysis each pair of genomes has one of two relationships: they are in the same group (1) or they are in different groups (0). For each analysis a matrix was created in which the relationships of all possible pairs of genomes are represented as 0 or 1. Two groupings can be compared by comparing the matrices to determine what fraction of the relationships are the same in the two analyses. That fraction is the similarity of the groupings. For S. aureus the grouping similarity was 0.857. Table 6 shows the core-gene groupings, the distributed-gene groupings, and the similarities of those groupings for all six species.
| TABLE 6 |
| Neighbor Grouping Results. |
| Grouping | |||
| Species | Core Gene Groupingsa | Distributed Gene Groupingsa | Similarity |
| Bacillus cereus | {(03BB102, AH820, E33L), | {(03BB102, AH820, E33L), | 1.0 |
| (AH187, ATCC10987)} | (AH187, ATCC10987), | ||
| (ATCC14579, B4264, G9842), | (ATCC14579, B4264, | ||
| (NVH391_98) | G9842)}, | ||
| (NVH391_98) | |||
| Escherichia coli | {(K12_MG1655, K12_W3110, | {(K12_MG1655, K12_W3110, | 0.8442 |
| K12_DH10B), (ATCC8739, HS), | ATCC8739, HS, SMS_3_5, | ||
| (O157:H7_EDL933, O157:H7_ Sakai, | K12_DH10B, IAI39, E2348_69), | ||
| O157:H7_ EC4115), (E24377A, IAI1, | (CFT073, UTI89, 536, S88, | ||
| SE11, 55989)}, (CFT073, UTI89, 536, | APECO1, ED1a), | ||
| APECO1, E2348/69, S88, ED1a), | (O157:H7_EDL933, | ||
| (SMS_3_5, IAI39), (UMN026) | O157:H7_ Sakai, | ||
| O157:H7_ EC4115), (E24377A, | |||
| SE11IAI1, UMN026, 55989)} | |||
| Salmonella | (Arizonae_62:z4, z23:—), | (Arizonae_62:z4, z23:—), | 0.9083 |
| enterica | {(Choleraesuis_SC_B67, Paratyphi_C_RKS4594), | {(Choleraesuis_SC_B67, | |
| (Heidelberg_SL476, | Paratyphi_C_RKS4594), | ||
| Typhimurium_LT2, Newport_SL254, | (Heidelberg_SL476, | ||
| Paratyphi_B_SPB7, Agona_SL483, | Newport_SL254, Agona_SL483, | ||
| Schwarzengrund_CVM19633), | Schwarzengrund_CVM19633), | ||
| (Paratyphi_A_ATCC9150, | (Typhi_CT18, Typhi_Ty2, | ||
| Paratyphi_A_AKU_12601), | Paratyphi_A_AKU_12601), | ||
| (Typhi_CT18, Typhi_Ty2), | (Typhimurium_LT2, | ||
| (Dublin_CT_02021853, | Enteritidis_P125109, | ||
| Enteritidis_P125109, | Dublin_CT_02021853, | ||
| Gallinarum_287_91)} | Gallinarum_287_91)}, | ||
| (Paratyphi_A_ATCC9150), | |||
| (Paratyphi_B_SPB7) | |||
| Staphylococcus | (RF122), {(COL, Newman), (JH1, | (RF122), {(COL, Newman, | 0.8352 |
| aureus | JH9), (MSSA476, MW2), (Mu3, | USA300_FPR3757, | |
| Mu50, N315), (USA300_FPR3757, | USA300_TCH1516, NCTC8325), | ||
| USA300_TCH1516, NCTC8325)}, | (JH1, JH9), (MRSA252, N315, | ||
| (MRSA252) | Mu3, Mu50), (MSSA476, | ||
| MW2)} | |||
| Streptococcus | {(70585, P1031), (ATCC700669, JJA, | {(70585, D39, CGSP14, R6, | 0.6545 |
| pneumoniae | CGSP14), (D39, R6, G54, TIGR4)}, | TIGR4, Taiwan19F_14, P1031, | |
| (Hungary19A_6), (Taiwan19F_14) | G54) (ATCC700669, JJA)}, | ||
| (Hungary19A_6), | |||
| Streptococus | {(MGAS315, SSI-1), (MGAS6180, | {(MGAS315, SSI-1), (Manfredo, | 0.9242 |
| pyogenes | MGAS2096, MGAS9429)}, | MGAS8232, MGAS10394), | |
| (Manfredo, MGAS8232, | (MGAS6180, MGAS10270, | ||
| MGAS10394), (MGAS10270), | MGAS10750), (MGAS9429, | ||
| (MGAS10750), (MGAS5005, | MGAS2096), (MGAS5005, | ||
| M1_GAS) | M1_GAS)} | ||
| aGroups are enclosed in parentheses ( ), and complexes of groups are enclosed in curly braces { }. | |||
| Strains with the same MLST sequence type (ST) are underlined. |
Neighbor Grouping by distributed genes is completely consistent with MLST grouping by eBURST, and is also highly consistent with NG by core gene sequences (Table 5). If a pair of strains that differ at only 4 base pairs can be distinguished by the presence or absence of 205 distributed genes it seems likely that distributed gene microarrays will be able to distinguish virtually all isolates. At this time the only advantages of MLST are cost and the large number of strains in some MLST databases. When distributed gene arrays and other analysis methods are widely available cost is likely to decrease dramatically, and strain typing on the basis of distributed gene composition will offer a high-resolution alternative to MLST and other DNA-based typing methods. It is also anticipated that as the databases of distributed-gene types of strains grow, their value in strain identification will surpass that of MLST.
Example 6
Neighbor Grouping Based on Core Gene Distances
We propose a new clustering approach, Neighbor Grouping (NG) that, like eBURST, is based on identity by state, but that is suitable for application to thousands of loci. The distances in Table 3 describe strictly differences of state. Those distance measures make no assumptions about whether the relatedness is through identity by descent or whether it derives from recombination and/or HGT; they simply provide a metric of the degree of relatedness. While population biologists might have an interest in the historical relationships among groups of related isolates, for epidemiological or other purposes it is sufficient to group isolates, and perhaps to estimate whether or not any of the groups are related to each other. Note that we do not call such groups “clonal complexes” because clonality implies identity by descent.
Based upon core gene sequence identity, the mean distance among S. aureus core genomes is 0.00733±0.00042 (Table 3). NG defines a pair of genomes as valid neighbors if they are significantly more closely related than are the average pair of genomes; in the case of S. aureus if their distance is less than 0.00691. On that basis neither RF122 nor MRSA252 has a valid neighbor. Two strains belong to the same group if they are nearest neighbors of each other, and all members of a group are nearest neighbors of at least one other genome in that group. On that basis there are seven groups: Group 1: (RF122), Group 2: (COL, Newman), Group 3: (JH1, JH9), Group 4: (MRSA252), Group 5: (MSSA476, MW2), Group 6: (Mu3, Mu50, N315), and Group 7 (NCTC832, USA300_FPR3757, USA300_TCH1516).
We further define a pair of groups as related if at least one member of a group has at least one valid member in the other group. On that basis Group 2 is related to Groups 3, 5, 6, and 7; thus Groups 2, 3, 5, 6 and 7 form a complex, but groups 1 and 4 are not related either to that complex or to each other (FIG. 3).
Groupings for E. coli, S. pyogenes, B. cereus, S. pneumoniae and S. enterica are summarized in Table 5.
Neighbor Grouping based on core gene sequence differences clusters strains in a way that is consistent with eBURST clustering of MLST data for the same strains, while permitting far greater resolution among strains than that provided by MLST. NG also permits estimating deeper relationships than does eBURST analysis by clustering related groups into complexes. Despite the higher resolution afforded by analysis of core gene sequences, the cost, time and effort required for whole genome sequencing precludes practical application of this approach to microbial epidemiology. Our study of six bacterial species shows that core gene sequences provide much higher resolution than does MLST, in all cases distinguishing among strains that have the same MLST ST. NG analyses are entirely consistent with MLST clustering by eBURST, yet they provide additional discriminatory power. Despite the rapid development in DNA sequencing technologies, whole-genome sequencing remains far too costly to be used in routine epidemiological studies or in many academic studies of microbial population structure. For that reason strain typing and estimating relatedness based on core gene sequences is not yet practical. However, it is both practical and cost effective to use comparative genome hybridization to microarrays of distributed gene probes both to type strains and to estimate relationships among strains by the Neighbor Grouping method. Our results show that for all six species strain typing by the presence or absence of distributed genes affords even higher resolution than does typing by sequencing the core genes.
Example 7
Production of a First Generation Custom H. influenzae Supragenome Chip
After confirming the presence of a very considerable species-level supragenome among the H. influenzae we wished to determine the distribution of both the putative “core genes” and the non-core genes making up the supragenome that were identified from the first 11 strains that we sequenced across a wide array of additional clinical strains isolated from: 1) persons with various types of infections (e.g. OM, COPD, pneumonia, meningitis, septicemia; 2) various body sites (e.g. NP, ME, blood etc.) and 3) a wide range of geographic locales. Our goals with this endeavor were to determine: 1) which of the genes in the supragenome are most prevalent; 2) which genes are associated with specific diseases or infection of specific body sites; 3) which genes tend to cluster together (if any); and most importantly 4) if each of multiple simultaneous H. influenzae isolates from a single source are genomically unique, i.e. are natural infecting populations polyclonal. This last is the ultimate test of the virulence corollary of the Distributed Genome Hypothesis (DGH). Continuing with the human genomics metaphor, these supragenome chips are analogous to comparative genome hybridization (CGH) arrays used to investigate small insertions, deletions, and regions of LOH (allelic loss resulting in loss of heterozygosity). To accomplish these goals we contracted with CombiMatrix (Seattle, Wash., USA) to produce a custom oligonucleotide chip (covering some 3300 gene clusters that we identified among the first 11 genomes sequenced) to be used for the interrogation of several H. influenzae strain libraries. Below are described the bioinformatic methodologies we employed to accomplish this task.
Sequence sources & gene finding: Genomic sequence from 10 NTHi strains and Hib were used for chip design. Published gene annotations were used for Rd and 86028-NP; annotations for R2846 and R2866 were provided by a private source. Coding sequences in the unannotated strains were identified using the AMlgene microbial gene finder which is very conservative, but has a very high positive predictive value and uses both interpolated Markov models and traditional ORF analyses to identify coding sequences. Before submission to AMlgene, contigs were concatenated with the sequence “NNNNNTTAATTAATTAANNNNN” that provides a stop codon in all reading frames, allowing for the identification of coding sequences which are gapped. AMlgene was trained on Rd and set to the low-GC parameters, following that the unannotated strains were analyzed.
Clustering Algorithm: After identifying coding sequences with AMlgene, pairwise homology between genes was identified at the nucleotide level using Nucmer (part of TIGR's MUMmer package) with the parameters “--maxmatch -f -o -1 12”. Nucmer was chosen because of its fast performance with large datasets and its ability to align sequences over long distances in the presence of gaps. An exact match of length 12 was required to seed the alignment, which is suitable given the similarity of the genomes. Nucleotide homology was chosen rather than the more sensitive protein level homology because of the unfinished nature of the data sets. After pairwise homologies were identified, genes were clustered using a custom-designed single-linkage algorithm similar to BLASTCLUST written in Perl (J. Hogg unpublished 2005). The cutoff for linkage between genes was set at 90% homology with a minimum match length at 80% of the length of the shorter sequence. Note that 90% nucleotide homology (similar to 70% AA homology) is fairly strict, but may fail to cluster divergent genes of similar origin, i.e. mosaics. This threshold was chosen to limit the difficult task of designing common probes for genes with weak homologies. Observations suggested that this worked well.
Overview and rationale: The entire set of core and non-core genes from the 27 strain NTHi supragenome were used to construct a 2nd generation NTHi gene chip using Maskless Array Synthesis technology (Roche NimbleGen, Inc., Madison, Wis., USA) which is being used to comparatively interrogate the genomes of ˜400 NTHi strains from around the world, 200 each of OME strains and nonOME strains. Maskless Array Synthesis technology has been described by Singh-Gasson S, et al. Nat. Biotechnol. 1999 October; 17(10):974-8). These data will be subjected to detailed statistical analyses to identify OME-related genes (not alleles). We will use the χ2 statistic S and a genic (as opposed to allelic) QTL-like approach for the identification of genes present in the NTHi supragenome that, individually and collectively, respectively, predispose individual strains to establish particular infections with respect to body site and clinical phenotype produced. It is unlikely that there is a single gene that confers any of these traits by itself considering the number of genes present in the supragenome and the number of different niches that the NTHi can inhabit. It is likely that there will be major genetic determinants along with clusters of minor determinants (i.e. combinations of genes) that endow certain strains with the propensity to routinely establish persistent low grade infections (such as OME)—the mark of a highly successful pathogen. We hypothesize that this phenotype of the chronic infector is distinct (and thus its genotype is also) from both the invasive phenotype and the colonizer-commensal phenotype. Because the each virulence trait is likely polygenic, with each gene contributing only a fraction to the overall phenotype, large numbers of individual strains will need to be genotyped (just as in mammalian population-based association studies) to obtain sufficient statistical power to indicate the probable importance of individual genes in contributing to each of the clinical phenotypes. Thus, we will comparatively evaluate the genic content of 400 NTHi strains, binned as to being associated with a particular phenotype or not associated with that phenotype. The results of the comparative analyses will be subjected to statistical analyses, using both gene by gene association studies and gene clustering analyses. These data will be complemented by and compared with whole genome metabolic reconstructions performed on all of the sequenced strains.
Construction of the distributed genome gene chip: We have already designed, synthesized and validated both a first-generation custom NTHi gene chip (built by CombiMatrix Corp., Mukilteo, Wash., USA to our specifications) and a second-generation custon NTHi gene chip (built by Roche Nimblegen to our specifications). The CombiMatrix chip contains probes to some 3300 gene clusters each represented by 2-4 oligonucleotides, and the Nimblegen chip contains probes to ˜3100 clusters. In the Roche Nimblegen NTHi chip each distributed gene is represented by up to 13 oligonucleotides (>10 on average) and each core and negative control gene is represented by 1-3 oligonucleotides.
Testing of the second generation NTHi distributed gene chips: Prior to their use as screening tools to interrogate the genotypes of uncharacterized NTHi genomes each lot of chips will be screened: 1) with 2 of the individual component strain DNAs to demonstrate specificity; and 2) with a cocktail of DNA prepared from all sequenced strains that will test all oligonucleotide probes. The latter test will provide us with comparative quantitative data regarding the quality of each probe as the hybridization strength of each probe should correspond directly with the number of strains possessing a member(s) of that gene cluster. Any deviation of the hybridization signal intensities from the predicted values will be useful in interpreting what may otherwise be ambiguous results when interrogating the strains with unknown genotypes.
Chip analysis methods: Fluorescent signal data will be extracted using MicroArray Imager or a similar automated software program and each slide will be normalized using the global median normalization method. Neither local normalization techniques nor background subtraction will be necessary due to slide uniformity and our need only for a binary result, but if necessary, there are 72 background spots available for this purpose. Averages of the 4 replicates for each probe will be calculated. Probes with a SD/mean>0.20 will be flagged. Probes will be identified as positive, negative, or questionable based on threshold values determined from control arrays. A strain will be marked positive for a gene from “cluster X” if any of the “cluster X” probes are positive and not flagged.
Comparative genomic screening of the OME and nonOME strain collections with the 2nd generation NTHi distributed genome chips: Comparative genomic screening of the NTHI strain collections with the 2nd generation NTHi distributed genome chips: DNA from each of the 400 NTHI strains will be purified robotically and analyzed for quality and integrity. The DNA from each strain will be nebulized and used to generate a hybridization probe to interrogate the distributed genome chips. All arrays will be hybridized using the Roche NimbleGen hybridization system and read using a laser-based microarray reader. Each NTHi genome will need to be interrogated only once because each distributed gene cluster is represented by ˜10 different probes providing cross validation. Each of the Nimblegen slides contains 4 replicates of the NTHi supragenome, thus four strains will be interrogated using a single slide. Repeats screenings will only be performed for those assays where the controls give aberrant results.
Statistical Analysis of Genic Association Studies. Overview and Rationale. The focus of this section is on the use of genetic association analyses to identify from within the entire NTHi supragenome the set of non-core genes that are associated with specific disease states, e.g. chronic OME, commensal carriage, and invasiveness. For demonstration purposes we present the analyses as they will be performed to identify chronic OME-related virulence genes. Similar analyses will be performed to identify those sets of genes which are associated with the other disease phenotypes. For identifying OME-related genes two types of NTHi strains will be distinguished: 1) those of middle-ear origin from persons with OME; and 2) those not being of middle-ear origin including invasive, septic, and commensal strains. Additional pairs of phenotypes will be considered, for example, invasive vs. non-invasive strains.
Chi-square statistic. 400 NTHI strains will be available for testing including 200 OME strains and 200 non-OME strains. A number m>3,000 of genes (gene-clusters) will have been examined, each being either present or absent in a given strain. Thus, for a given gene, certain (genic) proportions will be present in OME and non-OME strains and the aim is to determine whether the two proportions (OME versus non-OME) are significantly different. Results for each gene can be displayed in a 2×2 table, with rows corresponding to OME versus non-OME phenotypes and columns representing presence versus absence of the gene. To assess significance we will apply the likelihood ratio chi-square statistic, S, as it appears to have better properties than the Pearson chi-square statistic (Fisher, R. A. Statistical Methods for Research Workers, 14th Edition, Hafner Press. New York, 1970).
Multiple testing considerations. An experiment-wise significance level of 0.05 will be applied. To determine whether any of the genic differences are significant, we will use the largest S value, Smax, over all the genes as our overall test statistic. The empirical significance level associated with an observed Smax will be determined with randomization sampling (Manly 2007). That is, labels OME and non-OME will be randomly permuted and Smax computed for each such randomization sample as it was done for the observed data. A total of r−1 randomization samples will be generated, with the rth dataset consisting of the observed data. The proportion of samples with Smax equal to or exceeding the corresponding observed Smax is an estimate of the empirical significance level. To obtain accurate significance levels we will use values of at least r=20,000. When multiple phenotype pairs are tested, all these tests will be carried out also in each randomization sample and the maximum S value over all genes and all phenotypes will be the relevant test statistic. To determine how many of the m>3,000 genes show a significantly different proportion between OME and non-OME strains, an overall false discovery rate (FDR) of 0.05 will be postulated. We will apply the Benjamini-Hochberg form of the FDR approach (Benjamini et al Behav Brain Res 125, 279-284, 2001).
Heterogeneity. The 400 bacterial strains will come from different parts of the world. Proportions of genes present in OME and non-OME strains may vary from one geographical location to another. To assess whether such heterogeneity exists for a given gene one might apply the Mantel-Haenszel procedure (Armitage et al in Statistical methods in medical research, 4th Edition. Blackwell, Malden Mass., 2005), which examines stratified data, each stratum leading to a 2×2 table. To allow for the multiplicity of genes, we will proceed in an analogous manner but analyze each stratum (geographic location) for all genes as described above in “Multiple Testing”. That is, the data will be sub-grouped into homogeneous strata and each stratum will be analyzed separately. This will tend to lead to small samples but this does not create a problem because we assess significance by randomization testing. Each stratum will then result in a significance level, p, automatically adjusted for testing many genes. How to combine the p-values over strata is crucial—some of these methods (such as Fisher's (1970) method) lose power due to subdivision of the data (Whitlock et al., J Evol Biol 18, 1368-1373, 2005). One can show (not done here) that combining chi-values (square root of chi-square with a + sign for odds ratio>1) preserves power, that is, in the absence of heterogeneity this approach leads to the same significance level as when the data are analyzed without subdivision.
Power considerations. To see what differences of gene proportions can reasonably be detected with our sample size of 400 strains, we applied the formula, Zβ=|p1−p2|√{square root over (200)}/√{square root over (p1(1−p1)+p2(1−p2))}{square root over (p1(1−p1)+p2(1−p2))}−Zα, where Zα and Zβ are normal deviates corresponding to significance level and power, respectively, and p1 and p2 refer to two proportions of a gene present in OME versus non-OME strains (Snedecor & Cochran, Statistical methods, 6th Edition. Iowa State University Press, Iowa, 1969).
Results for the m=3,000 genes are likely to be correlated. To allow for multiple testing in our power calculations, we assumed an effective number of 3,000 independent tests (Cheverud 2001) and chose a significance level of α=0.05/3,000=0.000,017. Table 7 shows examples of pairs of values ρ1 and ρ2 that can be detected with a given power. The table also shows resulting odds ratios (OR) for 80% power. Thus, we can expect to detect differences of common genes corresponding to ORs of 3 to 4, that is, genes whose presence is associated with a 3 to 4-fold increased risk of infection.
| TABLE 7 | ||
| p2 for power of |
| p1 | 80% | 90% | OR | |
| 0.05 | 0.23 | 0.24 | 5.7 | |
| 0.10 | 0.30 | 0.32 | 3.9 | |
| 0.20 | 0.44 | 0.46 | 3.1 | |
| 0.30 | 0.55 | 0.57 | 2.9 | |
Gene-gene interactions. It is likely that several genes are determining the phenotype of a strain. Thus, it is desirable to detect sets of genes that jointly show a difference in proportions between the two strain phenotypes, a situation also encountered in human case-control association studies (Hoh and Ott, Nat Rev Genet. 4, 701-709, 2003). To find such sets of genes is a difficult statistical problem, for which several approaches have been developed but most tend to be so compute intensive that they can be applied only to a small number (<50) of genes (Nelson et al 2001, Ritchie et al 2001). We choose the sum of univariate test statistics (S values in this case) as a multivariate test statistic (Manly, Randomization, bootstrap and Monte Carlo methods in biology, 3rd Edition. Chapman & Hall/CRC, New York, 2007) and will allow for varying numbers of gene statistics contained in a sum. Specifically, test statistics for all genes will be ordered by size, S[1]<S[2]< . . . and so on. Then, sums containing different numbers of statistics will be formed. For example, T3=S[1]+S[2]+S[3] is the sum of the three largest S values among all genes tested. Sums with up to 10 summands will be formed because it appears unlikely that more than 10 genes could be identified as being jointly responsible for the OME phenotype. The significance level associated with each sum will be evaluated in permutation samples. The experiment-wise single test statistic will then be the smallest p-value observed for sums of different “lengths”, and we will determine the significance level associated with this single overall statistic using permutation testing (Hoh et al., Genome Res 11, 2115-2119, 2001). In human genetics, an analogous approach has been independently shown to be more powerful than conventional gene-by-gene analysis (Kim et al., BMC Genet. 4 Suppl 1, S9, 2003; de Quervain et al., Hum Mol. Genet.; 13(1):47-52, 2004). We will be using software developed previously (Hoh et al., Genome Res 11, 2115-2119, 2001).
The 80% match-length requirement allows for small insertions, different start codons, varying copy-numbers of tandem repeats, and other variations between otherwise similar genes. The length requirement was only applied to the shorter sequence to allow for robust clustering in the presence of fragmented data sets. For example consider an ORF that is split into two pieces due to a sequencing error that inserted a base (the most likely sequencing system error). Gene finding programs will identify both halves of the gene as separate genes. If the same gene is present in another strain without the error. the system will identify homology between the full gene and both of the fragments. If the 80% match length criterion is assessed against the short genes only, the “3 genes” will collapse into a single cluster. Starting with ˜2500 AMIgene sequences from the original 11 strains resulted in 3,300 unique gene clusters. Single-linkage clustering (as opposed to complete-linkage clustering) has a tendency to form illegitimate groups. Thus, we tracked the number of clusters (˜8%) that contained multiple genes from the same strain. Some of these are real paralogs, many are not. For the Roche NimbleGen chips we applied more sophisticated gene finding (RAST and PGAAP) and gene clustering algorithms which greatly decreased the difference in the number of annotated sequences and the number of unique gene clusters.
Probe Design: The whole genome sequences of 24 Haemophilus influenzae (Hi)strains were used for the chip design. Together these genomes contained 47,997 gene sequences predicted using RAST that were divided into 3100 orthologous clusters using the Hogg clustering algorthim (Hogg et al 2007), where sequences are at least 70% identical over 70% of their length. Approximately half of these (1538) are core clusters conserved in all the strains, while the remaining half (1562) are distributed clusters present only in a subset (1 to 23) of the strains.
To create probes that would recognize the vast majority of the allelic variations present in all the orthologous clusters, the clusters were further divided into subclusters were all sequences in each subcluster were 95% identical over 95% of the length. These parameters divided all the sequences into 4536 subclusters, 2350 core (38180 sequences) and 2186 distributed (9813 sequences).
Roche probe design software was used to create 20 probes, each 60 bases long to each subcluster. Next, probes were tested in silico by using Blast to compare each probe to all the Hi sequences. Probes where the number of hits was equal to the number of members in the subclusters were prioritized. Probes were also graded based on uniqueness, distribution within the sequence (aimed at an even distribution), and probe manufacturing parameters using Nimblegen software. For the experimental set of 2186 distributed subclusters, we used 13 probes for each subcluster (or as many as available). The final set of experimental probes contains 25,267 distinct probes. For positive controls we used up to three probes to each of the 2350 core subclusters, leading to a total of 6040 distinct probes. Finally, as negative controls we used one probe to each of 186 core Streptococcus pneumoniae sequences that contained no orthologues or conserved domains in H. influenzae. All probes were placed on the final chip in duplicate.
Step 1—Multi-sequence alignment: Genes in each cluster were aligned using the multi-sequence alignment software MUSCLE with the parameters “-cluster1 neighbor joining -cluster2 upgma” [6].
Step 2—Error-correction and consensus: At each position in the alignment, a consensus base was set to the nucleotide which is present in a majority of sequences. All aligned bases at that position were then set to the consensus. Sequences not aligned at a position (i.e. gapped) are not modified. If no base had a majority the consensus was set to “N” and no error-correction occurred.
Step 3—Identification of Probe Design Sequence: In this step we identify regions of sequence which are common to many genes in the cluster. The algorithm is:
1. A window of length 60 slides across the multi-sequence alignment in increments of 20 bases. At each window position, a list of sequences which are aligned to the consensus is generated and saved.
2. Overlapping windows are merged to form longer windows if the lists of aligned sequences are identical.
3. A score equal to the number of aligned sequences is assigned to each window.
4. The window with the highest score is chosen as a Probe Design Sequence (PDS). If more than one window shares the highest score, then the longest window is chosen.
5. Unless the PDS in (4) is aligned with all sequences and is >than 240 bases (or ½ the length of the multi-alignment), Step 4 is repeated using the window with the next highest score and the following provisions:
1. A window is excluded if it overlaps any previously chosen PDS.
2. A window is given priority if its list of designed sequences includes sequences that are not already included in any of the previously chosen PDS.
Occasionally after steps 3-5 there remained sequences which were not aligned to one of the PDS. These situations will be further evaluated when the experimental evidence is available.
Step 4—Probe design: Both CombiMatrix and Roche Nimblegen provide a “Design-On-Demand” service which, given a set of target sequences, will design probes with optimal thermodynamic properties and minimal cross-hybridization. After selection of PDS's, their consensus sequences were submitted to CombiMatrix and Roche NimbleGen where multiple probes were designed for each PDS. Probe lengths were set to 35-40 bases with Tm's between 65 and 70° C. for the Combimetrix chips and for the Roche NimbleGen chips.
Step 5—Quality control and evaluation: Performance of probes was evaluated by in silico experiments. All probes were BLAST (word size=7) against genes from the 11 strains and evaluated for false-positives based on expectation values of matches. Probes were discarded if a match of E<1e−7 was identified against background (non-coding sequence) or a non-target cluster. When experimental results are obtained for strains used in the design, the data will be compared with the in silico results and used for optimization of version 2.
Scheme for in silico evaluation of probe matches: 1) Positive: E<1−10—this corresponds to a full-length blast match between the probe and gene with one (or rarely two) mismatches. With appropriate hybridization conditions these matches should yield consistent positive results. 2) Questionable: 1−7<E<1−10—this corresponds to a partial blast match that may indicate an experimental result that is difficult to interpret. 3) Negative: E<1−7—while a weak match is detectable in silico, these will be negative in actual experiments
Step 6—Final design: The remaining probes were submitted to CombiMatrix for chip construction. Probes were spotted in duplicate with 2-4 probes/gene cluster. Location of probes was randomized to limit the effects of spatial variation during hybridization. Eight negative controls with 12 replicates each were included for background normalization. Negative controls were selected from the genome of Methanosarcina mazei Goel (chosen for its evolutionary distance and similar GC content). Negative controls were BLAST against all NTHi strains for verification. Eight positive controls (clusters represented in all 11 strains) were included with seven replicates each. These controls are used to evaluate the hybridization variance.
Example 8
Testing of a First Generation NTHi Supragenome Chip
High molecular weight NTHi genomic DNA (15-20 μg) was sheared to an average size of ˜300 bp using a nebulizer, column purified, quantified, and analyzed for size distribution using the Agilent Bioanalyzer. These probe DNAs were biotin labeled, washed and hybridized against the supra-genome chip. After hybridization and washing the probe DNA was reacted with Cy5-labeled streptavidin. Slides were read in a GenePix microarray scanner, followed by analysis using Goldlink software.
For our initial tests of the supragenome chip we prepared probes from both an OME strain, PittEE, and an invasive strain, PittII. These strains were chosen as PittEE had the smallest and Pitt II the largest genomes sequenced to that point. Moreover these 2 strains have nearly 500 genic differences and therefore each strain should hybridize to substantially different subsets of the distributed genes. Every probe represented on the chip was BLAST separately against both the PittEE and PittII genomic sequences and the best “match score” for each oligo for each strain was recorded. The match score for each oligo was compared to the median florescent intensity on the hybridized arrays and thresholds for positive oligos and positive match scores were determined by inspection so that the agreement between the two parameters was maximized. A BLAST match score for an oligo with an e value of ˜1-7 or less (a perfect match is 1-12) was used as positive, as was a hybridization result with a fluorescent intensity of 3500 out of a 65,535 maximum for Pitt II. An analysis of the control oligos gave 0.12 as typical for SD/mean. Applying these criteria to the actual results produced 97% agreement with the in silico predictions for both strains. This translated to correlation values of 0.9394 and 0.9294 for PittEE and PittII, respectively. In addition to comparing our actual hybridization data with the in silico hybridization analyses, we also checked the set of PittEE genes and the set of PittII genes from the sequence data used to design the supragenome chip against the supragenome chip to identify those oligos that should have shown hybridization for each strain. This analysis also produced results for both strains that were above 97% agreement. It is important to point out that these high levels of agreement were achieved with our first two runs of the entire system without performing any filtering; as we develop filters and learn the behavior of specific probes we should achieve even higher correlations. The fidelity and robustness of this system is clearly satisfactory for the screening of unknown genomes.
Example 9
Determination of the Number of Distributed Genes Needed to Resolve Bacterial Strains
There are two criteria for the minimum number of distributed genes required: (1) The minimum number required to resolve the most closely related genomes, and (2) the minimum number that will provide a reliable estimate of relationships among isolates by the Neighbor Grouping (NG) method. For (1) about 300 genes are required.
To estimate (2) NG_from_scores was run on random subsets of the genes, with decreasing number of genes in the subset. For each subset size 10 randoms subsets were generated and NG was run on each. The resulting grouping was compared with the grouping generated by the full set of distributed genes to yield a comparison score, and mean±s.e. of those scores was calculated for each subset size. The criterion for a “good” subset is that it, and all larger subsets, must generate a score ≧0.97. The plot provided in FIG. 4 shows N, the number of distributed genes in supragenome, versus the size of the “good” subset that will generate a score of 0.97.
The same plot is shown in FIG. 5 for species for which the number of distributed genes in the supragenome is <4000. These plots suggest that when N≦4000 the minimum reliable subset is about 250+0.5N genes, and when N>4000 the minimum is about 2500 genes. That accounts for all results except E. coli (22 genomes) estimated by the Hall method from closed genomes.
Example 10
A Method for Identifying Distributed Genes when a Set of Non-Overlapping Genomic Sequences Comprising an Essentially Complete Genomic Sequence is Available
A method for identifying distributed genes when a set of non-overlapping genomic sequences comprising an essentially complete genomic sequence is available for each strain in said representative set for a given bacterial species is as follows. A sequential series of program files are used. The input to this process are fasta files composed of contigs for every genome being analyzed. The ultimate objective is to create three main files that describe the number of genes which are found in all genomes (core), and the genes found in variable numbers of the genomes (distributed). The steps of this pipeline are detailed as follows:
-
- 1) Upload fasta contig files to Argonne National Laboratory online annotation server, RAST. This website is located at http://rast.nmpdr.org/. Annotate all genomes.
- 2) Download genbank files for each annotated genome from this site.
- 3) Run fasta and tfasty alignments using nucleotide sequences of the genes from contig files, and protein sequences from genbank files. This software is freely available online at http://fasta.bioch.virginia.edu/fasta/fasta_list.html. Command line parameters for:
- Fasta: -H -E 1 -m 9 -n -Q -d 0
- Tfasty: -H -E 1 -m 9 -p -Q -d 0
- 4) The coding sequences and the alignment files are then used in the custom made clustering program. The clustering program evaluates the similarities of the genes based on the percent of correct matches produced by the fasta and tfasty alignments.
- 5) The output of the clusterGenes.pl files (called simply clusterGenes) is the input for clusterReport.pl. The program clusterReport.pl output file is clusterReport and pairwise_comparison_output.txt.
- 6) The file pairwise_comparison_output.txt is then run through an excel macro which formats a matrix of information about pairwise comparisons between the genomes.
The files clusterGenes, clusterReport, and pairwise_comparison_output.xls contain all information about core, and distributed genes in all genomes. A neighbor grouping analysis can be run with formatCG.pl and JNG.pl, this will output an image of a minimum spanning tree grouping all strains together, as well as a log file of a matrix of all the distances between all strains, as well as “groups” of neighbors (the threshold of a neighbor being one standard deviation).
The minimum program files required for this process are: a web browser (to access to annotation software and download any required free software), fasta, tfasty, SequenceList.pm, Sequence.pm, cgs.pm, clusterGenes.pl, clusterReport.pl, formatCG.pl, and JNG.pl.
The program clusterGenes.pl usage(from command line in linux): perl clusterGenes.pl all_fasta_sequences tfasty_output fasta_output>clusterGenes
(1) all_fasta_sequences: a multi-fasta file containing the nucleotide sequences of ORFS from all strains
(2) tfasty_output: the output of a ‘tfasty3x’ all-against-all 6-frame translation homology search, format -m 9.
(3) fasta_output: the output of a ‘fasta3x’ all ORFS versus all genomic sequence homology search, format -m 9
In addition the program must be changed internally. The @STRAINS array must be changed to include all strain names which are included in the supragenome. All parameters and report types may also be changed in the beginning of the program file. For example $GENERATE_ALIGNMENTS should be set to ‘0’. Default values for the rest should be fine. All other default values should be fine, all necessary program requirements should be kept in the same directory as the program file.
The program clusterReport.pl usage(from command line in linux):
1) perl clusterReport.pl clusterGenes>clusterReport
2) clusterGenes: output from clusterGenes.pl (see above)
In addition the program must be changed internally. The @STRAINS array must be changed to include all strain names which are included in the supragenome. All parameters and report types may also be changed in the beginning of the program file. Default values should be fine, all necessary program requirements should be kept in the same directory as the program file.
The program FormatCG.pl and JNG.plusage (from command line in linux):
1) perl formatCG.pl
2) perl JNG.pl
In the file formatCG.pl the first two filehandles CR and RO (line 8 and 9) should be changed to clusterGenes and clusterReport file names from the output of clusterGenes.pl and clusterReport.pl, respectively. After running formatCG.pl and JNG.pl the two important output files are the myNNlogfile and the graph.ps image file of the minimum spanning tree.
Various patent and non-patent publications are cited herein. Documents cited herein as being available from the World Wide Web at certain internet addresses. Certain biological sequences referenced herein by their “NCBI Accession Number” can be accessed through the National Center of Biotechnology Information on the world wide web at ncbi.nlm.nih.gov.
As various modifications could be made in the constructions and methods herein described and illustrated without departing from the scope of the invention, it is intended that all matter contained in the foregoing description or shown in the accompanying drawings shall be interpreted as illustrative rather than limiting. Thus, the breadth and scope of the present invention should not be limited by any of the above-described exemplary embodiments.
Claims
What is claimed is:1. A method of identifying and distinguishing a bacterial strain within a species from another bacterial strain in the same species, the method comprising:
examining a sample of a bacterial species, the sample having a plurality of strains, the strains having a plurality of core genes that are common to all of the strains and a plurality of distributed genes that are not common to all strains of the species;
selecting a strain of interest based on possession of a unique genetic characteristic that is present in only the strain of interest and not in the other strains;
examining the distributed genes possessed by the strain of interest;
accessing a database of information corresponding to known strains of bacterial species;
comparing data gathered in the examining of the distributed genes with data from the database;
detecting gene-possession variation in the distributed genes of the sample strains as compared to genes of the known strains; and
identifying the bacterial strain of the sample strain based on the detected gene-possession variation.
2. The method of claim 1, wherein the examining of the distributed genes in the sample strain comprises use of a gene array.
3. The method of claim 1, wherein the examining of the distributed genes in the sample strain comprises mass spectrometry to provide base composition analysis based on molecular weight, or a combination thereof.
4. The method of claim 1, wherein the examining of the distributed genes in the sample strain comprises DNA sequencing.
5. The method of claim 1 further comprising correlating the gene-possession variation with a phenotypic character change in a host eukaryotic organism.
6. The method of claim 5, wherein the phenotypic character change is selected from pathogenesis, virulence, drug resistance, viability and combinations thereof.
7. The method of claim 1 wherein the bacterial species is selected from the group consisting of Bacillus anthracis, Borrelia burgdorferi, Bacillus cereus, Burkholderia mallei, Clostridium botulinum, Clostridium difficile, Campylobacter jejuni, Clostridium perfringens, Escherichia coli, Haemophilus influenzae, Gardnerella vaginalis, Listeria monocytogenes, Moraxella catarrhalis, Mycobacterium tuberculosis, Pseudomonas aeruginosa, Streptococcus agalactiae, Staphylococcus aureus, Salmonella enterica, Shigella, Streptococcus pneumoniae, Yersinia pestis, Burkholderia pseudomallei, Streptococcus pyogenes and combinations thereof.
8. The method of claim 1, wherein the identity is also based on phenotypic potential.
9. A method of identifying a bacterial strain within a species from a sample, comprising:
examining a bacterial species sample comprising at least two strains, wherein the strains possess a plurality of core genes common to all of strains and a plurality of distributed genes that are not common to all of the strains;
depositing a first set of polynucleotide capture probes for less than half of the core genes at corresponding addresses on a substrate, each probe corresponding to an address of one of the core genes;
depositing a second set of polynucleotide capture probes corresponding to the set of distributed genes on the substrate;
examining, with the second set of probes, the set of distributed genes to detect gene-possession variation between genes in the set;
comparing data gathered in the examining of the distributed genes with data from a database of information corresponding to known strains of bacterial species; and
identifying the bacterial strain of the sample based on the detected gene-possession variation.
10. The method of claim 9 wherein said bacterial species is selected from the group consisting of Bacillus anthracis, Borrelia burgdorferi, Bacillus cereus, Burkholderia mallei, Clostridium botulinum, Clostridium difficile, Campylobacter jejuni, Clostridium perfringens, Escherichia coli, Gardnerella vaginalis, Listeria monocytogenes, Moraxella catarrhalis, Mycobacterium tuberculosis, Haemophilus influenzae, Listeria monocytogenes, Mycobacterium tuberculosis, Pseudomonas aeruginosa, Streptococcus agalactiae, Staphylococcus aureus, Salmonella enterica, Shigella, Streptococcus pneumoniae, Yersinia pestis, Burkholderia pseudomallei, Streptococcus pyogenes and combinations thereof.
11. The method of claim 9, wherein the substrate comprises a pool of addressable particles on a two-dimensional solid surface.
12. The method of claim 9, wherein the substrate is selected from the group consisting of a glass, a polymer or combinations thereof.
Images & Drawings included:
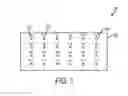
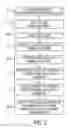
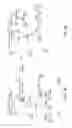

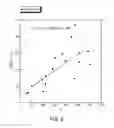
Sources:
- United States Patent and Trademark Office - verify current appl. status at the USPTO↗
Recent applications in this class:
- » 20250171831 2025-05-29
SELECTIVE OXIDATION OF 5-METHYLCYTOSINE BY TET-FAMILY PROTEINS - » 20250163499 2025-05-22
PRIMER AND PROBE COMPOSITION FOR CAT BLOOD TYPE DETECTION, DETECTION METHOD, AND USE - » 20250154563 2025-05-15
OPTIMIZATION OF MULTIGENE ANALYSIS OF TUMOR SAMPLES - » 20250154562 2025-05-15
METHODS FOR VARIANT DETECTION - » 20250154561 2025-05-15
Method for detection of single nucleotide variant - » 20250137038 2025-05-01
SENSITIVITY AND ESTIMATION OF TUMOR-INFORMED MINIMAL RESIDUAL DISEASE PANELS - » 20250137037 2025-05-01
METHODS FOR VARIANT DETECTION - » 20250115952 2025-04-10
A METHOD FOR REPRODUCIBLE APTAMER SELECTION USED TO IDENTIFY APTAMERS THAT BIND TO UNKNOWN BIOMARKERS - » 20250092445 2025-03-20
PRIMER SET AND GENE CHIP METHOD FOR DETECTING SINGLE BASE MUTATION - » 20250084466 2025-03-13
DEVICES, KITS, AND METHODS FOR DETERMINING INCREASED SUSCEPTIBILITY TO AND TREATMENT AND PREVENTION OF PERIODONTITIS, ALZHEIMER’S DISEASE, AND OTHER CONDITIONS
Recent applications for this Assignee:
- » 20240006068 2024-01-04
Computer-based tools and techniques for optimizing emergency medical treatment - » 20210222003 2021-07-22
Hydrophilic polyarylene ether ketone polymer and methods of forming same - » 20200291570 2020-09-17
Preparation and characterization of organic conductive threads as non-metallic electrodes and interconnects - » 20200281497 2020-09-10
Conductive fiber with polythiophene coating - » 20190302112 2019-10-03
Methods and systems using C4 gene copy number and cell-bound complement activation products for identification of lupus and pre-lupus - » 20190251825 2019-08-15
Method and system for monitoring hand hygiene compliance - » 20180273475 2018-09-27
Hydrophilic fentanyl derivatives - » 20180067104 2018-03-08
Isolation of pulmonary arterial endothelial cells from patients with pulmonary vascular disease and uses thereof - » 20170067893 2017-03-09
Cell-bound complement activation products as diagnostic biomarkers for pre-lupus - » 20170030905 2017-02-02
Cell-bound complement activation product assays as companion diagnostics for antibody-based drugs