PLASMID STANDARD FOR USE IN QUANTITATIVE ASSAYS USING FLUORESCENT QUANTITATIVE PCR
US20130217115A1
2013-08-22
13/880,373
2011-10-18
Abstract:
Disclosed is a plasmid standard for use in fluorescent quantitative PCR assays. More specifically, the present invention provides a plasmid standard as well as amplification primers and detection probes thereof for use in the detection of gene mutation and expression amount.
Interested in similar patents?
Get notified when new applications in this technology area are published.
Classification:
C12Q1/6876 » CPC main
Measuring or testing processes involving enzymes, nucleic acids or microorganisms ; Compositions therefor; Processes of preparing such compositions involving nucleic acids Nucleic acid products used in the analysis of nucleic acids, e.g. primers or probes
C12Q1/68 IPC
Measuring or testing processes involving enzymes, nucleic acids or microorganisms ; Compositions therefor; Processes of preparing such compositions involving nucleic acids
Description
CROSS REFERENCE TO RELATED APPLICATIONS
This application claims the priority of Chinese Patent Application No. 201010509523.0, filed on Oct. 18, 2010, the disclosure of which is incorporated herein by reference.
TECHNICAL FIELD
The present invention relates to plasmid. Specifically, the present invention relates to plasmid standards for quantitative detection by fluorescent quantitative PCR.
BACKGROUND OF THE INVENTION
Fluorescent quantitative PCR was first reported by Higuchi, a Japanese scientist, in 1992. It refers to adding a fluorescent group into PCR reaction system. The variation of the fluorescent energy emitted under light stimulation directly reflects the variation of PCR amplification product. The variation of fluorescent signal is in proportion to that of amplification product. It is possible to quantify the amount of original template by collecting and analyzing the fluorescent signal using an automated instrument with sufficient sensitivity, and finally analyzing the unknown template via a standard curve.
There are two methods to quantify the template in fluorescent real-time PCR: absolute quantification method and relative quantification method [Walker N J, J Biochem Mol Toxicol, 2001, 15(3): 121-127]. Absolute quantification method is a method for determining the absolute amount (copy number) of an unknown sample. Contrarily, the relative quantification method is not a method for determining the absolute amount of a gene. It is for determining the amounts of a gene of interest and internal reference gene respectively, normalizing the amount of gene of interest to that of the internal reference gene, and then comparing the relative amount among samples.
The analysis method for absolute quantification to preparing a standard curve using a standard with known concentration, and then testing the absolute amount (copy number) of the sample with unknown concentration. Therefore, the standard which has a known absolute amount (copy number) and contains unknown sample sequence is necessary. To keep consistency with the PCR amplification efficiency of the sample to be tested, the standard should be chosen so that its structure is similar to that of the sample to be tested. It has been verified that plasmid standard molecule is a very good substitute for the standard positive substance in GMO identification test. The advantages of plasmid are: they can be obtained in large scale via microorganism cultivation, the DNA can be easily amplified, so that it is possible to provide unlimited amount of standard substance with high purity. The operation is easy and stable. Moreover, one standard molecule can contain several exogenous target genes, which means economical and high efficacy. Thus, the plasmid standard molecule can be called “golden standard substance”.
To prepare a standard curve, one should prepare 4-6 gradiently diluted standards, then obtain individual Ct value for each one of them by Real Time PCR using these standards as templates. The standard curve can be prepared based on the linear relationship between the Ct values and the logarithm values of original template concentrations.
Although molecular mechanisms of tumorigenesis are not fully elucidated, it is commonly accepted that accumulation of genetic changes of related genes is the fundamental cause for the change of carcinogenicity. The increase of expression and mutation of oncogene can occur at early and benign stage in many tumors. Fluorescent quantitative real-time PCR can not only efficiently detect gene mutations, but also accurately determine amount of gene expressions. Thus, it is possible to carry out early diagnosis, treatment and prognosis of tumor based on this technology. The detection of genetic changes for some oncogenes can make almost definite diagnosis.
The plasmid vector for fluorescent quantitative real-time PCR used in the present invention has the following advantages:
1. The process of preparation and treatment is simple and easy, the experimental cycle is short, and the experimental procedures can be easily standardized.
2. The price is moderate, and thus it can be easily adopted.
3. The unique advantage of the present invention is accurate quantification. Using fluorescent real-time PCR amplification curve parameters, we can quantatively determine the copy number of genes in the samples.
4. Human errors during experiments can be reduced.
SUMMARY OF THE INVENTION
The question that the present invention addresses is to provide a positive standards for gene mutation detection, expression detection and gene amplification detection.
To address the above question, the present invention provides the following solutions:
(1) constructing a plasmid vector, which contains a gene sequence to be detected.
(2) a plasmid vector according to (1) above, which is selected from TA clone vector, preferably pMD18-T.
(3) a plasmid vector according to (1) above, wherein the gene to be detected is integrated into the vector.
BRIEF DESCRIPTION OF DRAWINGS
The accompanying drawings, which are incorporated in and form a part of this specification, illustrate embodiments of the technology and together with the description.
FIG. 1 is a diagram showing the method for constructing the plasmid control in Example 2.
FIG. 2 is a diagram showing the plasmid profile of Example 2, wherein the PCR product sequence is inserted into the vector at the position marked with an arrow.
FIG. 3 is a diagram showing the result of sequencing the wild-type plasmid standard of Example 2, wherein Fig.A is the sequencing result of EGFR Exon 18 position 2155G wild-type plasmid, Fig.B is the sequencing result of EGFR Exon 19 position 2235-2249, position 2236-2250, and position 2254-2277 wild-type plasmid, Fig.C is the sequencing result of EGFR Exon 21 position 2573T wild-type plasmid
FIG. 4 is a diagram showing the result of sequencing the mutant plasmid standard of Example 2, wherein the mutant site is marked with an arrow. Fig.A is the sequencing result of EGFR Exon 18 position 2155 G→A mutant plasmid, Fig.B is the sequencing result of EGFR Exon 19 position 2235-2249 deletion plasmid, FIG.C is the sequencing result of EGFR Exon 19 position 2236-2250 deletion plasmid, Fig.D is the sequencing result of EGFR Exon 19 position 2254-2277 deletion plasmid, Fig.E is the sequencing result of EGFR Exon 21 position 2573 T→G mutant plasmid.
FIG. 5 is a diagram showing the result of sequencing the KRAS wild-type plasmid of Example 3.
FIG. 6 is a diagram showing the result of sequencing the mutant plasmid standard of Example 3, wherein the mutant site is marked with an arrow. Fig.A is the sequencing result of KRAS Codon 12 GGT→GTT mutant plasmid, Fig.B is the sequencing result of KRAS Codon 12 GGT→AGT mutant plasmid, FIG.C is the sequencing result of KRAS Codon 12 GGT→GAT mutant plasmid, Fig.D is the sequencing result of KRAS codon 12 GGT→TGT mutant plasmid, Fig.E is the sequencing result of KRAS codon 13 GGC→GAC mutant plasmid.
FIG. 7 is a diagram showing the result of sequencing the BCRP wild-type plasmid of Example 4.
FIG. 8 is a diagram showing the result of sequencing the mutant plasmid standard of Example 4, wherein the mutant site is marked with an arrow. Fig.A is the sequencing result of BCRP Codon 482 AGG→GGG mutant plasmid, Fig.B is the sequencing result of BCRP Codon 482 AGG→ACG mutant plasmid.
FIG. 9 is a diagram showing the result of sequencing the BRAF wild-type plasmid of Example 5.
FIG. 10 is a diagram showing the result of sequencing the mutant plasmid standard of Example 5, wherein the mutant site is marked with an arrow.
FIG. 11 is a diagram showing the result of sequencing the plasmid for detecting ERCC1 expression in Example 6.
FIG. 12 is a diagram showing the result of sequencing the plasmid for detecting RRM1 expression in Example 7.
FIG. 13 is a diagram showing the result of sequencing the plasmid for detecting BRCA1 expression in Example 8.
FIG. 14 is a diagram showing the result of sequencing the plasmid for detecting TUBB3 expression in Example 9.
FIG. 15 is a diagram showing the result of sequencing the plasmid for detecting ERBB3 expression in Example 10.
FIG. 16 is a diagram showing the result of sequencing the plasmid for detecting TOP2A expression in Example 11.
FIG. 17 is a diagram showing the result of sequencing the plasmid for detecting TYMS expression in Example 12.
FIG. 18 is a diagram showing the result of sequencing the plasmid for detecting RAP-80 expression in Example 13.
FIG. 19 is a diagram showing the result of sequencing the plasmid for detecting VEGFR1 expression in Example 14.
FIG. 20 is a diagram showing the result of sequencing the plasmid for detecting VEGFR2 expression in Example 15.
FIG. 21 is a diagram showing the result of sequencing the plasmid for detecting HER2 expression in Example 16.
FIG. 22 is a diagram showing the result of sequencing the plasmid for detecting EGFR expression in Example 17.
FIG. 23 is a diagram showing the result of sequencing the plasmid for detecting VEGF expression in Example 18.
FIG. 24 is a diagram showing the result of sequencing the plasmid for detecting PPN expression in Example 19.
FIG. 25 is a diagram showing the result of sequencing the plasmid for detecting CCNB2 expression in Example 20.
FIG. 26 is a diagram showing the result of sequencing the plasmid for detecting ACTB expression in Example 21.
FIG. 27 is a diagram showing the result of sequencing the plasmid for detecting 18S rRNA expression in Example 22.
FIG. 28 is a diagram showing the result of sequencing the plasmid for detecting HER2 gene amplification in Example 23.
FIG. 29 is a diagram showing the result of sequencing the plasmid for detecting ACTB gene amplification in Example 8.
FIG. 30 is a diagram showing the amplification curve of the plasmid standard of Example 25. Fig.A1 shows the amplification curve of EGFR Exon 18 position 2155G wild-type plasmid standard, Fig.A2 shows the amplification curve of EGFR Exon 19 position 2235-2249, 2236-2250 and 2254-2277 wild-type plasmid standard, Fig.A3 shows the amplification curve of EGFR Exon 21 position 2573T wild-type plasmid standard, Fig.A4 shows the amplification curve of EGFR Exon 18 position 2155 G→A mutant plasmid standard, Fig.A5 shows the amplification curve of EGFR Exon 19 position 2235-2249 deletion plasmid standard, Fig.A6 shows the amplification curve of EGFR Exon 19 position 2236-2250 deletion plasmid standard, Fig.A7 shows the amplification curve of EGFR Exon 19 position 2254-2277 deletion plasmid standard, Fig.A8 shows the amplification curve of EGFR Exon 21 position 2573 T→G mutant plasmid standard, Fig.B1 shows the amplification curve of KRAS wild-type plasmid standard, Fig.B2 shows the amplification curve of KRAS Codon 12 GGT→GTT mutant plasmid standard, Fig.B3 shows the amplification curve of KRAS Codon 12 GGT→AGT mutant plasmid standard, Fig.B4 shows the amplification curve of KRAS Codon 12 GGT→GAT mutant plasmid standard, Fig.B5 shows the amplification curve of KRAS Codon 12 GGT→TGT mutant plasmid standard, Fig.B6 shows the amplification curve of KRAS Codon 13 GGC→GAC mutant plasmid standard, Fig.C1 shows the amplification curve of BCRP wild-type plasmid standard, Fig.C2 shows the amplification curve of BCRP Codon 482 AGG→GGG mutant plasmid standard, Fig.C3 shows the amplification curve of BCRP Codon 482 AGG→ACG mutant plasmid standard, Fig.D 1 shows the amplification curve of BRAF wild-type plasmid standard, Fig.D2 shows the amplification curve of BRAF Codon 600 GTG→GAG mutant plasmid standard.
FIG. 31 shows the standard curves based on FIG. 30. Fig.A1 shows the standard curve of EGFR Exon 18 position 2155G wild-type plasmid standard, Fig.A2 shows the standard curve of EGFR Exon 19 position 2235-2249, 2236-2250 and 2254-2277 wild-type plasmid standard, Fig.A3 shows the standard curve of EGFR Exon 21 position 2573T wild-type plasmid standard, Fig.A4 shows the standard curve of EGFR Exon 18 position 2155 G→A mutant plasmid standard, Fig.A5 shows the standard curve of EGFR Exon 19 position 2235-2249 deletion plasmid standard, Fig.A6 shows the standard curve of EGFR Exon 19 position 2236-2250 deletion plasmid standard, Fig.A7 shows the standard curve of EGFR Exon 19 position 2254-2277 deletion plasmid standard, Fig.A8 shows the standard curve of EGFR Exon 21 position 2573 T→G mutant plasmid standard, Fig.B 1 shows the standard curve of KRAS wild-type plasmid standard, Fig.B2 shows the standard curve of KRAS Codon 12 GGT→GTT mutant plasmid standard, Fig.B3 shows the standard curve of KRAS Codon 12 GGT→AGT mutant plasmid standard, Fig.B4 shows the standard curve of KRAS Codon 12 GGT→GAT mutant plasmid standard, Fig.B5 shows the standard curve of KRAS Codon 12 GGT→TGT mutant plasmid standard, Fig.B6 shows the standard curve of KRAS Codon 13 GGC→GAC mutant plasmid standard, Fig.C1 shows the standard curve of BCRP wild-type plasmid standard, Fig.C2 shows the standard curve of BCRP Codon 482 AGG→GGG mutant plasmid standard, Fig.C3 shows the standard curve of BCRP Codon 482 AGG→ACG mutant plasmid standard, Fig.D1 shows the standard curve of BRAF wild-type plasmid standard, Fig.D2 shows the standard curve of BRAF Codon 600 GTG→GAG mutant plasmid standard.
FIG. 32 shows the amplification curves of fluorescent quantitative PCR for EGFR Exon 21 position 2573 wild-type (Fig.A1) and T→G replacement (Fig.A2) in tissue sample; fluorescent quantitative PCR for EGFR Exon 19 wild-type (Fig.A3) and position 2235-2249 deletion (Fig.A4) in tissue sample; fluorescent quantitative PCR for EGFR Exon 19 position 2236-2250 deletion (Fig.A5) in whole blood; fluorescent quantitative PCR for EGFR position 2254-2277 deletion (Fig.A6) in whole blood sample; fluorescent quantitative PCR for EGFR Exon 18 position 2155 wild-type (Fig.A7) and G→A replacement (Fig.A8) in cell line sample; fluorescent quantitative PCR for KRAS Codon 12 wild-type (Fig.B1) and GGT→TGT mutant (Fig.B2) in paraffin embedded tissues; fluorescent quantitative PCR for KRAS Codon 12 wild-type (Fig.B3) and GGT→GTT mutant (Fig.B4) in fresh tissue; fluorescent quantitative PCR for KRAS Codon 13 wild-type (Fig.B5) and GGC→GAC mutant (Fig.B6) in whole blood; fluorescent quantitative PCR for KRAS Codon 12 wild-type (Fig.B7) and GGT→AGT mutant (Fig.B8) in cell line sample; fluorescent quantitative PCR for BCRP Codon 482 wild-type (Fig.C1) and AGG→GGG mutant (Fig.C2) in paraffin embedded tissue sample; fluorescent quantitative PCR for BCRP Codon 482 wild-type (Fig.C3) and AGG→ACG mutant (Fig.C4) in fresh tissue sample; fluorescent quantitative PCR for BCRP Codon 482 wild-type (Fig.C5) and AGG→ACG mutant (Fig.C6) in whole blood sample; fluorescent quantitative PCR for BCRP Codon 482 wild-type (Fig.C7) and AGG→GGG mutant (Fig.C8) in cell line sample; fluorescent quantitative PCR for BCRP Codon 482 wild-type (Fig.C5) and AGG→ACG mutant (Fig.C6) in whole blood sample; fluorescent quantitative PCR for BRAF Codon 600 wild-type (Fig.D1) and GTG→GAG mutant (Fig.D2) in paraffin embedded tissue sample; fluorescent quantitative PCR for BRAF Codon 600 wild-type (Fig.D3) and GTG→GAG mutant (Fig.D4) in fresh tissue sample; fluorescent quantitative PCR for BRAF Codon 600 wild-type (Fig.D5) and GTG→GAG mutant (Fig.D6) in whole blood sample; fluorescent quantitative PCR for BRAF Codon 600 wild-type (Fig.D7) and GTG→GAG mutant (Fig.D8) in cell line sample; detected in Example 25,
FIG. 33 is a diagram showing the amplification curve of the plasmid standard of Example 26. Fig.A1 shows the amplification curve of ERCC1 plasmid standard, Fig.A2 shows the amplification curve of RRM1 plasmid standard, Fig.A3 shows the amplification curve of BRCA1 plasmid standard, Fig.A4 shows the amplification curve of TUBB3 plasmid standard, Fig.A5 shows the amplification curve of ERBB3 plasmid standard, Fig.A6 shows the amplification curve of TOP2A plasmid standard, Fig.A7 shows the amplification curve of TYMS plasmid standard, Fig.A1 shows the amplification curve of ERCC1 plasmid standard, Fig.A8 shows the amplification curve of RAP-80 plasmid standard, Fig.A9 shows the amplification curve of VEGFR1 plasmid standard, Fig.A10 shows the amplification curve of VEGFR2 plasmid standard, Fig.A11 shows the amplification curve of HER2 plasmid standard, Fig.A12 shows the amplification curve of EGFR plasmid standard, Fig.A13 shows the amplification curve of VEGF plasmid standard, Fig.A14 shows the amplification curve of PPN plasmid standard, Fig.A15 shows the amplification curve of CCNB2 plasmid standard, Fig.A16 shows the amplification curve of ACTB plasmid standard, Fig.A17 shows the amplification curve of 18S rRNA plasmid standard.
FIG. 34 shows the standard curves based on FIG. 33. Fig.A1 shows the standard curve of ERCC1 plasmid standard, Fig.A2 shows the standard curve of RRM1 plasmid standard, Fig.A3 shows the standard curve of BRCA1 plasmid standard, Fig.A4 shows the standard curve of TUBB3 plasmid standard, Fig.A5 shows the standard curve of ERBB3 plasmid standard, Fig.A6 shows the standard curve of TOP2A plasmid standard, Fig.A7 shows the standard curve of TYMS plasmid standard, Fig.A1 shows the standard curve of ERCC1 plasmid standard, Fig.A8 shows the standard curve of RAP-80 plasmid standard, Fig.A9 shows the standard curve of VEGFR1 plasmid standard, Fig.A10 shows the standard curve of VEGFR2 plasmid standard, Fig.A11 shows the standard curve of HER2 plasmid standard, Fig.A12 shows the standard curve of EGFR plasmid standard, Fig.A13 shows the standard curve of VEGF plasmid standard, Fig.A14 shows the standard curve of PPN plasmid standard, Fig.A15 shows the standard curve of CCNB2 plasmid standard, Fig.A16 shows the standard curve of ACTB plasmid standard, Fig.A17 shows the standard curve of 18S rRNA plasmid standard.
FIG. 35 is a diagram showing the amplification curve of the samples detected in Example 26, which are, from left to right, 18S rRNA, ACTB, ERCC1, TYMS, RRM1, BRCA1, TUBB3, TOP2A, PPN, VEGF, EGFR, CCNB2, VEGFR1, RAP-80, HER2, ERBB3, VEGFR2 genes.
FIG. 36 is a diagram showing the amplification curve of the standard of Example 27, wherein Figure A shows the amplification curve of HER2 plasmid standard, Figure B shows the amplification curve of ACTB plasmid standard.
FIG. 37 shows the standard curves based on FIG. 36. Fig.A1 shows the standard curve of HER2 plasmid standard, Fig.B shows the standard curve of ACTB plasmid.
FIG. 38 is a diagram showing the gene amplification curve of the sample of Example 27, wherein Figure A shows the amplification curve of HER2 in paraffin embedded tissue, Figure B shows the amplification curve of HER2 in fresh tissue, Figure C shows the amplification curve of ACTB in paraffin embedded tissue, Figure D shows the amplification curve of ACTB in fresh tissue.
DETAILED DESCRIPTION OF PARTICULAR EMBODIMENTS
Examples
The following examples are put forth so as to provide those of ordinary skill in the art with a complete disclosure and description of how to make use of the present invention, and are neither intended to limit the scope of what the inventors regard as their invention nor are they intended to represent that the experiments below are all or the only experiments performed. The experimental conditions not indicated in the Examples, are generally conventional, such as those disclosed in “Molecular Cloning, A Laboratory Manual, 3rd ed, (Sambrook J.)”, or those suggested by the manufacturer.
Example 1
Extraction and Preparation of Nucleic Acid from Human Cell Lines, Fresh Human Tumor Tissues, Peripheral Blood, and Paraffin Embedded Tissues
1. Extraction of DNA or RNA
Nucleic acid extracting kit from Qiagen Inc., Promega Inc., or Roche Inc. can be used to extract nucleic acid from the samples. Content and purity of the extracted nucleic acid can be determined by using Nanodrop ND 1000 (Gene Inc.):
DNA: OD260/OD280=1.8±0.1, OD260/OD230=2.0±0.1;
RNA: OD260/OD280=2.0±0.1, OD260/OD230=2.0±0.10
2. Synthesis of cDNA
Use M-MLV reverse transcriptase to perform reverse transcription. The steps and reaction system are as in Table 1:
| TABLE 1 |
| reverse transcription system (10 μl) and steps |
| reagent | amount (μl/tube) | |
| RNA template | 5.5 | |
| OligodT | 0.4 |
| 70° C. denature 5 min, ice bath 2-5 min, add the following: |
| 5 X buffer | 2 | |
| dNTP(5 mM) | 1 | |
| DEPC water | 0.35 | |
| RNasin(40 U) | 0.25 | |
| MLV RT-enzyme | 0.5 | |
| total | 10 |
| 37-42° C. 60-90 min, 70° C. 5 min. | |
Example 2
Preparation of Positive Standard for EGFR Mutant Test
1. Construction of wild-type plasmids (FIG. 1, FIG. 2)
1.1 Preparation of the Vector
TA cloning vector pMD18-T was purchased from TAKARA Inc.
1.2 Preparation of the Insert
The insert is prepared using PCR. The template of PCR is the sample genome DNA extracted in Example 1. The reaction system and amplification condition are shown in the following tables (Table 2, Table 3 and Table 4):
| TABLE 2 |
| PCR reaction system (50 μl) |
| reagents | amount(μl/tube) | |
| double-distilled water | 29.75 | |
| 10x buffer (free of Mg2+) | 5 | |
| MgCl2 (25 mM) | 7.5 | |
| dNTP (10 mM) | 1.25 | |
| upstream primer (25 μM) | 1.25 | |
| downstream primer (25 μM) | 1.25 | |
| Taq enzyme | 1 | |
| DNA template | 3 | |
| total volume | 50 | |
| TABLE 3 |
| PCR amplification condition |
| step | cycles | temperature and time |
| step 1 | 1 | 95° C., 1-5 minutes |
| step 2 | 20-30 | 95° C., 10-15 seconds; 55-65° C., 30-60 seconds |
| TABLE 4 |
| PCR primers |
| name | sequence | ||
| E18-F1 | GAGGATCTTGAAGGAAACTG | (SEQ ID NO: 2) | |
| E18-F2 | CCAGCTTGTGGAGCCTCTT | (SEQ ID NO: 3) | |
| E18-R1 | GCCAGGGACCTTACCTTAT | (SEQ ID NO: 4) | |
| E18-R2 | CTGTGCCAGGGACCTTACCTT | (SEQ ID NO: 5) | |
| E18-F1 | CCCAGAAGGTGAGAAAGTT | (SEQ ID NO: 6) | |
| E18-F2 | GGGACTCTGGATCCCAGAAG | (SEQ ID NO: 7) | |
| E18-R1 | CCTGAGGTTCAGAGCCAT | (SEQ ID NO: 8) | |
| E18-R2 | CCCACACAGCAAAGCAGAA | (SEQ ID NO: 9) | |
| E21-F1 | GCAGCCAGGAACGTACTGGT | (SEQ ID NO: 10) | |
| E21-F2 | CCCTCACAGCAGGGTCTTCT | (SEQ ID NO: 11) | |
| E21-R1 | GTGGGAAGGCAGCCTGGT | (SEQ ID NO: 12) | |
| E21-R2 | GTGGGAAGGCAGCCTGGT | (SEQ ID NO: 13) | |
1.3 After recovering the target fragment using QIAgen Gel Recover Kit, insert said fragment into pMD18-T (purchased from TAKARA Inc.) by TA colonizing.
1.4 Amplify the constructed plasmid in E. coli DH5α strain, and harvest by extraction and purification (the methods are showed in Molecular Cloning, A Laboratory Manual, 3rd ed. pages 96-99 and 103).
1.5 Identify the plasmid by double enzyme digestion of BamHI and HindIII.
1.6 Sequence the strains having positive result, and use the strains with correct sequence as the standard containing wild-type sequence (FIG. 3).
2. Construction of mutant plasmids: design mutant primers of mutant sites, obtain the standards containing mutant sequences by DPN1 method.
2.1 Design the mutant primers (Table 5) of mutant sites based on the desired mutant sequences.
| TABLE 5 |
| mutant primers |
| primers name | sequence | |
| E18-M-F: | TGCTGAGCTCCGGTGCGTTCG | (SEQ ID NO: 14) |
| E18-M-R: | GGAGCTCAGCACTTTGATCTT | (SEQ ID NO: 15) |
| E19-1-F: | ATCAAAACATCTCCGAAAGCC | (SEQ ID NO: 16) |
| E19-1-R: | ATGTTTTGATAGCGACGGGAA | (SEQ ID NO: 17) |
| E19-2-F: | TCAAGACATCTCCGAAAGCCA | (SEQ ID NO: 18) |
| E19-2-R: | GATGTCTTGATAGCGACGGGA | (SEQ ID NO: 19) |
| E19-3-F: | CAACACTCGATGTGAGTTTCT | (SEQ ID NO: 20) |
| E19-3-R: | TCGAGTGTTGCTTCTCTTAAT | (SEQ ID NO: 21) |
| E21-M-F: | TGGGCGGGCCAAACTGCTGGG | (SEQ ID NO: 22) |
| E21-M-R: | TGGCCCGCCCAAAATCTGTGA | (SEQ ID NO: 23) |
2.2 Use 5 ng wild-type plasmid as template, and use mutant primers and Pfu enzyme to mutate the target sites. The amplification system and condition are shown in Table 2, Table 3 and Table 5.
During the preparation of the plasmid containing EGFR Exon 18 position 2155 G→A mutant sequence, the amplification system needs to add E18-M-F (SEQ ID NO:14) and E18-M-R (SEQ ID NO:15) primers. During the preparation of the plasmid containing EGFR Exon 19 position 2235-2249 deletion sequence, the amplification system needs to add E19-1-F (SEQ ID NO:16) and E19-1-R (SEQ ID NO:17) primers. During the preparation of the plasmid containing EGFR Exon 19 position 2236-2250 deletion sequence, the amplification system needs to add E19-2-F (SEQ ID NO:18) and E19-2-R (SEQ ID NO:19) primers. During the preparation of the plasmid containing EGFR Exon 19 position 2254-2277 deletion sequence, the amplification system needs to add E19-3-F (SEQ ID NO:20) and E19-1-R (SEQ ID NO:21) primers. During the preparation of the plasmid containing EGFR Exon 21 position 2573 T→G mutant sequence, the amplification system needs to add E21-M-F (SEQ ID NO:22) and E21-M-R (SEQ ID NO:23) primers.
2.3 treat the product obtained in step 2.2 with DPN1 enzyme, recover the product after incubating at 37° C. for 1 hour, amplify in E. coli DH5α strain, and harvest by extraction and purification.
2.4 Identify the plasmid by double enzyme digestion of BamHI and HindIII.
2.5 Sequence the strains having positive result, and use the strains with correct sequence as the standard containing mutant sequence (FIG. 4).
Example 3
Preparation of Positive Standard for KRAS Mutant Test
1. Construction of Wild-Type Plasmids (FIG. 1, FIG. 2)
1.1 Preparation of the Vector
TA cloning vector pMD18-T was purchased from TAKARA Inc.
1.2 Preparation of the Insert
The insert is prepared using PCR. The template of PCR is the sample genome DNA extracted in Example 1. The reaction system and amplification condition are shown in the following tables (Table 2, Table 3 and Table 6):
| TABLE 6 |
| PCR primers |
| name | sequence | |
| KRAS-F1 | CCTCTATTGTTGGATCATATT | (SEQ ID NO: 25) |
| KRAS-F2 | AATGACTGAATATAAACTTGTGGTA | (SEQ ID NO: 26) |
| GT | ||
| KRAS-R1 | TGACTGAATATAAACTTGTGGT | (SEQ ID NO: 27) |
| KRAS-R2 | AAATGATTCTGAATTAGCTGTATCGT | (SEQ ID NO: 28) |
1.3 After recovering the target fragment using QIAgen Gel Recover Kit, insert said fragment into pMD18-T (purchased from TAKARA Inc.) by TA colonizing.
1.4 Amplify the constructed plasmid in E. coli DH5α strain, and harvest by extraction and purification (the methods are showed in Molecular Cloning, A Laboratory Manual, 3rd ed. pages 96-99 and 103).
1.5 Identify the plasmid by double enzyme digestion of BamHI and HindIII.
1.6 Sequence the strains having positive result, and use the strains with correct sequence as the standard containing wild-type sequence (FIG. 5).
2. Construction of mutant plasmids: design mutant primers of mutant sites, obtain the standards containing mutant sequences by DPN1 method.
2.1 Design the mutant primers (Table 7) of mutant sites based on the desired mutant sequences.
| TABLE 7 |
| mutant primers |
| primers name | sequence |
| KRAS-1-F: | AGCTGTTGGCGTAGGCAAGAG | (SEQ ID NO: 29) |
| KRAS-1-R: | CGCCAACAGCTCCAACTACCA | (SEQ ID NO: 30) |
| KRAS-2-F: | AGCTAGTGGCGTAGGCAAGAG | (SEQ ID NO: 31) |
| KRAS-2-R: | CGCCACTAGCTCCAACTACCA | (SEQ ID NO: 32) |
| KRAS-3-F: | AGCTGATGGCGTAGGCAAGAG | (SEQ ID NO: 33) |
| KRAS-3-R: | CGCCATCAGCTCCAACTACCA | (SEQ ID NO: 34) |
| KRAS-4-F: | AGCTTGTGGCGTAGGCAAGAG | (SEQ ID NO: 35) |
| KRAS-4-R: | CGCCACAAGCTCCAACTACCA | (SEQ ID NO: 36) |
| KRAS-5-F: | CTGGTGACGTAGGCAAGAGTG | (SEQ ID NO: 37) |
| KRAS-5-R: | CCTACGTCACCAGCTCCAACT | (SEQ ID NO: 38) |
2.2. Use 5 ng wild-type plasmid as template, and use mutant primers and Pfu enzyme to mutate the target sites. The amplification system and condition are shown in Table 2, Table 3 and Table 7.
During the preparation of the plasmid containing KRAS Codon 12 GGT→GTT mutant sequence, the amplification system needs to add KRAS-1-F (SEQ ID NO:29) and KRAS-1-R (SEQ ID NO:30) primers. During the preparation of the plasmid containing KRAS Codon 12 GGT→AGT mutant sequence, the amplification system needs to add KRAS-2-F (SEQ ID NO:31) and KRAS-2-R (SEQ ID NO:32) primers. During the preparation of the plasmid containing KRAS Codon 12 GGT→GAT mutant sequence, the amplification system needs to add KRAS-3-F (SEQ ID NO:33) and KRAS-3-R (SEQ ID NO:34) primers. During the preparation of the plasmid containing KRAS Codon 12 GGT→TGT mutant sequence, the amplification system needs to add KRAS-4-F (SEQ ID NO:35) and KRAS-4-R (SEQ ID NO:36) primers. During the preparation of the plasmid containing KRAS Codon 13 GGC→GAC mutant sequence, the amplification system needs to add KRAS-5-F (SEQ ID NO:37) and KRAS-5-R (SEQ ID NO:38) primers.
2.3 treat the product obtained in step 2.2 with DPN1 enzyme, recover the product after incubating at 37° C. for 1 hour, amplify in E. coli DH5α strain, and harvest by extraction and purification.
2.4 Identify the plasmid by double enzyme digestion of BamHI and HindIII.
2.5 Sequence the strains having positive result, and use the strains with correct sequence as the standard containing mutant sequence (FIG. 6).
Example 4
Preparation of Positive Standard for BCRP Mutant Test
1. Construction of Wild-Type Plasmids (FIG. 1, FIG. 2)
1.1 Preparation of the Vector
TA cloning vector pMD18-T was purchased from TAKARA Inc.
1.2 Preparation of the Insert
The insert is prepared using PCR. The template of PCR is the sample genome DNA extracted in Example 1. The reaction system and amplification condition are shown in the following tables (Table 2, Table 3 and Table 8):
| TABLE 8 |
| PCR primers |
| name | sequences |
| BCRP-F1 | CTACAGAGTGTCATCTTATTTCCT | (SEQ ID NO: 40) |
| BCRP-F2 | TCCTTGGAAAACTGTTATCTGAT | (SEQ ID NO: 41) |
| BCRP-F3 | GCGGATACTACAGAGTGTCAT | (SEQ ID NO: 42) |
| BCRP-R1 | CATGAAGTACACTATACAGGTAA | (SEQ ID NO: 43) |
| ATA | ||
| BCRP-R2 | TAACATGAAGTACACTATACAGG | (SEQ ID NO: 44) |
| TA | ||
| BCRP-R3 | GGCAAGACTAAAGACATGTCC | (SEQ ID NO: 45) |
1.3 After recovering the target fragment using QIAgen Gel Recover Kit, insert said fragment into pMD18-T (purchased from TAKARA Inc.) by TA colonizing.
1.4 Amplify the constructed plasmid in E. coli DH5α strain, and harvest by extraction and purification (the methods are showed in Molecular Cloning, A Laboratory Manual, 3rd ed. pages 96-99 and 103).
1.5 Identify the plasmid by double enzyme digestion of BamHI and HindIII.
1.6 Sequence the strains having positive result, and use the strains with correct sequence as the standard containing wild-type sequence (FIG. 7).
2. Construction of mutant plasmids: design mutant primers of mutant sites, obtain the standards containing mutant sequences by DPN1 method.
2.1 Design the mutant primers (Table 9) of mutant sites based on the desired mutant sequences.
| TABLE 9 |
| mutant primers |
| primers name | sequence |
| BCRP-1-F: | CCATGGGGATGTTACCAAGTA | (SEQ ID NO: 46) |
| BCRP-1-R: | CATCCCCATGGGTAATAAATC | (SEQ ID NO: 47) |
| BCRP-2-F: | CCATGACGATGTTACCAAGTA | (SEQ ID NO: 48) |
| BCRP-2-R: | CATCGTCATGGGTAATAAATC | (SEQ ID NO: 49) |
2.2 Use 5 ng wild-type plasmid as template, and use mutant primers and
Pfu enzyme to mutate the target sites. The amplification system and condition are shown in Table 2, Table 3 and Table 9.
During the preparation of the plasmid containing BCRP Codon 482 AGG→GGG mutant sequence, the amplification system needs to add BCRP-1-F (SEQ ID NO:46) and BCRP-1-R (SEQ ID NO:47) primers. During the preparation of the plasmid containing BCRP Codon 482 AGG→ACG mutant sequence, the amplification system needs to add BCRP-2-F (SEQ ID NO:48) and BCRP-2-R (SEQ ID NO:49) primers.
2.3 treat the product obtained in step 2.2 with DPN1 enzyme, recover the product after incubating at 37° C. for 1 hour, amplify in E. coli DH5α strain, and harvest by extraction and purification.
2.4 Identify the plasmid by double enzyme digestion of BamHI and HindIII.
2.5 Sequence the strains having positive result, and use the strains with correct sequence as the standard containing mutant sequence (FIG. 8).
Example 5
Preparation of Positive Standard for BRAF Mutant Test
1. Construction of Wild-Type Plasmids (FIG. 1, FIG. 2)
1.1 Preparation of the Vector
TA cloning vector pMD18-T was purchased from TAKARA Inc.
1.2 Preparation of the Insert
The insert is prepared using PCR. The template of PCR is the sample genome DNA extracted in Example 1. The reaction system and amplification condition are shown in the following tables (Table 2, Table 3 and Table 10):
| TABLE 10 |
| PCR primers |
| name | sequence |
| BRAF-F1 | CATGAAGACCTCACAGTAAAAAT | (SEQ ID NO: 51) |
| AGGTGAT | ||
| BRAF-F2 | TTCTTCATGAAGACCTCACAGTAA | (SEQ ID NO: 52) |
| BRAF-R1 | GGATCCAGACAACTGTTCAAACT | (SEQ ID NO: 53) |
| GA | ||
| BRAF-R2 | CCAGACAACTGTTCAAACTGATG | (SEQ ID NO: 54) |
1.3 After recovering the target fragment using QIAgen Gel Recover Kit, insert said fragment into pMD18-T (purchased from TAKARA Inc.) by TA colonizing.
1.4 Amplify the constructed plasmid in E. coli DH5α strain, and harvest by extraction and purification (the methods are showed in Molecular Cloning, A Laboratory Manual, 3rd ed. pages 96-99 and 103).
1.5 Identify the plasmid by double enzyme digestion of BamHI and HindIII.
1.6 Sequence the strains having positive result, and use the strains with correct sequence as the standard containing wild-type sequence (FIG. 9).
2. Construction of mutant plasmids: design mutant primers of mutant sites, obtain the standards containing mutant sequences by DPN1 method.
2.1 Design the mutant primers (Table 11) of mutant sites based on the desired mutant sequences.
| TABLE 11 |
| mutant primers |
| name | sequence |
| BRAF-1-F: | TACAGAGAAATCTCGATGGAG | (SEQ ID NO: 55) |
| BRAF-1-R: | ATTTCTCTGTAGCTAGACCAA | (SEQ ID NO: 56) |
2.2 Use 5 ng wild-type plasmid as template, and use mutant primers and Pfu enzyme to mutate the target sites. The amplification system and condition are shown in Table 2, Table 3 and Table 11.
During the preparation of the plasmid containing BRAF Codon 600 GTG→GAG mutant sequence, the amplification system needs to add BRAF-1-F (SEQ ID NO:55) and BRAF-1-R (SEQ ID NO:56) primers.
2.3 treat the product obtained in step 2.2 with DPN1 enzyme, recover the product after incubating at 37° C. for 1 hour, amplify in E. coli DH5α strain, and harvest by extraction and purification.
2.4 Identify the plasmid by double enzyme digestion of BamHI and HindIII.
2.5 Sequence the strains having positive result, and use the strains with correct sequence as the standard containing mutant sequence (FIG. 10).
Example 6
Preparation of ERCC1 Positive Standard (FIG. 1, FIG. 2)
1. Preparation of the Vector
TA cloning vector pMD18-T was purchased from TAKARA Inc.
2. Preparation of the Insert
The insert is prepared using PCR. The template of PCR is the cDNA prepared in Example 1. The reaction system and amplification condition are shown in the following tables (Table 2, Table 3 and Table 12):
| TABLE 12 |
| PCR primers |
| name | sequence |
| ERCC1-F-1 | GAAAGAGACGGAGCTGAGGAA | (SEQ ID NO: 57) |
| ERCC1-F-2 | GGGAATTTGGCGACGTAATTC | (SEQ ID NO: 58) |
| ERCC1-R-1 | GGCCCTGACCTTGTAGACTGT | (SEQ ID NO: 59) |
| ERCC1-R-2 | GCGGAGGCTGAGGAACAG | (SEQ ID NO: 60) |
1.3 After recovering the target fragment using QIAgen Gel Recover Kit, insert said fragment into pMD18-T (purchased from TAKARA Inc.) by TA colonizing.
1.4 Amplify the constructed plasmid in E. coli DH5α strain, and harvest by extraction and purification (the methods are showed in Molecular Cloning, A Laboratory Manual, 3rd ed. pages 96-99 and 103).
1.5 Identify the plasmid by double enzyme digestion of BamHI and HindIII.
1.6 Sequence the strains having positive result, and use the strains with correct sequence as the positive standard (FIG. 11).
Example 7
Preparation of positive standard for RRM1 (FIG. 1, FIG. 2)
1. Preparation of the Vector
TA cloning vector pMD18-T was purchased from TAKARA Inc.
2. Preparation of the Insert
The insert is prepared using PCR. The template of PCR is the cDNA prepared in Example 1. The reaction system and amplification condition are shown in the following tables (Table 2, Table 3 and Table 13):
| TABLE 13 |
| PCR primers |
| name | sequence |
| RRM1-F-1 | TGACTACTAAGCACCCTGACTATG | (SEQ ID NO: 61) |
| RRM1-F-2 | ACCCACCAGTCAAAGC | (SEQ ID NO: 62) |
| RRM1-R-1 | CTTCCATCACATCACTGAACACTT | (SEQ ID NO: 63) |
| RRM1-R-2 | CATACAGGGAGTGGTTAAGT | (SEQ ID NO: 64) |
1.3 After recovering the target fragment using QIAgen Gel Recover Kit, insert said fragment into pMD18-T (purchased from TAKARA Inc.) by TA colonizing.
1.4 Amplify the constructed plasmid in E. coli DH5α strain, and harvest by extraction and purification (the methods are showed in Molecular Cloning, A Laboratory Manual, 3rd ed. pages 96-99 and 103).
1.5 Identify the plasmid by double enzyme digestion of BamHI and HindIII.
1.6 Sequence the strains having positive result, and use the strains with correct sequence as the positive standard (FIG. 12).
Example 8
Preparation of BRCA1 Positive Standard (FIG. 1, FIG. 2)
1. Preparation of the Vector
TA cloning vector pMD18-T was purchased from TAKARA Inc.
2. Preparation of the Insert
The insert is prepared using PCR. The template of PCR is the cDNA prepared in Example 1. The reaction system and amplification condition are shown in the following tables (Table 2, Table 3 and Table 14):
| TABLE 14 |
| PCR primers |
| name | sequence |
| BRCA1-F-1 | TCATCCAAAGTATGGGCTACAGA | (SEQ ID NO: 65) |
| TGACTATG | ||
| BRCA1-F-2 | TCATCCAAAGTATGGGCTACAGA | (SEQ ID NO: 66) |
| BRCA1-R-1 | TGGACACTGAGACTGGTTTCC | (SEQ ID NO: 67) |
| BRCA1-R-2 | TGGACACTGAGACTGGTTTC | (SEQ ID NO: 68) |
1.3 After recovering the target fragment using QIAgen Gel Recover Kit, insert said fragment into pMD18-T (purchased from TAKARA Inc.) by TA colonizing.
1.4 Amplify the constructed plasmid in E. coli DH5α strain, and harvest by extraction and purification (the methods are showed in Molecular Cloning, A Laboratory Manual, 3rd ed. pages 96-99 and 103).
1.5 Identify the plasmid by double enzyme digestion of BamHI and HindIII.
1.6 Sequence the strains having positive result, and use the strains with correct sequence as the positive standard (FIG. 13).
Example 9
Preparation of Positive Standard for TUBB3 (FIG. 1, FIG. 2)
1. Preparation of the Vector
TA cloning vector pMD18-T was purchased from TAKARA Inc.
2. Preparation of the Insert
The insert is prepared using PCR. The template of PCR is the cDNA prepared in Example 1. The reaction system and amplification condition are shown in the following tables (Table 2, Table 3 and Table 15):
| TABLE 15 |
| PCR primers |
| name | sequence |
| TUBB3-F-1 | GACCGCATCTCTGTGTACTAC | (SEQ ID NO: 69) |
| TUBB3-F-2 | CTGTGTACTACAATGAAGCCAC | (SEQ ID NO: 70) |
| TUBB3-R-1 | GTCCATGGTCCCAGGTTCTA | (SEQ ID NO: 71) |
| TUBB3-R-2 | AGGTTCTAGATCCACCAGGATGG | (SEQ ID NO: 72) |
1.3 After recovering the target fragment using QIAgen Gel Recover Kit, insert said fragment into pMD18-T (purchased from TAKARA Inc.) by TA colonizing.
1.4 Amplify the constructed plasmid in E. coli DH5α strain, and harvest by extraction and purification (the methods are showed in Molecular Cloning, A Laboratory Manual, 3rd ed. pages 96-99 and 103).
1.5 Identify the plasmid by double enzyme digestion of BamHI and HindIII.
1.6 Sequence the strains having positive result, and use the strains with correct sequence as the positive standard (FIG. 14).
Example 10
Preparation of ERBB3 Positive Standard (FIG. 1, FIG. 2)
1. Preparation of the Vector
TA cloning vector pMD18-T was purchased from TAKARA Inc.
2. Preparation of the Insert
The insert is prepared using PCR. The template of PCR is the cDNA prepared in Example 1. The reaction system and amplification condition are shown in the following tables (Table 2, Table 3 and Table 16):
| TABLE 16 |
| PCR primers |
| name | sequence |
| ERBB3-F-1 | CAACGGTTATGTCATGCCAGA | (SEQ ID NO: 73) |
| ERBB3-F-2 | GGTTATGTCATGCCAGATACAC | (SEQ ID NO: 74) |
| ERBB3-R-1 | GACAGAACTGAGACCCACTGAAG | (SEQ ID NO: 75) |
| ERBB3-R-2 | CTGAGACCCACTGAAGAAAGGGT | (SEQ ID NO: 76) |
1.3 After recovering the target fragment using QIAgen Gel Recover Kit, insert said fragment into pMD18-T (purchased from TAKARA Inc.) by TA colonizing.
1.4 Amplify the constructed plasmid in E. coli DH5α strain, and harvest by extraction and purification (the methods are showed in Molecular Cloning, A Laboratory Manual, 3rd ed. pages 96-99 and 103).
1.5 Identify the plasmid by double enzyme digestion of BamHI and HindIII.
1.6 Sequence the strains having positive result, and use the strains with correct sequence as the positive standard (FIG. 15).
Example 11
Preparation of TOP2a Positive Standard (FIG. 1, FIG. 2)
1. Preparation of the Vector
TA cloning vector pMD18-T was purchased from TAKARA Inc.
2. Preparation of the Insert
The insert is prepared using PCR. The template of PCR is the cDNA prepared in Example 1. The reaction system and amplification condition are shown in the following tables (Table 2, Table 3 and Table 17):
| TABLE 17 |
| PCR primers |
| name | sequence |
| TOP2A-F-1 | CAGCGTGTTGAGCCTGAATG | (SEQ ID NO: 77) |
| TOP2A-F-2 | GCGTGTTGAGCCTGAATGGTAC | (SEQ ID NO: 78) |
| TOP2A-R-1 | AGGACCACCCAGTACCGATT | (SEQ ID NO: 79) |
| TOP2A-R-2 | GGACCACCCAGTACCGATTCCT | (SEQ ID NO: 80) |
1.3 After recovering the target fragment using QIAgen Gel Recover Kit, insert said fragment into pMD18-T (purchased from TAKARA Inc.) by TA colonizing.
1.4 Amplify the constructed plasmid in E. coli DH5α strain, and harvest by extraction and purification (the methods are showed in Molecular Cloning, A Laboratory Manual, 3rd ed. pages 96-99 and 103).
1.5 Identify the plasmid by double enzyme digestion of BamHI and HindIII.
1.6 Sequence the strains having positive result, and use the strains with correct sequence as the positive standard (FIG. 16).
Example 12
Preparation of TYMS Positive Standard (FIG. 1, FIG. 2)
1. Preparation of the Vector
TA cloning vector pMD18-T was purchased from TAKARA Inc.
2. Preparation of the Insert
The insert is prepared using PCR. The template of PCR is the cDNA prepared in Example 1. The reaction system and amplification condition are shown in the following tables (Table 2, Table 3 and Table 18):
| TABLE 18 |
| PCR primers |
| name | sequence |
| TYMS-F-1 | GGCACCCTGTCGGTATTCG | (SEQ ID NO: 81) |
| TYMS-F-2 | GGCACCCTGTCGGTATTC | (SEQ ID NO: 82) |
| TYMS-R-1 | CCCTTCCAGAACACACGTT | (SEQ ID NO: 83) |
| TYMS-R-2 | CTCCAAAACACCCTTCCAGAA | (SEQ ID NO: 84) |
1.3 After recovering the target fragment using QIAgen Gel Recover Kit, insert said fragment into pMD18-T (purchased from TAKARA Inc.) by TA colonizing.
1.4 Amplify the constructed plasmid in E. coli DH5α strain, and harvest by extraction and purification (the methods are showed in Molecular Cloning, A Laboratory Manual, 3rd ed. pages 96-99 and 103).
1.5 Identify the plasmid by double enzyme digestion of BamHI and HindIII.
1.6 Sequence the strains having positive result, and use the strains with correct sequence as the positive standard (FIG. 17).
Example 13
Preparation of RAP-80 Positive Standard (FIG. 1, FIG. 2)
1. Preparation of the Vector
TA cloning vector pMD18-T was purchased from TAKARA Inc.
2. Preparation of the Insert
The insert is prepared using PCR. The template of PCR is the cDNA prepared in Example 1. The reaction system and amplification condition are shown in the following tables (Table 2, Table 3 and Table 19):
| TABLE 19 |
| PCR primers |
| name | sequence |
| RAP-80-F-1 | CAAAATGAGTGAGCAGGAAGCT | (SEQ ID NO: 85) |
| RAP-80-F-2 | AATGAGTGAGCAGGAAGCT | (SEQ ID NO: 86) |
| RAP-80-R-1 | TCAGAAGGCCGGCAACTATT | (SEQ ID NO: 87) |
| RAP80-R-2 | CAACTATTCAGGCTTTCAGCAAT | (SEQ ID NO: 88) |
1.3 After recovering the target fragment using QIAgen Gel Recover Kit, insert said fragment into pMD18-T (purchased from TAKARA Inc.) by TA colonizing.
1.4 Amplify the constructed plasmid in E. coli DH5α strain, and harvest by extraction and purification (the methods are showed in Molecular Cloning, A Laboratory Manual, 3rd ed. pages 96-99 and 103).
1.5 Identify the plasmid by double enzyme digestion of BamHI and HindIII.
1.6 Sequence the strains having positive result, and use the strains with correct sequence as the positive standard (FIG. 18).
Example 14
Preparation of VEGFR1 Positive Standard (FIG. 1, FIG. 2)
1. Preparation of the Vector TA cloning vector pMD18-T was purchased from TAKARA Inc.
2. Preparation of the Insert
The insert is prepared using PCR. The template of PCR is the cDNA prepared in Example 1. The reaction system and amplification condition are shown in the following tables (Table 2, Table 3 and Table 20):
| TABLE 20 |
| PCR primers |
| name | sequence |
| VEGFR1-F-1 | TTTACCGAATGCCACCTCCAT | (SEQ ID NO: 89) |
| VEGFR1-F-2 | CCGAATGCCACCTCCAT | (SEQ ID NO: 90) |
| VEGFR1-R-1 | ATGGGAGAGGCCAACAGAGT | (SEQ ID NO: 91) |
| VEGFR1-R-2 | GGGAGAGGCCAACAGAGT | (SEQ ID NO: 92) |
1.3 After recovering the target fragment using QIAgen Gel Recover Kit, insert said fragment into pMD18-T (purchased from TAKARA Inc.) by TA colonizing.
1.4 Amplify the constructed plasmid in E. coli DH5α strain, and harvest by extraction and purification (the methods are showed in Molecular Cloning, A Laboratory Manual, 3rd ed. pages 96-99 and 103).
1.5 Identify the plasmid by double enzyme digestion of BamHI and HindIII.
1.6 Sequence the strains having positive result, and use the strains with correct sequence as the positive standard (FIG. 19).
Example 15
Preparation of VEGFR2 Positive Standard (FIG. 1, FIG. 2)
1. Preparation of the Vector
TA cloning vector pMD18-T was purchased from TAKARA Inc.
2. Preparation of the Insert
The insert is prepared using PCR. The template of PCR is the cDNA prepared in Example 1. The reaction system and amplification condition are shown in the following tables (Table 2, Table 3 and Table 21):
| TABLE 21 |
| PCR primers |
| name | sequence |
| VEGFR2-F-1 | TGGAGCAATCCCTGTGGATCT | (SEQ ID NO: 93) |
| VEGFR2-F-2 | GGAGCAATCCCTGTGGATCT | (SEQ ID NO: 94) |
| VEGFR2-R-1 | CTCCTCCACAAATCCAGAGCT | (SEQ ID NO: 95) |
| VEGFR2-R-2 | CCTCCACAAATCCAGAGCT | (SEQ ID NO: 96) |
1.3 After recovering the target fragment using QIAgen Gel Recover Kit, insert said fragment into pMD18-T (purchased from TAKARA Inc.) by TA colonizing.
1.4 Amplify the constructed plasmid in E. coli DH5α strain, and harvest by extraction and purification (the methods are showed in Molecular Cloning, A Laboratory Manual, 3rd ed. pages 96-99 and 103).
1.5 Identify the plasmid by double enzyme digestion of BamHI and HindIII.
1.6 Sequence the strains having positive result, and use the strains with correct sequence as the positive standard (FIG. 20).
Example 16
Preparation of HER2 Positive Standard (FIG. 1, FIG. 2)
1. Preparation of the Vector
TA cloning vector pMD18-T was purchased from TAKARA Inc.
2. Preparation of the Insert
The insert is prepared using PCR. The template of PCR is the cDNA prepared in Example 1. The reaction system and amplification condition are shown in the following tables (Table 2, Table 3 and Table 22):
| TABLE 22 |
| PCR primers |
| name | sequence | |
| HER2-F-1 | GAAGGACATCTTCCACAAG | ( SEQ ID NO: 97 ) |
| AACAA | ||
| HER2-F-2 | TGCTGTCCTGTTCACCACTC | ( SEQ ID NO: 98 ) |
| HER2-R-1 | GAGCCCTTACACATCGGAGA | ( SEQ ID NO: 99 ) |
| AC | ||
| HER2-R-2 | GCTTTGCATGTGGTCTTGAA | ( SEQ ID NO: 100 ) |
1.3 After recovering the target fragment using QIAgen Gel Recover Kit, insert said fragment into pMD18-T (purchased from TAKARA Inc.) by TA colonizing.
1.4 Amplify the constructed plasmid in E. coli DH5α strain, and harvest by extraction and purification (the methods are showed in Molecular Cloning, A Laboratory Manual, 3rd ed. pages 96-99 and 103).
1.5 Identify the plasmid by double enzyme digestion of BamHI and HindIII.
1.6 Sequence the strains having positive result, and use the strains with correct sequence as the positive standard (FIG. 21).
Example 17
Preparation of EGFR Positive Standard (FIG. 1, FIG. 2)
1. Preparation of the Vector
TA cloning vector pMD18-T was purchased from TAKARA Inc.
2. Preparation of the Insert
The insert is prepared using PCR. The template of PCR is the cDNA prepared in Example 1. The reaction system and amplification condition are shown in the following tables (Table 2, Table 3 and Table 23):
| TABLE 23 |
| PCR primers |
| name | sequence | |
| EGFR-F-1 | CCCTCCTGAGCTCTCTGAGT | ( SEQ ID NO: 101 ) |
| EGFR-F-2 | TGCAACCAGCAACAAT | ( SEQ ID NO: 102 ) |
| EGFR-R-1 | CTTGATGGGACAGCTTTGCA | ( SEQ ID NO: 103 ) |
| EGFR-R-2 | GAAGCTGTCTTCCTTGAT | ( SEQ ID NO: 104 ) |
1.3 After recovering the target fragment using QIAgen Gel Recover Kit, insert said fragment into pMD18-T (purchased from TAKARA Inc.) by TA colonizing.
1.4 Amplify the constructed plasmid in E. coli DH5α strain, and harvest by extraction and purification (the methods are showed in Molecular Cloning, A Laboratory Manual, 3rd ed. pages 96-99 and 103).
1.5 Identify the plasmid by double enzyme digestion of BamHI and HindIII.
1.6 Sequence the strains having positive result, and use the strains with correct sequence as the positive standard (FIG. 22).
Example 18
Preparation of VEGF Positive Standard (FIG. 1, FIG. 2)
1. Preparation of the Vector
TA cloning vector pMD18-T was purchased from TAKARA Inc.
2. Preparation of the Insert
The insert is prepared using PCR. The template of PCR is the cDNA prepared in Example 1. The reaction system and amplification condition are shown in the following tables (Table 2, Table 3 and Table 24):
| TABLE 24 |
| PCR primers |
| name | sequence | |
| VEGF-F-1 | GCCTTGCCTTGCTGCTCTA | ( SEQ ID NO: 105 ) |
| VEGF-F-2 | CTGCTGTCTTGGGTGCATTG | ( SEQ ID NO: 106 ) |
| VEGF-R-1 | TGATTCTGCCCTCCTCCTTC | ( SEQ ID NO: 107 ) |
| T | ||
| VEGF-R-2 | GATTCTGCCCTCCTCCTTCT | ( SEQ ID NO: 108 ) |
1.3 After recovering the target fragment using QIAgen Gel Recover Kit, insert said fragment into pMD18-T (purchased from TAKARA Inc.) by TA colonizing.
1.4 Amplify the constructed plasmid in E. coli DH5α strain, and harvest by extraction and purification (the methods are showed in Molecular Cloning, A Laboratory Manual, 3rd ed. pages 96-99 and 103).
1.5 Identify the plasmid by double enzyme digestion of BamHI and HindIII.
1.6 Sequence the strains having positive result, and use the strains with correct sequence as the positive standard (FIG. 23).
Example 19
Preparation of PPN Positive Standard (FIG. 1, FIG. 2)
1. Preparation of the Vector
TA cloning vector pMD18-T was purchased from TAKARA Inc.
2. Preparation of the Insert
The insert is prepared using PCR. The template of PCR is the cDNA prepared in Example 1. The reaction system and amplification condition are shown in the following tables (Table 2, Table 3 and Table 25):
| TABLE 25 |
| PCR primers |
| name | sequence | |
| PPN-F-1 | TCCTCAGTGCCTGTGTCTTG | ( SEQ ID NO: 109 ) |
| PPN-F-2 | GATGTCGATGTGGATGA | ( SEQ ID NO: 110 ) |
| PPN-R-1 | GCATCCAAAAGTGACCCAGT | ( SEQ ID NO: 111 ) |
| PPN-R-2 | CACTTGTGGACAGTGTATG | ( SEQ ID NO: 112 ) |
1.3 After recovering the target fragment using QIAgen Gel Recover Kit, insert said fragment into pMD18-T (purchased from TAKARA Inc.) by TA colonizing.
1.4 Amplify the constructed plasmid in E. coli DH5α strain, and harvest by extraction and purification (the methods are showed in Molecular Cloning, A Laboratory Manual, 3rd ed. pages 96-99 and 103).
1.5 Identify the plasmid by double enzyme digestion of BamHI and HindIII.
1.6 Sequence the strains having positive result, and use the strains with correct sequence as the positive standard (FIG. 24).
Example 20
Preparation of CCNB2 Positive Standard (FIG. 1, FIG. 2)
1. Preparation of the Vector
TA cloning vector pMD18-T was purchased from TAKARA Inc.
2. Preparation of the Insert
The insert is prepared using PCR. The template of PCR is the cDNA prepared in Example 1. The reaction system and amplification condition are shown in the following tables (Table 2, Table 3 and Table 26):
| TABLE 26 |
| PCR primers |
| name | sequence | |
| CCNB2-F-1 | GGACATTGATAACGAAGATTG | ( SEQ ID NO: 113 ) |
| CCNB2-F-2 | CACAGGATACACAGAGAATG | ( SEQ ID NO: 114 ) |
| CCNB2-R-1 | GCTGCCTGAGATACTGAT | ( SEQ ID NO: 115 ) |
| CCNB2-R-2 | CTTGATGGCGATGAATTTAG | ( SEQ ID NO: 116 ) |
1.3 After recovering the target fragment using QIAgen Gel Recover Kit, insert said fragment into pMD18-T (purchased from TAKARA Inc.) by TA colonizing.
1.4 Amplify the constructed plasmid in E. coli DH5α strain, and harvest by extraction and purification (the methods are showed in Molecular Cloning, A Laboratory Manual, 3rd ed. pages 96-99 and 103).
1.5 Identify the plasmid by double enzyme digestion of BamHI and HindIII.
1.6 Sequence the strains having positive result, and use the strains with correct sequence as the positive standard (FIG. 25).
Example 21
Preparation of the Positive Standard for Detecting ACTB Expression (FIG. 1, FIG. 2)
1. Preparation of the Vector
TA cloning vector pMD18-T was purchased from TAKARA Inc.
2. Preparation of the Insert
The insert is prepared using PCR. The template of PCR is the cDNA prepared in Example 1. The reaction system and amplification condition are shown in the following tables (Table 2, Table 3 and Table 27):
| TABLE 27 |
| PCR primers |
| name | sequence | |
| ACTB-F-1 | CAGATGTGGATCAGCAAGCA | ( SEQ ID NO: 117 ) |
| ACTB-F-2 | AGAAAATCTGGCACCACACC | ( SEQ ID NO: 118 ) |
| ACTB-R-1 | TCATAGTCCGCCTAGAAGCA | ( SEQ ID NO: 119 ) |
| TT | ||
| ACTB-R-2 | AGAGGCGTACAGGGATAGCA | ( SEQ ID NO: 120 ) |
1.3 After recovering the target fragment using QIAgen Gel Recover Kit, insert said fragment into pMD18-T (purchased from TAKARA Inc.) by TA colonizing.
1.4 Amplify the constructed plasmid in E. coli DH5α strain, and harvest by extraction and purification (the methods are showed in Molecular Cloning, A Laboratory Manual, 3rd ed. pages 96-99 and 103).
1.5 Identify the plasmid by double enzyme digestion of BamHI and HindIII.
1.6 Sequence the strains having positive result, and use the strains with correct sequence as the positive standard (FIG. 26).
Example 22
Preparation of the Positive Standard for Detecting 18S rRNA Expression
1. Preparation of the Vector
TA cloning vector pMD18-T was purchased from TAKARA Inc.
2. Preparation of the Insert
The insert is prepared using PCR. The template of PCR is the cDNA prepared in Example 1. The reaction system and amplification condition are shown in the following tables (Table 2, Table 3 and Table 28):
| TABLE 28 |
| PCR primers |
| name | sequence | |
| 18S-F-1 | ACATCCAAGGAAGGCAGCAG | ( SEQ ID NO: 121 ) |
| 18S-F-2 | ACATCCAAGGAAGGCAGCAG | ( SEQ ID NO: 122 ) |
| 18S-R-1 | TTCGTCACTACCTCCCCGG | ( SEQ ID NO: 123 ) |
| 18S-R-2 | TTCGTCACTACCTCCCCGG | ( SEQ ID NO: 124 ) |
1.3 After recovering the target fragment using QIAgen Gel Recover Kit, insert said fragment into pMD18-T (purchased from TAKARA Inc.) by TA colonizing.
1.4 Amplify the constructed plasmid in E. coli DH5α strain, and harvest by extraction and purification (the methods are showed in Molecular Cloning, A Laboratory Manual, 3rd ed. pages 96-99 and 103).
1.5 Identify the plasmid by double enzyme digestion of BamHI and HindIII.
1.6 Sequence the strains having positive result, and use the strains with correct sequence as the positive standard (FIG. 27).
Example 23
Preparation of the Positive Standard for Detecting HER2 Gene Amplification
1. Preparation of the Vector
TA cloning vector pMD18-T was purchased from TAKARA Inc.
2. Preparation of the Insert
The insert is prepared using PCR. The template of PCR is the sample genome DNA extracted in Example 1. The reaction system and amplification condition are shown in the following tables (Table 2, Table 3 and Table 29):
| TABLE 29 |
| PCR primers |
| name | sequence | |
| O-HER2-F-1 | GAAAGAGACGGAGCTGAG | ( SEQ ID NO: 125 ) |
| GAA | ||
| O-HER2-F-2 | CAGACCATTTGGGTTCAA | ( SEQ ID NO: 126 ) |
| ATCC | ||
| O-HER2-R-1 | GGCCCTGACCTTGTAGAC | ( SEQ ID NO: 127 ) |
| TGT | ||
| O-HER2-R-2 | GAGACCAAAGCAGAGAGT | ( SEQ ID NO: 128 ) |
| TCT | ||
1.3 After recovering the target fragment using QIAgen Gel Recover Kit, insert said fragment into pMD18-T (purchased from TAKARA Inc.) by TA colonizing.
1.4 Amplify the constructed plasmid in E. coli DH5α strain, and harvest by extraction and purification (the methods are showed in Molecular Cloning, A Laboratory Manual, 3rd ed. pages 96-99 and 103).
1.5 Identify the plasmid by double enzyme digestion of BamHI and HindIII.
1.6 Sequence the strains having positive result, and use the strains with correct sequence as the positive standard (FIG. 28).
Example 24
Preparation of the Positive Standard for Detecting ACTB Gene Amplification
1. Preparation of the Vector
TA cloning vector pMD18-T was purchased from TAKARA Inc.
2. Preparation of the Insert
The insert is prepared using PCR. The template of PCR is the sample genome DNA extracted in Example 1. The reaction system and amplification condition are shown in the following tables (Table 2, Table 3 and Table 30):
| TABLE 30 |
| PCR primers |
| name | sequence | |
| ACTB-F-1 | CAGGATGCAGAAGGAGAT | ( SEQ ID NO: 129 ) |
| CACT | ||
| ACTB-F-2 | CATCCTCACCCTGAAGTA | ( SEQ ID NO: 130 ) |
| ACTB-R-1 | CAGCTCAGGCAGGAAAGA | ( SEQ ID NO: 131 ) |
| CA | ||
| ACTB-R-2 | ACACGCAGCTCATTGTAG | ( SEQ ID NO: 132 ) |
1.3 After recovering the target fragment using QIAgen Gel Recover Kit, insert said fragment into pMD18-T (purchased from TAKARA Inc.) by TA colonizing.
1.4 Amplify the constructed plasmid in E. coli DH5α strain, and harvest by extraction and purification (the methods are showed in Molecular Cloning, A Laboratory Manual, 3rd ed. pages 96-99 and 103).
1.5 Identify the plasmid by double enzyme digestion of BamHI and HindIII.
1.6 Sequence the strains having positive result, and use the strains with correct sequence as the positive standard (FIG. 29).
Example 25
Use of Positive Plasmid Standard in Mutant Test
1. Prepare plasmid standard with different concentration
Double dilute the plasmid standard to 5E-1 ng/μl, 2.5E-1 ng/μl, 1.25E-1 ng/μl, 6.25E-2 ng/μl, 3.125E-2 ng/μl, as the template for fluorescent quantitative PCR.
2. Prepare DNA of the sample using the method of Example 1.
3. The reaction system and amplification condition for fluorescent quantitative PCR (Table 31, Table 32)
For detecting different genes, we should add corresponding primers (Table 4, Table 6, Table 8 and Table 10) and probes (Table 33-Table 36) into the reaction system, wherein probes are labeled with fluorescence emitting groups which are selected from FAM, TET, HEX, or ROX, and fluorescence quenching groups which are selected from BHQ or TAMARA.
| TABLE 31 |
| fluorescent quantitative PCR reaction system (20 μl/tube) |
| reagents | amount (μl/tube) | |
| double-distilled water | 9.9 | |
| 10x buffer (free of Mg2+) | 2 | |
| MgCl2 (25 mM) | 3 | |
| dNTP (10 mM) | 0.5 | |
| upstream primer (25 μM) | 0.5 | |
| downstream primer (25 μM) | 0.5 | |
| fluorescent probe (25 μM) | 0.2 | |
| Taq enzyme | 0.4 | |
| DNA template | 3 | |
| total volume | 20 | |
| TABLE 32 |
| amplification condition |
| step | cycles | temperature and time |
| step 1 | 1 | 95° C., 1-5 minutes |
| step 2 | 30-45 | 95° C., 10-15 seconds; 55-65° C. (collect fluorescence), |
| 30-60 seconds | ||
| TABLE 33 |
| Probes for fluorescent quantitative |
| PCR detection of EGFR mutant |
| name | sequence | |
| E18W-1 | GGCTCCGGTGCGTTCGGC | ( SEQ ID NO: 133 ) |
| E18W-2 | CGGAGCCCAGCACTTTGATCT | ( SEQ ID NO: 134) |
| E18M-1 | TGCTGAGCTCCGGTGCGTT | ( SEQ ID NO: 135 ) |
| E18M-2 | CGGAGCTCAGCACTTTGATCTT | ( SEQ ID NO: 136 ) |
| E19W-1 | TCAAGGAATTAAGAGAAGCAAC | ( SEQ ID NO: 137 ) |
| ATC | ||
| E19W-2 | CGGAGATGTTGCTTCTCTTAAT | ( SEQ ID NO: 138 ) |
| TCCT | ||
| E19M1-1 | CCCGTCGCTATCAAAACATCT | ( SEQ ID NO: 139 ) |
| E19M1-2 | AGATGTTTTGATAGCGACGGG | ( SEQ ID NO: 140 ) |
| E19M2-1 | CCCGTCGCTATCAAGACATCTC | ( SEQ ID NO: 141 ) |
| E19M2-2 | GAGATGTCTTGATAGCGACGGG | ( SEQ ID NO: 142 ) |
| E19M3-1 | AATTAAGAGAAGCAACACTCGAT | ( SEQ ID NO: 143 ) |
| E19M3-1 | ATCGAGTGTTGCTTCTCTTAATT | ( SEQ ID NO: 144 ) |
| E21W-1 | TGGCCAGCCCAAAATCTGTG | ( SEQ ID NO: 145 ) |
| E21W-1 | AAGATCACAGATTTTGGGCTGGC | ( SEQ ID NO: 146 ) |
| E21M-1 | TGGCCCGCCCAAAATCTGT | ( SEQ ID NO: 147 ) |
| E21M-1 | GATCACAGATTTTGGGCGGGC | ( SEQ ID NO: 148 ) |
| TABLE 34 |
| Probes for fluorescent quantitative PCR |
| detection of KRAS mutant |
| name | sequence | |
| KRAS-W1 | AGCTGGTGGCGTAGGCAAGA | ( SEQ ID NO: 149 ) |
| KRAS-W2 | AGCTGGTGGCGTAGGCAAGAGT | ( SEQ ID NO: 150 ) |
| KRAS-11 | AGCT GTT GGCGTAGGCAAGA | ( SEQ ID NO: 151 ) |
| KRAS-12 | AGCTGTTGGCGTAGGCAAGAGTG | ( SEQ ID NO: 152 ) |
| KRAS-21 | AGCT AGT GGCGTAGGCAAGA | ( SEQ ID NO: 153 ) |
| KRAS-22 | AGCTAGTGGCGTAGGCAAGAGTG | ( SEQ ID NO: 154 ) |
| KRAS-31 | AGCT GAT GGCGTAGGCAAGA | ( SEQ ID NO: 155 ) |
| KRAS-32 | AGCTGATGGCGTAGGCAAGAGTG | ( SEQ ID NO: 156 ) |
| KRAS-41 | AGCT TGT GGCGTAGGCAAGA | ( SEQ ID NO: 157 ) |
| KRAS-42 | AGCTTGTGGCGTAGGCAAGAGTG | ( SEQ ID NO: 158 ) |
| KRAS-51 | AGCTGGT GAC GTAGGCAAGA | ( SEQ ID NO: 159 ) |
| KRAS-52 | AGCTGGTGACGTAGGCAAGAGTG | ( SEQ ID NO: 160 ) |
| TABLE 35 |
| Probes for fluorescent quantitative PCR |
| detection of BCRP mutant |
| name | sequence | |
| BCRP-W-1 | CCCATGAGGATGTTACCAAG | ( SEQ ID NO: 161 ) |
| TATT | ||
| BCRP-W-2 | TTACCCATGAGGATGTTACC | ( SEQ ID NO: 162 ) |
| AAGTATT | ||
| BCRP-M1-1 | CCCATGGGGATGTTACCAAG | ( SEQ ID NO: 163 ) |
| TATT | ||
| BCRP-M1-2 | TTACCCATGGGGATGTTACC | ( SEQ ID NO: 164 ) |
| AAGTATT | ||
| BCRP-M2-1 | CCCATGACGATGTTACCAAG | ( SEQ ID NO: 165 ) |
| TATT | ||
| BCRP-M2-2 | TTACCCATGACGATGTTACC | ( SEQ ID NO: 166 ) |
| AAGTATT | ||
| TABLE 36 |
| Probes for fluorescent quantitative PCR |
| detection of BRAF mutant |
| name | sequence | |
| BRAF-W-1 | CCA TCG AGA TTT CAC | ( SEQ ID NO: 167 ) |
| TGT AG | ||
| BRAF-W-2 | CCATCGAGATTTCACTGTA | ( SEQ ID NO: 168 ) |
| GCTAGACCA | ||
| BRAF-M-1 | CCA TCG AGA TTT CTC | ( SEQ ID NO: 169 ) |
| TGT AG | ||
| BRAF-M-2 | CCATCGAGATTTCTCTGTA | ( SEQ ID NO: 170 ) |
| GCTAGACCA | ||
For different kinds of mutations, the detection of them needs different reaction systems. For example, for detecting the mutations in BRAF Codon 600, it needs to prepare two systems, in which all reagents are same except the probes, i.e., all the primers are BRAF-F1 (SEQ ID NO:51) or BRAF-F2 (SEQ ID NO:52) together with BRAF-R1 (SEQ ID NO:53) or BRAF-R2 (SEQ ID NO:54). For detecting BRAF Codon 600 wild-type genes, the system needs to add BRAF-W-1 (SEQ ID NO:167) or BRAF-W-2 (SEQ ID NO:168) probes. For detecting BRAF Codon 600 GTG→GAG mutant, the system needs to add BRAF-M-1 (SEQ ID NO:169) or BRAF-M-2 (SEQ ID NO:170) probes.
4. Draw the standard curve
The standard curve is drawn based on the CT values obtained from the standard in Step 3. FIG. 30 shows the amplification curve of plasmid standard, in which the five rising curves represent, from left to right, the amplification curve of the plasmid standard 10 times diluted in turn. The horizontal axis represents cycle number, and the vertical axis represents fluorescent detection value. Accordingly, it is possible to draw the standard curve for calculation (FIG. 31). In FIG. 30, the horizontal axis represents the logarithm of copy number of the template, the vertical axis represents CT value, wherein the copy number of template=mass/(molecular weight)×6.02×10²³. In the present experiment, the plasmid consists of pMD18-T vector and an insert. All of the inserts have a length of about 100 bp, very short compared with that of pMD18-T vector. Therefore, they can be ignored. The copy number of 0.5 ng/μl plasmid is 1010.
5. Calculate the ratio of gene mutations in a sample using standard curves
Based on the standard curve, the copy numbers of wild-type and mutant genome DNA can be calculated from the CT values of the sample. Then we obtain the ratio of mutant DNA to total DNA (wild-type plus all mutants at said site). As shown in FIG. 32, the wild-type CT value of EGFR Exon 21 in a sample is 19.15, whereas the value of position 2573 T→G mutant is 20.74. According to each corresponding standard curve formula (FIG. 31), we can calculate the copy number for each of them. We then obtain the ratio of the content of mutant to wild-type which was 89:100, and we estimate that about 47% EGFR gene in tissue sample has position 2573 T→G mutation.
Example 26
Use of Positive Plasmid Standard in Detecting Expression
1. Prepare plasmid standard with different concentration
Dilute the plasmid standard 10 times in turn to 5E-1 ng/μl, 5E-2 ng/μl, 5E-3 ng/μl, and 5E-4 ng/μl, as the template for fluorescent quantitative PCR.
2. Prepare cDNA of the sample using the method of Example 1.
3. The reaction system and condition for fluorescent quantitative PCR (Table 31, Table 32)
For detecting different genes, we should add corresponding primers (Table 12-28) and probes (Table 37) into the reaction system, wherein probes are labeled with fluorescence emitting groups which are selected from FAM, TET, HEX, or ROX, and fluorescence quenching groups which are selected from BHQ or TAMARA.
| TABLE 37 |
| Probes for detecting expression by |
| fluorescent quantitative PCR |
| name | sequence |
| ERCC1-P-1 | CCCGACTATGTGCTGGGCCA | ( SEQ ID NO: 171 ) |
| GAG | ||
| ERCC1-P-2 | CACAGGTGCTCTGGCCCAGC | ( SEQ ID NO: 172 ) |
| ACATA | ||
| RRM1-P-1 | CAGGATCGCTGTCTCTAACT | ( SEQ ID NO: 173 ) |
| TGCACAA | ||
| RRM1-P-2 | CAGCCAGGATCGCTGTCTCT | ( SEQ ID NO: 174 ) |
| AACTTGCA | ||
| BRCA1-P-1 | CCGTGCCAAAAGACTTCTAC | ( SEQ ID NO: 175 ) |
| AGAGTGA | ||
| BRCA1-P-2 | GCCAAAAGACTTCTACAGAG | ( SEQ ID NO: 176 ) |
| TGA | ||
| TUBB3-P-1 | CACAGGTGGCAAATATGTTC | ( SEQ ID NO: 177 ) |
| CTCGT | ||
| TUBB3-P-2 | CAGGTGGCAAATATGTTCCT | ( SEQ ID NO: 178 ) |
| ERBB3-P-1 | AAAGGTACTCCCTCCTCCCG | ( SEQ ID NO: 179 ) |
| GGA | ||
| ERBB3-P-2 | GGTACTCCCTCCTCCCGGGA | ( SEQ ID NO: 180 ) |
| TOP2A-P-1 | CTTCAGCACCATTTATCAGC | ( SEQ ID NO: 181 ) |
| ACCATGG | ||
| TOP2A-P-2 | TTCAGCACCATTTATCAGCA | ( SEQ ID NO: 182 ) |
| TYMS-P-1 | CGCGCTACAGCCTGAGAGAT | ( SEQ ID NO: 183 ) |
| GAA | ||
| TYMS-P-2 | CGCTACAGCCTGAGAGATG | ( SEQ ID NO: 184 ) |
| RAP-80-P-1 | CAGCCAGGAGGAGGAAGAA | ( SEQ ID NO: 185 ) |
| GAGGA | ||
| RAP-80-P-2 | GCCAGGAGGAGGAAGAAGA | ( SEQ ID NO: 186 ) |
| VEGFR1-P-1 | CTGCTGTCGCCCTGGTAGT | ( SEQ ID NO: 187 ) |
| CATCAA | ||
| VEGFR1-P-2 | CTGTCGCCCTGGTAGTCAT | ( SEQ ID NO: 188 ) |
| VEGFR2-P-1 | ACGGCGCTTGGACAGCATC | ( SEQ ID NO: 189 ) |
| ACCAGT | ||
| VEGFR2-P-2 | CGGCGCTTGGACAGCATCA | ( SEQ ID NO: 190 ) |
| CC | ||
| HER2-P-1 | CTCTCACACTGATAGACAC | ( SEQ ID NO: 191 ) |
| CAACCGC | ||
| HER2-P-2 | CGGTGTGAGAAGTGCAGCA | ( SEQ ID NO: 192 ) |
| AGCCC | ||
| EGFR-P-1 | CAATTCCACCGTGGCTTGC | ( SEQ ID NO: 193 ) |
| ATTGA | ||
| EGFR-P-2 | TCCACCGTGGCTTGCATTG | ( SEQ ID NO: 194 ) |
| ATA | ||
| VEGF-F-1 | CTCCACCATGCCAAGTGGT | ( SEQ ID NO: 195 ) |
| CCCA | ||
| VEGF-F-2 | CCACCATGCCAAGTGGTCC | ( SEQ ID NO: 196 ) |
| C | ||
| PPN-P-1 | CACCACAGAGGAGCAGGGC | ( SEQ ID NO: 197 ) |
| TAC | ||
| PPN-P-2 | AGCATGTCCTCCGGAAGCG | ( SEQ ID NO: 198 ) |
| CC | ||
| CCNB2-P-1 | AGAACCCTCAGCTCTGCAG | ( SEQ ID NO: 199 ) |
| TGAC | ||
| CCNB2-P-2 | ATTGGAAGTCATGCAGCAC | ( SEQ ID NO: 200 ) |
| ATGGC | ||
| ACTB-P-1 | CCCATCGAGCACGGCATCG | ( SEQ ID NO: 201 ) |
| T | ||
| ACTB-P-2 | ATGACGAGTCCGGCCCCTC | ( SEQ ID NO: 202 ) |
| CATC | ||
| 18S-P-1 | TGGTGTCGCGGAGCACGGA | ( SEQ ID NO: 203 ) |
| 18S-P-2 | CGCGCAAATTACCCACTCC | ( SEQ ID NO: 204 ) |
| CGA | ||
For detecting expressions, it needs to prepare two reaction systems: reaction system for gene of interest and reaction system for internal reference (ACTB or 18S rRNA). For example, for detecting the expression of ERCC1 gene, it needs to prepare ERCC1 detection system and ACTB or 18S rRNA detection system. For preparing ERCC1 detection system, the system needs to add ERCC1-F-1 (SEQ ID NO:57) or ERCC1-F-2 (SEQ ID NO:58) together with ERCC1-R-1 (SEQ ID NO:59) or ERCC1-R-2 (SEQ ID NO:60) primers, and ERCC1-P-1 (SEQ ID NO:171) or ERCC1-P-1 (SEQ ID NO:172) probe. For preparing ACTB detection system, the system needs to add ACTB-F-1 (SEQ ID NO:117) or ACTB-F-2 (SEQ ID NO:118) together with ACTB-R-1 (SEQ ID NO:119) or ACTB-R-2 (SEQ ID NO:120) primers, and ACTB-P-1 (SEQ ID NO:201) or ACTB-P-1 (SEQ ID NO:202) probe. For preparing 18S rRNA detection system, the system needs to add 18S-F-1 (SEQ ID NO:121) or 18S-F-2 (SEQ ID NO:122) together with 18S-R-1 (SEQ ID NO:123) or 18S-R-2 (SEQ ID NO:124) primers, and 18S-P-1 (SEQ ID NO:203) or 18S-P-1 (SEQ ID NO:204) probe.
4. Draw the standard curve
The standard curve is drawn based on the CT values obtained from the standard in Step 3. FIG. 33 shows the amplification curve of plasmid standard, in which the five rising curves represent, from left to right, the amplification curves of the plasmid standards 10 times diluted in turn. The horizontal axis represents cycle number, and the vertical axis represents fluorescent detection value. Accordingly, it is possible to draw the standard curve for calculation (FIG. 34). In FIG. 34, the horizontal axis represents the logarithm of copy number of the template, the vertical axis represents CT value, wherein the copy number of template=mass/(molecular weight)×6.02×10²³. In the present experiment, the plasmid consists of pMD18-T vector and an insert. All of the inserts have a length of about 100 bp, very short compared with that of pMD18-T vector. Therefore, they can be ignored. The copy number of 0.5 ng/μl plasmid is 1010.
5. Calculate the gene expression in a sample using standard curves Based on the standard curve, the copy numbers of gene of interest and internal reference gene can be calculated from the CT values of the sample. The ratio of copy numbers reflects the expression of gene of interest against internal reference gene. As shown in FIG. 35, the CT value of ERCC1 gene in a tissue sample is 14.98, whereas the CT value of ACTB gene is 15.88. According to each corresponding standard curve formula (FIG. 34), we can calculate the copy number for each of them. We then calculate out that the expression amount of ERCC1 is 0.47. The copy numbers and expression amount of other genes can be obtained similarly.
Example 27
Use of Positive Plasmid Standard in Detecting Genome DNA Gene Amplification
1. Prepare plasmid standard with different concentration
Dilute the plasmid standard 10 times in turn to 5E-1 ng/μl, 5E-2 ng/μl, 5E-3 ng/μl, and 5E-4 ng/μl, as the template for fluorescent quantitative PCR.
2. Prepare DNA of the sample using the method of Example 1.
3. The reaction system and condition for fluorescent quantitative PCR (Table 31, Table 32)
For detecting different genes, we should add corresponding primers (Table 29 and Table 30) and probes (Table 38) into the reaction system, wherein probes are labeled with fluorescence emitting groups which are selected from FAM, TET, HEX, or ROX, and fluorescence quenching groups which are selected from BHQ or TAMARA.
| TABLE 38 |
| Probes for detecting gene amplification by |
| fluorescent quantitative PCR |
| name | sequence |
| HER2-P-1 | CTCCTCCACTCACTAGCACAA | (SEQ ID NO: 205) |
| TGAC | ||
| HER2-P-2 | TCAAGGCTCAAGGTTCCTCTT | (SEQ ID NO: 206) |
| CTGC | ||
| ACTB-P-1 | TGGCACCCAGCACAATGAAG | (SEQ ID NO: 207) |
| ATCA | ||
| ACTB-P-2 | CCCATCGAGCACGGCATCGT | (SEQ ID NO: 208) |
For detecting gene amplication, it needs to prepare two reaction systems: reaction system for gene of interest and reaction system for internal reference (ACTB). HER2 amplification system needs to add O-HER2-F-1 (SEQ ID NO:125) or O-HER2-F-2 (SEQ ID NO:126) together with O-HER2-R-1 (SEQ ID NO:127) or O-HER2-R-2 (SEQ ID NO:128) primers, and HER2-P-1 (SEQ ID NO:205) or HER2-P-2 (SEQ ID NO:206) probe. ACTB amplification system needs to add ACTB-F-1 (SEQ ID NO:129) or ACTB-F-2 (SEQ ID NO:130) together with ACTB-R-1 (SEQ ID NO:131) or ACTB-R-2 (SEQ ID NO:132) and ACTB-P-1 (SEQ ID NO:207) or ACTB-P-2 (SEQ ID NO:208) probe.
4. Draw the standard curve
The standard curve is drawn based on the CT values obtained from the standard in Step 3. FIG. 36 shows the amplification curve of plasmid standard, in which the five rising curves represent, from left to right, the amplification curves of the plasmid standards 10 times diluted in turn which are 5E-1 ng/μl, 5E-2 ng/μl, 5E-3 ng/μl, 5E-4 ng/μl, and 5E-5 ng/μl. The horizontal axis represents cycle number, and the vertical axis represents fluorescent detection value. Accordingly, it is possible to draw the standard curve for calculation (FIG. 37). In FIG. 37, the horizontal axis represents the logarithm of copy number of the template, the vertical axis represents CT value, wherein the copy number of template=mass/(molecular weight)×6.02×10²³. In the present experiment, the plasmid consists of pMD18-T vector and an insert. Because the lengths of the inserts are almost identical, the biggest difference only lies in twenties bases, which can be ignored with respect to the length of 2692 bp for PMD18-T vector. Therefore, the ratio of copies of HER2 to ACTB plasmid standard≈the ratio of mass.
5. Calculate HER2 gene amplification in a sample
Based on the standard curve, the copy numbers of HER2 and ACTB genome DNA can be calculated from the CT values of the sample. The ratio of HER2 DNA to ACTB DNA reflects HER2 gene amplification amount. As shown in FIG. 38, the CT values of HER2 in paraffin embedded tissue sample and fresh tissue are 21.05 and 23.40 respectively, whereas the CT value of internal reference genes are 25.88 and 24.95 respectively. According to each corresponding standard curve formula (FIG. 37), we can calculate the copy number for each of them. We then calculate out that the gene amplification amounts in the tested samples are 281% and 161% respectively.
Claims
We claim:1. A plasmid standard for detection by fluorescent quantitative PCR, characterized in that the vector for said plasmid is pMD18-T, and the insert for said plasmid is any one of following (1)-(4) sequence to be detected, which is for detecting the mutation of corresponding gene,
(1) EGFR Exon 18, 19, 21;
(2) KRAS Codon 12, 13;
(3) BCRP position 482 amino acid; or
(4) BRAF position 600 amino acid.
2. A plasmid standard according to claim 1, characterized in that the insert for said plasmid is:
(1) SEQ ID NO: 209, SEQ ID NO: 210, SEQ ID NO: 211, SEQ ID NO: 212, SEQ ID NO: 213, SEQ ID NO: 214, SEQ ID NO: 215, SEQ ID NO: 216;
(2) SEQ ID NO: 217, SEQ ID NO: 218, SEQ ID NO: 219, SEQ ID NO: 220, SEQ ID NO: 221, SEQ ID NO: 222;
(3) SEQ ID NO: 223, SEQ ID NO: 224, SEQ ID NO: 225; or
(4) SEQ ID NO: 226, SEQ ID NO: 227.
3. A plasmid standard according to claim 1, characterized in that the primer for preparing and detecting said plasmid is:
(1) SEQ ID NO: 2, SEQ ID NO: 3, SEQ ID NO: 4, SEQ ID NO: 5, SEQ ID NO: 6, SEQ ID NO: 7, SEQ ID NO: 8, SEQ ID NO: 9, SEQ ID NO: 10, SEQ ID NO: 11, SEQ ID NO: 12, SEQ ID NO: 13, SEQ ID NO: 14, SEQ ID NO: 15, SEQ ID NO: 16, SEQ ID NO: 17, SEQ ID NO: 18, SEQ ID NO: 19, SEQ ID NO: 20, SEQ ID NO: 21, SEQ ID NO: 22, SEQ ID NO: 23;
(2) SEQ ID NO: 25, SEQ ID NO: 26, SEQ ID NO: 27, SEQ ID NO: 28, SEQ ID NO: 29, SEQ ID NO: 30, SEQ ID NO: 31, SEQ ID NO: 32, SEQ ID NO: 33, SEQ ID NO: 34, SEQ ID NO: 35, SEQ ID NO: 36, SEQ ID NO: 37, SEQ ID NO: 38;
(3) SEQ ID NO: 40, SEQ ID NO: 41, SEQ ID NO: 42, SEQ ID NO: 43, SEQ ID NO: 44, SEQ ID NO: 45, SEQ ID NO: 46, SEQ ID NO: 47, SEQ ID NO: 48, SEQ ID NO: 49; or
(4) SEQ ID NO: 51, SEQ ID NO: 52, SEQ ID NO: 53, SEQ ID NO: 54, SEQ ID NO: 55, SEQ ID NO: 56.
4. A plasmid standard according to claim 1, characterized in that the probe for detecting said plasmid is:
(1) SEQ ID NO: 133, SEQ ID NO: 134, SEQ ID NO: 135, SEQ ID NO: 136, SEQ ID NO: 137, SEQ ID NO: 138, SEQ ID NO: 139, SEQ ID NO: 140, SEQ ID NO: 141, SEQ ID NO: 142, SEQ ID NO: 143, SEQ ID NO: 144, SEQ ID NO: 145, SEQ ID NO: 146, SEQ ID NO: 147, SEQ ID NO: 148;
(2) SEQ ID NO: 149, SEQ ID NO: 150, SEQ ID NO: 151, SEQ ID NO: 152, SEQ ID NO: 153, SEQ ID NO: 154, SEQ ID NO: 155, SEQ ID NO: 156, SEQ ID NO: 157, SEQ ID NO: 158, SEQ ID NO: 159, SEQ ID NO: 160;
(3) SEQ ID NO: 161, SEQ ID NO: 162, SEQ ID NO: 163, SEQ ID NO: 164, SEQ ID NO: 165, SEQ ID NO: 166; or
(4) SEQ ID NO: 167, SEQ ID NO: 168, SEQ ID NO: 169, SEQ ID NO: 170.
5. A plasmid standard for detection by fluorescent quantitative PCR, characterized in that the vector for said plasmid is pMD18-T, and the insert for said plasmid is any one of following (1)-(17) sequence to be detected, which is for detecting the expression of corresponding gene:
(1) ERCC1 mRNA;
(2) RRM1 mRNA;
(3) BRCA1 mRNA;
(4) TUBB3 mRNA;
(5) ERBB3 mRNA;
(6) TOP2A mRNA;
(7) TYMS mRNA;
(8) RAP-80 mRNA;
(9) VEGFR1 mRNA;
(10) VEGFR2 mRNA;
(11) HER2 mRNA;
(12) EGFR mRNA;
(13) VEGF mRNA;
(14) PPN mRNA;
(15) CCNB2 mRNA;
(16) ACTB mRNA; or
(17) 18S rRNA.
6. A plasmid standard according to claim 3, characterized in that the insert for said plasmid is:
(1) SEQ ID NO: 228;
(2) SEQ ID NO: 229;
(3) SEQ ID NO: 230;
(4) SEQ ID NO: 231;
(5) SEQ ID NO: 232;
(6) SEQ ID NO: 233;
(7) SEQ ID NO: 234;
(8) SEQ ID NO: 235;
(9) SEQ ID NO: 236;
(10) SEQ ID NO: 237;
(11) SEQ ID NO: 238;
(12) SEQ ID NO: 239;
(13) SEQ ID NO: 240;
(14) SEQ ID NO: 241;
(15) SEQ ID NO: 242;
(16) SEQ ID NO: 243; or
(17) SEQ ID NO: 244.
7. A plasmid standard according to claim 1, characterized in that the primer for preparing and detecting said plasmid is:
(1) SEQ ID NO: 57, SEQ ID NO: 58, SEQ ID NO: 59, SEQ ID NO: 60;
(2) SEQ ID NO: 61, SEQ ID NO: 62, SEQ ID NO: 63, SEQ ID NO: 64;
(3) SEQ ID NO: 65, SEQ ID NO: 66, SEQ ID NO: 67, SEQ ID NO: 68;
(4) SEQ ID NO: 69, SEQ ID NO: 70, SEQ ID NO: 71, SEQ ID NO: 72;
(5) SEQ ID NO: 73, SEQ ID NO: 74, SEQ ID NO: 75, SEQ ID NO: 76;
(6) SEQ ID NO: 77, SEQ ID NO: 78, SEQ ID NO: 79, SEQ ID NO: 80;
(7) SEQ ID NO: 81, SEQ ID NO: 82, SEQ ID NO: 83, SEQ ID NO: 84;
(8) SEQ ID NO: 85, SEQ ID NO: 86, SEQ ID NO: 87, SEQ ID NO: 88;
(9) SEQ ID NO: 89, SEQ ID NO: 90, SEQ ID NO: 91, SEQ ID NO: 92;
(10) SEQ ID NO: 93, SEQ ID NO: 94, SEQ ID NO: 95, SEQ ID NO: 96;
(11) SEQ ID NO: 97, SEQ ID NO: 98, SEQ ID NO: 99, SEQ ID NO: 100;
(12) SEQ ID NO: 101, SEQ ID NO: 102, SEQ ID NO: 103, SEQ ID NO: 104;
(13) SEQ ID NO: 105, SEQ ID NO: 106, SEQ ID NO: 107, SEQ ID NO: 108;
(14) SEQ ID NO: 109, SEQ ID NO: 110, SEQ ID NO: 111, SEQ ID NO: 112;
(15) SEQ ID NO: 113, SEQ ID NO: 114, SEQ ID NO: 115, SEQ ID NO:116;
(16) SEQ ID NO: 117, SEQ ID NO: 118, SEQ ID NO: 119, SEQ ID NO: 120; or
(17) SEQ ID NO: 121, SEQ ID NO: 122, SEQ ID NO: 123, SEQ ID NO: 124.
8. A plasmid standard according to claim 1, characterized in that the probe for detecting said plasmid is:
(1) SEQ ID NO: 171, SEQ ID NO: 172;
(2) SEQ ID NO: 173, SEQ ID NO: 174;
(3) SEQ ID NO: 175, SEQ ID NO: 176;
(4) SEQ ID NO: 177, SEQ ID NO: 178;
(5) SEQ ID NO: 179, SEQ ID NO: 180;
(6) SEQ ID NO: 181, SEQ ID NO: 182;
(7) SEQ ID NO: 183, SEQ ID NO: 184;
(8) SEQ ID NO: 185, SEQ ID NO: 186;
(9) SEQ ID NO: 187, SEQ ID NO: 188;
(10) SEQ ID NO: 189, SEQ ID NO: 190;
(11) SEQ ID NO: 191, SEQ ID NO: 192;
(12) SEQ ID NO: 193, SEQ ID NO: 194;
(13) SEQ ID NO: 195, SEQ ID NO: 196;
(14) SEQ ID NO: 197, SEQ ID NO: 198;
(15) SEQ ID NO: 199, SEQ ID NO: 200;
(16) SEQ ID NO: 201, SEQ ID NO: 202; or
(17) SEQ ID NO: 203, SEQ ID NO: 204.
9. A plasmid standard for detection by fluorescent quantitative PCR, characterized in that the vector for said plasmid is pMD18-T, and the insert for said plasmid is any one of following (1)-(17) sequence to be detected, which is for detecting the amplification of corresponding gene:
(1) HER2 genome DNA; or
(2) ACTB genome DNA.
10. A plasmid standard according to claim 5, characterized in that the insert for said plasmid is:
(1) SEQ ID NO: 245; or
(2) SEQ ID NO: 246.
11. A plasmid standard according to claim 1, characterized in that the primer for preparing and detecting said plasmid is:
(1) SEQ ID NO:125, SEQ ID NO:126, SEQ ID NO:127, SEQ ID NO:128; or
(2) SEQ ID NO:129, SEQ ID NO:130, SEQ ID NO:131, SEQ ID NO:132.
12. A plasmid standard according to claim 1, characterized in that the probe for detecting said plasmid is:
(1) SEQ ID NO: 205, SEQ ID NO: 206; or
(2) SEQ ID NO: 207, SEQ ID NO: 208.
Images & Drawings included:


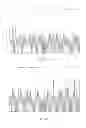
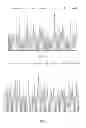
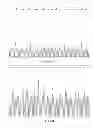
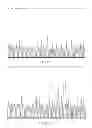


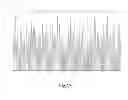


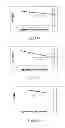


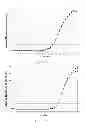
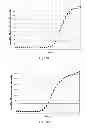
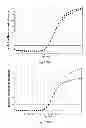


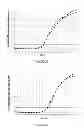


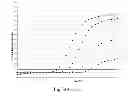


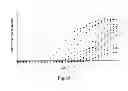
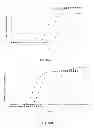


Sources:
- United States Patent and Trademark Office - verify current appl. status at the USPTO↗
Recent applications in this class:
- » 20250171848 2025-05-29
METHODS FOR SPATIAL ANALYSIS USING RNA-TEMPLATED LIGATION - » 20250163509 2025-05-22
SURFACE CAPTURE OF TARGETS - » 20250163508 2025-05-22
ANALYSIS SYSTEM, PLATE, AND ANALYSIS METHOD - » 20250146070 2025-05-08
METHOD FOR DETERMINING WHETHER ASC IS INCLUDED AT HIGH PURITY IN ADIPOSE TISSUE-DERIVED CELL POPULATION - » 20250129419 2025-04-24
REAGENTS FOR LABELING BIOMOLECULES AND USES THEREOF - » 20250129418 2025-04-24
MICROCAPSULES COMPRISING BIOLOGICAL SAMPLES, AND METHODS FOR USE OF SAME - » 20250109438 2025-04-03
METHOD FOR ENRICHING AND DETECTING LOW-ABUNDANCE MUTANT DNA - » 20250101514 2025-03-27
METHOD FOR DETECTING MULTIPLE TARGET NUCLEIC ACIDS - » 20250092458 2025-03-20
Scaffolded Chromophores for Nucleic Acid Detection and Methods and Uses Thereof - » 20250084478 2025-03-13
MULTIVALENT BINDING COMPOSITIONS WITH REACTIVE GROUPS