SAGD CONTROL IN LEAKY RESERVOIRS
US20140000876A1
2014-01-02
13/928,895
2013-06-27
Abstract:
The use of a water recycle ratio for controlling at least one Steam Assisted Gravity Drainage (SAGD) parameter in a leaky bitumen reservoir. Further, a process to control a steam injection rate for an individual SAGD well pair, in a leaky bitumen reservoir wherein the process replaces a pressure control for an SAGD steam injection rate with a volume control determined by a Water Recycle Ratio (WRR).
Assignee:
- Nexen Inc. 20 🇨🇦 Calgary, Canada
Interested in similar patents?
Get notified when new applications in this technology area are published.
Classification:
E21B43/12 » CPC main
Methods or apparatus for obtaining oil, gas, water, soluble or meltable materials or a slurry of minerals from wells Methods or apparatus for controlling the flow of the obtained fluid to or in wells
Description
BACKGROUND OF THE INVENTION
Steam assisted gravity drainage (SAGD) is now the leading in situ thermal enhanced oil recovery (EOR) process to recover bitumen from Alberta's oil sands. The oilsands are one of the world's largest hydrocarbon deposits. SAGD has two parallel horizontal wells up to about 1000 m long, in a vertical plane, separated by about 5 m. The upper steam injector is controlled by injection steam rate to attain a target pressure set by the operator (i.e. “pressure control”). The lower bitumen and water producer is controlled by pumping rate (or other methods) to maintain a fluid temperature lower than saturated steam (sub-cool or steam-trap control) to ensure no live steam breaks through to the well.
The above control methods work well where the steam chamber is contained, even if the target pressure is higher than the native reservoir pressure. But, the oil sands have a significant portion of the resource that is impaired by water zones (top water, bottom water, interspersed lean zones). These can cause the reservoir to be “leaky” with significant water influx or egress. Under these conditions, SAGD pressure control for steam injection does not work well. Pressure gradients need only be modest to transport large volumes of water and disrupt SAGD. It is hard to choose an appropriate pressure target or to accurately measure an appropriate pressure to minimize the harmful effects of a leaky reservoir. This invention describes an alternate volume control method for SAGD steam injection in leaky reservoirs. The technique involves using WRR (the water recycle ratio) as the key measurement and control parameter. WRR is volume ratio (measured as water) of water produced to steam injected.
The Athabasca bitumen resource in Alberta, Canada is one of the world's largest deposits of hydrocarbons. As describe above, a significant portion of the resource can be impaired by a water zone—causing the reservoir to be “leaky.” Also, The Athabasce bitumen resource in Alberta, Canada is unique for the following reasons:
-
- (1) The resource, in Alberta, contains about 2.75 trillion bbls. of bitumen (Butler, R. M., “Thermal Recovery of Oil & Bitumen”, Prentice Hall, 1991), including carbonate deposits. This is one of the world's largest liquid hydrocarbon resources. The recoverable resource, excluding carbonate deposits, is currently estimated as 170 billion bbls −20% mining (34 billion bbls.) and 80% in-situ EOR (136 billion bbls) (CAPP, “The Facts on Oilsands”, November 2010). The in situ EOR estimate is based on SAGD, or a similar process.
- (2) Conventional oil reservoirs have a top seal (cap rock) that prevents oil from leaking and contains the resource. Bitumen was formed by bacterial degradation of lighter source oil to a stage where the degraded bitumen is immobile under reservoir conditions. Bitumen reservoirs can be self-sealed (no cap rock seal). If an in situ EOR process hits the “ceiling”, the process may not be contained and it can easily be contaminated by water or gas from above the bitumen.
- (3) Bitumen density is close to the density of water or brine. Some bitumens are denser than water; some are less dense than water. During the bacterial-degradation and formation of bitumen, the hydrocarbon density can pass through a density transition and water can, at first, be less dense than the reservoir “oil”. Bitumen reservoir water zones are found above the bitumen (top water), below the bitumen (bottom water), or interspersed in the bitumen net pay zone (water lean zones (WLZ)).
- (4) Most bitumen was formed in a fluvial or estuary environment. Focusing on reservoir impairments, this has two consequences. First, there will be numerous reservoir inhomogeneities. Second, the scale of the inhomogeneities is likely to be less than the scale of a SAGD recovery pattern (FIG. 1) or less than about 1000 m in size. The expectation is that an “average” SAGD EOR process will encounter several inhomogeneities within each recovery pattern.
SAGD is a delicate process. Temperatures and pressures are limited by saturated steam properties. Gravity drainage is driven by a pressure differential as low as 25 psia. Low temperatures (in a saturated steam process) and low pressure gradients make the SAGD process susceptible to impairments from reservoir inhomogeneities, as above.
This invention describes an alternate volume control method for SAGD steam injection in leaky reservoirs. The technique involves using WRR (the water recycle ratio) as the key measurement and control parameter. WRR is volume ratio (measured as water) of water produced to steam injected.
SUMMARY OF THE INVENTION
The following acronyms will be used herein.
| AOGR | American Oil & Gas Reporter | |
| CAPP | Canadian Association of Petroleum Producers | |
| CMG | Computer Modeling Group (Calgary) | |
| CSS | Cyclic Steam Stimulation | |
| EOR | Enhanced Oil Recovery | |
| ETOR | Energy to Oil Ratio (MMBTU/bbl) | |
| ESP | Electric Submersible Pump | |
| GD | Gravity Drainage (chamber) | |
| JCPT | Journal of Canadian Petroleum Technology | |
| LZ | Lean Zone | |
| P | Pressure | |
| SAGD | Steam Assisted Gravity Drainage | |
| SOR | Steam to Oil Ratio | |
| SPE | Society of Petroleum Engineers | |
| T | Temperature | |
| WLZ | Water Lean Zone | |
| WRR | Water Recycle Ratio | |
According to one aspect of the invention, there is a provided a use of water recycle ratio for controlling at least one SAGD parameter in a leaky bitumen reservoir. In one embodiment, said parameter is selected from volume rate, pressure, temperature, and combinations thereof.
According to another aspect of the invention, there is provided a process to control SAGD steam injection rate for an individual SAGD well pair in a leaky bitumen reservoir, comprising replacing pressure control of said SAGD steam injection rate with volume control.
Preferably, said leaky bitumen reservoir is determined by geological knowledge of an interspersed WLZ, top water or bottom water in a SAGD pattern volume, more preferably said leaky bitumen reservoir is determined by a cold water injection test prior to SAGD initiation, most preferably the reservoir is deemed leaky when WRR is measured and after 200 days of more of SAGD operation using pressure control for steam injection, and the WRR varies from 1.0 by more than 10 percent.
Preferably, said process further comprises sub-cool control (steam-trap control) for liquids production (bitumen+water).
In one embodiment, said volume rate control is instituted by injecting a pre-set target volume rate of steam into the SAGD injector well.
In another embodiment, said volume rate control is instituted by
-
- i. Continually measuring WRR for the SAGD well pair
- ii. Establishing a target for WRR; and
- iii. If the actual WRR is less than the target WRR, reducing the steam injection rate until the WRR target is achieved; or
- iv. If the actual WRR is greater than the target WRR, increasing the steam injection rate until the WRR target is achieved.
Preferably, for a near-homogeneous reservoir the target WRR is between 0.9 and 1.0
Preferably, said process is applied to a leaky reservoir with a high-water-saturation zone in or adjacent to the bitumen pay zone, where the target WRR is set at between 1.0 and 1.5.
In one embodiment, said leaky reservoir is caused by an interspersed water lean zone (WLZ) within the net pay zone.
In another embodiment, said leaky reservoir is caused by a top water zone. And in yet another embodiment, said leaky reservoir is caused by a bottom water zone. In yet another embodiment, said leaky reservoir is caused by multiple factors comprising WLZ, top water and/or bottom water.
Preferably, said bitumen is a hydrocarbon with <10 API density and >100,000 cp viscosity, at native reservoir conditions.
In one embodiment, SAGD pressure in the reservoir does not exceed the reservoir parting pressure, for unconsolidated reservoirs, or the reservoir fracturing pressure, for consolidated reservoirs.
Preferably, the maximum SAGD pressure allowed is about 80 percent of the parting pressure and/or the fracturing pressure.
In another embodiment, the minimum SAGD operating pressure is equal to the native reservoir pressure.
In one embodiment, the bitumen reservoir is located in the Athabasca region of Alberta, Canada.
BRIEF DESCRIPTION OF THE DRAWINGS
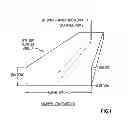
FIG. 1 depicts a typical SAGD Well Configuration
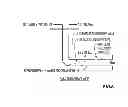
FIG. 2 depicts SAGD stages
FIG. 3 depicts Saturated Steam Properties
FIG. 4 depicts Bitumen and Heavy Oil Viscosities
FIG. 5 depicts SAGD Productivity per Well
FIG. 6 depicts SAGD Hydraulic Limits
FIG. 7 depicts Interspersed Bitumen Lean Zones
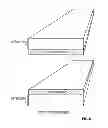
FIG. 8 depicts Top/Bottom Water: Oilsands
FIG. 9 depicts SAGD Simulation
FIG. 10 depicts WRR Performance for a Homogeneous Reservoir with Contained SAGD GD Chamber (Single well pair)
FIG. 11 depicts Bitumen Voidage and Steam Volumes
FIG. 12 depicts Well Pair Cross-Flow Model
FIG. 13 depicts SAGD performance Case 1
FIG. 14 depicts SAGD performance Case 2
FIG. 15 depicts SAGD performance Case 2(a)
FIG. 16 depicts SAGD performance Case 3
FIG. 17 depicts SAGD performance Case 4
FIG. 18 depicts SAGD performance Case 5
FIG. 19 depicts SAGD cumulative well pair performance of Cases 1-3
FIG. 20 depicts SAGD cumulative well pair performance of Cases 1, 4 and 5
FIG. 21 depicts SAGD dual well pair production/performance of Base Case and Case 2
FIG. 22 depicts SAGD pressure control performance of connected well pairs
FIG. 23 depicts SAGD WRR performance of connected well pairs Case 3
FIG. 24 depicts SAGD WRR performance of connected well pairs Case 1 and 3
FIG. 25 depicts bitumen production of individual well pair Case 3
FIG. 26 depicts bitumen production rates of two well pair of Base Case and Case 3
FIG. 27 depicts SOR Performance of Base Case and Case 3
DETAILED DESCRIPTION OF THE INVENTION
SAGD is a bitumen EOR process that uses saturated-steam to deliver energy to a bitumen reservoir. FIG. 1 shows the basic SAGD geometry, using twin, parallel horizontal wells (2, 4) (up to about 1000 m long) separated by about 2 to 8 m above the bottom of the bitumen zone (floor 8). The upper well (2) is in the same vertical plane and injects saturated steam into the reservoir. The steam heats the bitumen and the reservoir matrix. As the interface between steam and cold bitumen moves outward and upward it creates a gas, gravity-drainage chamber (FIG. 2). The heated bitumen and condensed steam drain, by gravity, to the lower horizontal well (4) that produces the liquids. The heated liquids (bitumen+water) are pumped (or conveyed) to the surface using ESP pumps or a gas-lift system.
FIG. 2 shows how SAGD matures. A young steam chamber (1) has bitumen drainage from steep sides and from the chamber ceiling When the chamber grows (2) and hits the top of the net pay zone, drainage from the chamber ceiling stops and the slope of the side walls decreases as the chamber continues to grow outward. Bitumen productivity peaks at about 1000 bbls/d, when the chamber hits the top of the net pay zone and falls as the chamber grows outward (3), until eventually (10-20 years) the economic limit is reached.
Since the produced fluids are at/near saturated steam temperatures, it is only the latent heat of the steam that contributes to the process in the reservoir. It is important to ensure that steam is high quality as it is injected into the reservoir.
A SAGD process in a good homogeneous reservoir may be characterized by only a few measurements:
-
- (1) Saturated steam T (or P)
- (2) Bitumen production rate (the key economic factor), and
- (3) SOR—a measure of process efficiency
For an impaired reservoir, a fourth measurement may be added—the water recycle ratio (WRR). WRR enables one to see how much of the injected steam is returned as condensed water.
SAGD operation, in a good-quality reservoir, is straightforward. Steam injection rate into the upper horizontal well and steam pressure are controlled by pressure targets chosen by the operator. If the pressure is below the target, steam pressure and injection rates are increased. The opposite is done if pressure is above the target. Production rates from the lower horizontal well are controlled to achieve sub-cool targets in the average temperature of the production fluids. The sub-cool is the difference in temperature of saturated steam and the actual temperature of produced liquids (bitumen+water). Produced fluids are kept at a lower T than saturated steam to ensure that live steam doesn't get produced. 20° C. is a typical sub-cool target. This is also called steam-trap control.
The SAGD operator has two choices to make—the sub-cool target and the operating pressure of the process. Sub-cool is safety issue, but operating pressure is more subtle and usually more important. The higher the pressure, the higher the temperature—linked by the properties of saturated steam (FIG. 3). As operating temperature rises, so does the temperature of the heated bitumen which, in turn, reduces bitumen viscosity. Bitumen viscosity is a strong function of temperature (FIG. 4). The productivity of a SAGD well pair is proportional to the square root of the inverse bitumen viscosity (Butler (1991)). So the higher the pressure, the faster bitumen can be recovered—a key economic performance factor.
But, efficiency is lost if pressures are increased. It is only the latent heat of steam that contributes (in the reservoir) to SAGD. As steam P and T are increased to improve productivity, the latent heat content of steam drops (FIG. 3). In addition, as P and T are increased, more energy is needed to heat the reservoir matrix up to saturated steam's T and heat losses increase (SOR and ETOR increase).
The SAGD operator usually opts to maximize economic returns, so the operator increases P and T as much as possible. Pressures are usually much greater than native reservoir P. A few operators have gone too far and exceeded parting pressure (fracture pressure) and caused a surface breakthrough of steam and sand (Roche, P., “Beyond Steam”, New Tech. Mag., September 2011). Bitumen productivity peaks at about 1000 bbl/d for the best reservoirs, but it can be significantly impaired for the poorer reservoirs (FIG. 27).
There also may be a hydraulic limit for SAGD (FIG. 6). The hydrostatic head between the two SAGD wells (2, 4) is about 8 psia (56 kPa). When pumping or producing bitumen and water (12), there is a natural pressure drop in the well due to frictional forces. If this pressure drop exceeds the hydrostatic head, the steam/liquid interface may be “tilted” and intersect the producer or injector well (2,4). If the producer (4) is intersected, steam can break through. If the injector (2) is intersected, it may be flooded and the effective injector length may be shortened. For current standard pipe sizes and a 5 m spacing between wells (2,4), SAGD well lengths are limited to about 1000 m.
One of the common remedies for an impaired SAGD reservoir, that has water incursion, is to lower the SAGD operating pressure to “match” native reservoir pressure—also called low-pressure SAGD. But this at best is difficult and at worst impractical for the following reasons:
-
- (1) There is a natural hydrostatic pressure gradient in the net pay region. For example for 30 m of net pay, the hydrostatic head is about 50 psi (335 kPa). Because the steam chamber is a gas, it is at constant pressure. What operating pressure is chosen to match reservoir P?
- (2) There are also lateral pressure gradients in SAGD. The pipe size for the SAGD producer is chosen so that the natural pressure gradient, when pumping, is less than the hydrostatic pressure difference between SAGD steam injector and bitumen producer (about 8 psi or 56 kPa). How can SAGD P match to the reservoir P if there is a lateral pressure gradient?
- (3) Pressure control for SAGD is difficult and measurements are inexact. A pressure control uncertainty of ±200 kPa is to be expected.
The above control methods work well where the steam chamber is contained, even if the target pressure is higher than the native reservoir pressure.
As discussed above, the oil sands have a significant portion of the resource that is impaired by water lean zones (top water, bottom water, interspersed lean zones). These may cause the reservoir to be “leaky” with significant water influx or egress. Under these conditions, SAGD pressure control for steam injection does not work well. Pressure gradients need only be modest to transport large volumes of water and disrupt SAGD. It is hard to choose an appropriate pressure target or to accurately measure an appropriate pressure to minimize the harmful effects of a leaky reservoir.
Water Lean Zones (WLZ)
Water Lean Zones (WLZ) with high water saturation may be at the top of the bitumen reservoir (top water), at the bottom (bottom water), or interspersed within the pay zone.
FIG. 7 depicts an interspersed WLZ 18. When confronted with this situation, the following is observed:
-
- i. Interspersed WLZ have to be heated so that GD steam chambers can envelop the zone and continue growth of the GD chamber above and around the WLZ blockage.
- ii. A WLZ has a higher heat capacity than a bitumen pay zone. Table 3 below shows a 25% heat capacity increase for a WLZ compared to a pay zone.
- iii. A WLZ also has higher heat conductivity than a bitumen pay zone. For example, WLZ has more than double the heat conductivity of the bitumen pay zone (Table 2).
- iv. So, even if the WLZ is not recharged by an aquifer or bottom/top water, the WLZ will incur a thermal penalty as the steam chamber moves through it. Also, since the WLZ has little bitumen, bitumen productivity will also suffer as the steam zone moves through a WLZ.
- v. SAGD steam can heat WLZ water to/near saturated steam T, but it cannot vaporize WLZ water. Breaching of the WLZ, will require water to drain as a liquid.
- vi. If the interspersed WLZ acts as a thief zone, the problems are most severe. The WLZ can channel steam away from the SAGD steam chamber. If the steam condenses prior to removal, the water is lost but the heat can be retained. But, if the steam exits the GD steam chamber prior to condensing, both the heat and the water are lost to the process.
- vii. The obvious remedy is to reduce SAGD pressures to minimize the outflow of steam or water. But, if this is done, bitumen productivity will be reduced.
- viii. If pressures are reduced too far or if local pressures are too low, cold water from a WLZ thief zone can flow into the steam GD chamber or toward the SAGD production well. If this occurs, water production can exceed steam injection. More importantly, for a large water inflow, steam trap control (sub-cool control) is lost as a method to control SAGD.
- ix. Interspersed WLZ's can distort SAGD steam chamber shapes, particularly if the WLZ is limited in lateral size. Normal growth is slowed down as the WLZ is breached. This can reduce productivity, decrease efficiency, and limit recovery.
With respect to bottom water zones 20, as best seen in FIG. 8, the issues are similar to interspersed WLZ except that 1) bottom water underlies the bitumen and 2) the usual expectation is that bottom water is more active. SAGD can operate at pressures greater than reservoir pressure as long as the following occurs: 1) pressure drops in the production well (due to flow/pumping) do not reduce local pressures below reservoir P and 2) the bottom of the reservoir, underneath the production well, is “sealed” by high-viscosity immobile bitumen (basement bitumen). As the process matures, basement bitumen will become heated by conduction from the production well. After a few years, this bitumen will become partially mobile and SAGD pressure will need to be reduced to match reservoir pressure. This can be a delicate balance. SAGD pressures cannot be too high or a channel may form, (reverse cone) allowing communication with the bottom water. SAGD steam pressures cannot be too low either or water will be drawn from the bottom water (cresting). If this occurs, water production will exceed steam injection. The higher the pressure drops in the production well, the more delicate the balance and the more difficult it is to achieve a balance.
If the reservoir is inhomogeneous or if the heating pattern is inhomogeneous, the channel or crests can be partial and the onset of the problem is accelerated.
In respect of top water 22 (as best seen in FIG. 8), again, the issues are similar to interspersed WLZ and bottom water, with the expectation that top water is also an active water supply. The problems are similar to bottom water, as above, except that SAGD wells are further away from top water. So, the initial period—when the process can be operated at higher pressures than reservoir pressure—can be extended compared to bottom water. The pressure drop in the production well is less of a concern because it is far away from the ceiling. The first problem is likely to be steam breaching the top water interface. If the top water is active, water will flood the chamber and may shut the SAGD process down.
Industry has the following experience with WLZ
-
- i. Suncor's Firebag SAGD project and Nexen's Long Lake project each have reported interspersed WLZ that can behave as thief zones when SAGD pressures are too high, forcing the operators to choose SAGD pressures that are lower than desirable (Triangle Three Engineering, “Technical Audit report, Gas Over Bitumen Technical Solutions”, December 2010).
- ii. Water encroachment from bottom water for SAGD can also cause more well workovers (i.e. downtime) because of unbalanced steam and lift issues (Jorshari, K. “Technology Summary”, JCPT, March 2011).
- iii. Simulation studies of a particular reservoir concluded that a 3 m standoff (3 m from the SAGD producer to the bitumen/water interface) was sufficient to optimize production with bottom water, allowing a 1 m control for drilling accuracy (Akram, F. ‘Reservoir Simulation Optimizes SAGD’, American O&G Reporter, September 2010). Allowing for coring/seismic control, the standoff may be higher.
- iv. Nexen and OPTI have reported that interspersed WLZ seriously impedes SAGD bitumen productivity and increase SOR beyond original expectations at Long Lake, Alberta (Vanderklippe, N. “Long Lake Project hits Sticky Patch”, Globe & Mail, Feb. 10, 2011), (Bouchard, J. et al., “Scratching below the Surface Issues at Long Lake—Part 2”, Raymond James, Feb. 11, 2011), (Nexen Inc. “Second Quarter Results”, press release, Aug. 4, 2011), (Haggett, J et al., “Update 3-Long Lake oilsands output may lag targets”, Reuters, Feb. 10, 2011).
- v. Long Lake lean zones have been reported to make up from less than 3 to 5% (v/v) of the reservoir (Vanderklippe (2011)), Nexen Inc (2011)).
- vi. Oilsands Quest reported a bitumen reservoir with top lean zones that are “thin to moderate”. Some areas had a “continuous top thick lean zones” (Oilsands Quest, “Management Presentation”, January 2011).
- vii. Johnson reported Connacher's oil sand project with a top bitumen water lean zone. The lean zone was reported to differ from an aquifer in two ways—“the lean zone is not charged and it limited size” (Johnson, M. D. et al., “Production Optimization at Connacher's Pod One (Great Divide) Oil Sands Project”, SPE 145091-MS, 2011).
viii. Thimm reported on Shell's Peace River Project, including a “basal lean bitumen zone”. The statistical analysis of the steam soak process (CSS) showed performance correlated with the geology of the lean zone (i.e. the lean zone quality was the important factor). The process chosen took advantage of WLZ properties, particularly the good steam injectivity in WLZ's (Thimm, H. F. et al., “A Statistical Analysis of the Early Peace River Thermal Project Performance”, JCPT, January, 1993).
ix. A cold water injectivity test is a way to potentially detect connections between SAGD wells and WLZ, top water and/or bottom water (Aherne, A. L. et al., “Fluid Movement in the SAGD Process: A Review of the Dover Project”, Can. Int'l Pet. Conf., Jun. 13, 2006).
The usual method of SAGD operations control for a homogeneous reservoir is to first choose an operating pressure, in excess of the native reservoir pressure P, to try to maximize bitumen productivity. Then, with the chosen P as a target, the steam injection rate and pressure is adjusted to attain the pressure target (pressure control). For reason discussed in the previous section, if a WLZ is breached, the normal operating procedure becomes difficult.
This invention comprises a method to improve, preferably optimize SAGD performance in WLZ reservoirs (including top water and bottom water cases) or where the reservoir is a “leaky” reservoir. A “leaky” reservoir loses injection fluids if operating P>native reservoir P or has encroachment of fluids if operating P<native reservoir P. The invention further comprises measurement of the water recycle ratio (WRR) for reservoirs containing WLZ zones. WRR is the volume ratio of produced water/injected steam, where steam injection is measured as a liquid-water equivalent. Rather than pressure control on steam injection rates, steam injection should be adjusted to attain a WRR target for each SAGD well.
EXAMPLE 1
A simulation of a homogeneous SAGD EOR process—a single well pair—was conducted with the following key assumptions:
-
- (1) EXOTHERM™ numerical model for SAGD
- (2) A homogeneous Athabasca reservoir with no reservoir impairments
- (3) Generic properties for bitumen
- (4) 25 m net pay
- (5) 800 m SAGD wells, 100 m spacing, 5 m separation
- (6) 10° C. subcool for production control
- (7) 3 MPa pressure for injection control
- (8) 4 months start-up period using steam circulation
- (9) Discretized well bore model, accounting for well bore pressure gradients.
FIG. 9 shows the predicted performance. As can be seen, the predicted steam injection rate peaks at 2936 bbls/day and bitumen production rate peaks at 1002 bbls/day. FIG. 10 shows the predicted WRR performance. The WRR started around 0.9 and increased gradually to greater than 0.99 after 1200 days (3¼ years).
Although not wanting to be bound by this, it is understood there are two reasons why, for a contained heterogeneous reservoir, WRR will approach but not exceed 1.0 (except for short excursions), namely:
-
- (1) Some of the produced bitumen voidage is occupied by steam to form the steam GD chamber. Assuming this voidage replacement is done by saturated steam, FIG. 11 shows the percentage steam injected occupying bitumen voidage as a result of this. Depending on pressure and SOR, steam vapour can be lost to recycle in the range of 0.2 to 0.5 percent. If this was the only factor, one should expect the WRR to trend between 99.5 to 99.8% of injected steam.
- (2) Some of the produced bitumen voidage will be occupied by liquid water, particularly on the edges of the steam GD chamber and/or near areas with heat losses (i.e. near the ceiling). The expectation is this to be dominant near the start of the SAGD process and tail off as the steam inventory builds.
- (3) Near the end of the SAGD process, bitumen production is low and SOR increases rapidly. Most of the steam injected is used to compensate for heat losses. Little or no bitumen voidage is created and steam/water “short circuits”. Again, this is a reason for WRR to approach 1.0.
FIG. 10 shows how a WRR-control strategy would work for SAGD in a homogeneous, sealed reservoir. An early WRR target, up to about year 2, would be for WRR=0.95. After year 2, the target can be raised to WRR=0.98.
EXAMPLE 2
Simulations of a SAGD process in an impaired bitumen reservoir—with a significant WLZ connecting adjacent SAGD well pairs—were also conducted. The model used assumed the following:
-
- (1) EXOTHERM™ SAGD numerical model;
- (2) 30 m net pay; dual well pairs (FIG. 12);
- (3) WLZ impairment was a limited lean zone, connecting both SAGD patterns as shown in FIG. 12;
- (4) The reservoir was otherwise homogeneous with Kh=5D ; Kv=2.5D ; So=80% in the main reservoir, So=15% in the lean zone;
- (5) In the WLZ, Sw=85%;
- (6) In the main reservoir Sw=20%; 15% irreducible, 5% mobile;
- (7) Well length=800 m; well separation=5 m; pattern spacing=100 m;
- (8) Target SAGD P=2000 kPa for both pairs;
- (9) Sub cool target constant for all case studies (10° C.);
5 cases were run (Table 1) and summarized as follows:
Case 1—Base Case=Same pressure in both well pairs (6 m thick WLZ with shale cap, WLZ is 10% of pay zone volume);
Case 2—allow 300 kPa ΔP between well pairs;
Case 2(a)—extend production forecast to 3 yrs+;
Case 3—Same as Case 2, but after 1 year stop SAGD pressure control and shift to constant volume control (steam injection is constant);
Case 4—Same as Case 2, but with 3 m thick WLZ (WLZ is 5% of pay zone volume);
Case 5—Same as Case 3, but with 3 m thick WLZ;
FIGS. 13, 14, 15, 16, 17 and 18 show the predicted performance for each well pair, for Cases 1, 2, 2(a), 3, 4 and 5 respectively. FIGS. 19 and 20 show the cumulative performance of both well pairs for the above cases. FIGS. 21 and 22 show cumulative bitumen productivity for Case 1 (Base Case) and Case 2. FIG. 23 shows WRR performance for Case 3 for each well pair. FIG. 24 shows cumulative WRR performance for Case 1 vs. Case 3. FIG. 25 shows individual well pair bitumen performance for Case 3.
Based on FIGS. 13-25, the following comments are noteworthy:
-
- (1) Theoretically, pressure control is adequate for SAGD. But, in practice it is difficult to measure pressure to a greater accuracy of about ±200 kPa (or about 10%). The hydrostatic head in a 30 m reservoir is about 335 kPa. Natural, lateral pressure drops in the production well can be up to over 50 kPa.
- (2) If there are active water zones, a small pressure differential can make a big difference. A 300 kPa pressure difference was enough to flood and quench SAGD in a well-pair (FIG. 14) in about 1 year.
- (3) FIG. 15 shows that the quenched well-pair is revitalized over the long term. However, steam injection had ceased (well pair 1) and steam migrated through the WLZ from well pair 2. In effect, well pair 1 undergoes a steam flood starting at about 540 days (1.5 years).
- (4) The thickness of the WLZ has only a minor effect on performance. If one compares FIGS. 14 and 17 and FIGS. 16 and 18, the performance factors for each well pair are about the same. WLZ thickness is not a sensitive factor.
- (5) If after well pair 1 has watered off, steam is injected at a fixed rate in each well pair, some performance can be recovered (FIG. 16). The process has switched from pressure control to volume control. An alternate way to accomplish the same is to switch to WRR control.
- (6) If one focuses on cumulative performance (both well pairs taken together), FIGS. 19 and 20 show that balanced production Case 1 is the preferred route. Unbalanced production (ΔP between wells=300 kPa) results in about half the productivity (FIG. 26). Productivity can be restored partially by volume or WRR control (Case 3, Case 5). WLZ thickness (Case 2 vs. Case 4) is not an important variable.
- (7) FIG. 23 shows how volume control dramatically influences WRR. Alternately, it shows how WRR control would lead to short-term volume control.
- (8) FIG. 24 shows that WRR profiles are similar for cumulative well pairs (well pair 1+well pair 2).
- (9) FIG. 27 shows how efficiency (as measured by SOR) is improved for the balanced operation.
For the purposes of this invention, a “leaky” SAGD pattern is one that produces an unusual amount of water. The “leaky” SAGD pattern may have water leaks in/out of the pattern volume to other portions of the reservoir; it may have water leaks to/from an adjacent reservoir SAGD pattern; or, it may produce unusual water volumes from WLZ within the reservoir. In order to further define “leakiness,” the WRR will be used as an indicator (the volume ratio of produced water to steam injected, where steam is measured as a water-volume equivalent).
As discussed above, for a homogeneous reservoir without fluid leaks and without WLZ in the pay zone, FIG. 10 shows the expected WRR behaviour. In the early SAGD stages (100-300 days), WRR is between 0.90-0.95. For this period, the GD steam chamber is forming, and the GD area is heating up. An inventory of liquid water is created in the reservoir. As the SAGD process continues, WRR increases gradually from about 0.96 to 0.99. If the bitumen voidage is occupied by steam only, one would expect WRR to be greater than 0.99 (FIG. 11). For the later stages of SAGD, bitumen production (and voidage) is small and the WRR approaches the 0.99 value (FIG. 10). A reasonable target for WRR—for a perfectly contained SAGD GD chamber and a homogeneous reservoir—during the peak period of SAGD (500-1500 days) is about 0.97.
FIG. 23 shows WRR in a leaky reservoir and how a leaky reservoir is defined. If WRR deviates from 1.0 by more than ±0.10 after 200 or more days of continuous SAGD using normal pressure control, the reservoir is deemed as “leaky”. Using this definition, the Case 3 simulation WRR performance in FIG. 23 would result in both well pair patterns deemed as “leaky”. Well pair 1 has a higher WRR, and well pair 2 has a lower WRR than the 1.0 control.
Alternatively, if prior geological knowledge places WLZ, top water, or bottom water in or adjacent to the SAGD pattern volume (FIG. 1), the SAGD pattern may be designated as “leaky” or potentially “leaky”.
Another alternative is to use a cold water injectivity test to quantify SAGD well connectivity to WLZ, top water, or bottom water zones (Aherne (2006)). This may also be used to designate a SAGD pattern as “leaky” or potentially “leaky”.
Pressure control for SAGD (injecting steam volumes to attain/maintain a target pressure) in a leaky reservoir is not a good idea. FIGS. 14 and 25 show what can happen for a leaky reservoir. Well pair 1 (the low P pattern) is flooded with 1) water from the WLZ and 2) from water condensed from steam injected into the adjacent well pair 2. After about 1 year, bitumen production is very small, and SOR is very high. SAGD pressure control shuts off steam injection into well pair 1 after about 450 days. Well pair 2 (the adjacent, high-P pattern) produces bitumen, but SOR is high. Eventually, steam from well pair 2 breaks through to well pair 1 (FIG. 15), and production from well pair 1 resumes as a pseudo steam flood.
If one compares the cumulative performance for both well pairs (FIG. 19, Case 2 or Case 4, FIG. 20) to the Base Case (Case 1), one observes that SAGD pressure control, in a leaky reservoir with WLZ cross flow, has caused the following deficiencies:
-
- (1) Reduced cumulative bitumen productivity
- (2) Reduced cumulative bitumen recovery
- (3) Increased SOR (decreased efficiency)
- (4) Increased water production (water from the WLZ)
On the other hand, if one controls pressure in each well pair so there is little or no cross flow, one would improve and preferably optimize performance for each well pair and for the cumulative of both well pairs (Case 1). But, in practice, using SAGD pressure control may pose to be difficult. Water influx/egress may occur with small pressure gradients, and it is difficult to set and measure pressure targets. Pressure has 3 problems-1) where to measure pressure; 2) the accuracy of pressure measurement; and 3) choosing the right pressure target. Even for a homogeneous reservoir, one can expect vertical and lateral pressure differences as high as 300 kPa (the assumed pressure difference for the simulation case study). For an active water incursion, pressure control can be lost entirely. No change in steam injection rate can significantly affect pattern pressures.
An alternative control mechanism is to control steam injection rates, independent of reservoir pressure.
FIGS. 16 and 18 show that setting steam injection rates at fixed volumes, even after 1 year of pressure control, can restore bitumen productivity and improve other performance factors. But, a somewhat arbitrary and equal setting of volume rate targets may work partially because both well-pair patterns are homogeneous and identical expect for the WLZ connecting the patterns for the Cases studied.
A more rigorous approach, and a way to account for some pattern differences, is to use WRR measurement for each pattern as a way to set targets and to control SAGD in leaky reservoirs, as follows:
-
- (1) Continually monitor pattern WRR, preferably weekly.
- (2) After more than 200 days of continuous operation, characterize the pattern reservoir using WRR (leaky or not).
- (3) Set a target WRR (for a near-homogeneous, contained GD chamber, target WRR ≦1.0; for a leaky pattern, target WRR >1.0, to account for water production from WLZ, top water or bottom water).
- (4) If the actual pattern WRR is less than the target, decrease the steam injection rate until the target is achieved.
- (5) If the actual pattern WRR is greater than the target, increase the steam injection rate until the target is achieved.
- (6) An overriding consideration is that measured pressures should not exceed a fraction of reservoir parting pressure (fracture pressure in a consolidated reservoir). A fraction of 0.8 is a good safety margin.
Some preferred embodiments of the present invention further comprise
-
- (1) Early designation, leaky reservoirs (geology or water injection test)
- (2) Bitumen reservoirs (<10 API, >100,000 cp)
- (3) On-the-fly leaky reservoir determination, based on WRR performance
- (4) Volume control for steam injection, preferred WRR control
- (5) Conventional SAGD process
- (6) Athabasca bitumen
- Other embodiments of the invention will be apparent to a person of ordinary skill in the art and may be employed by a person of ordinary skill in the art without departing from the spirit of the invention.
Tables
| TABLE 1 |
| WLZ Simulation Model Cases |
| Case 1 (Base Case) |
| 6m thick water lean zone with 2m shale cap |
| SAGD sub-cool production control |
| Injector P control (2000 kPa) |
| Both well pairs at 2000 kPa |
| Identical reservoirs, homogeneous except for shale or WLZ |
| Case 2 - (Same as Case 1, except) |
| Pair 2 at 2200 kPa (high pressure) |
| Pair 1 at 1900 kPa (low pressure) |
| Case 2(a) - (Same as Case 2, except) |
| extend run length to 3 years |
| Case 3 - (Same as Case 2, except) |
| After 1 year remove P control and inject fixed and equal steam volumes |
| to each well pair |
| Case 4 - (Same as 2 except) |
| 3m thick lean zone |
| Case 5 - (Same as 3 except) |
| 3m thick lean zone |
| TABLE 2 |
| Lean Zone Thermal Conductivities |
| [W/m° C.] | |
| Lean Zone | 2.88 | |
| Pay Zone | 1.09 | |
| TABLE 3 |
| Lean Zone Heat Capacities |
| Heat Capacity | Pay Zone | Lean Zone | % Increase | |
| (kJ/kg) | 1.004 | 1.254 | 24.9 | |
| (kJ/m3) | 2071.7 | 2584.7 | 24.8 | |
Claims
1. The use of water recycle ratio for controlling at least one SAGD parameter in a leaky bitumen reservoir.
2. A process to control a steam injection rate for an individual Steam Assisted Gravity Drainage (SAGD) well pair, in a leaky bitumen reservoir, wherein said process comprises replacing a pressure control for an SAGD steam injection rate with a volume control determined by a Water Recycle Ratio (WRR).
3. The use of claim 1 wherein said at least one parameter is selected from volume rate, pressure, temperature, and combinations.
4. The process of claim 2, where the leaky bitumen reservoir is determined to be leaky by at least one of geological knowledge of an interspersed Water Lean Zone (WLZ), top water or bottom water.
5. The process of claim 2, where the leaky bitumen reservoir is determined leaky by a cold water injection test prior to SAGD initiation.
6. The process of claim 2, where the leaky bitumen reservoir is deemed leaky when after 200 days or more of SAGD operation using pressure control for steam injection, the SAGD has a WRR that varies from 1.0 by more than 10 percent.
7. The process of claim 2, where a sub-cool control is maintained for liquids production.
8. The process of claim 2, where volume rate control is instituted by injecting a pre-set target volume rate of steam into the SAGD injector well.
9. A process for controlling a steam injection volume rate in a Steam Assisted Gravity Drainage (SAGD) process in an impaired reservoir, wherein the steam injection volume rate is controlled by
i. Continually measuring a Water Recycle Ratio (WRR) for an SAGD well pair;
ii. Establishing a target for WRR; and
iii. If the actual WRR is less than the target WRR, reducing the steam injection rate until the target is achieved;
iv. If the actual WRR is greater than the target WRR, increasing the steam injection rate until the target is achieved.
10. The process of claim 9 where the target WRR is between 0.9 and 1.0.
11. The process of claim 9, where the target WRR is between 1.0 and 1.5.
12. The process of claim 2, wherein the leaky bitumen reservoir is leaky due to an interspersed water lean zone (WLZ) within a net pay zone in said reservoir.
13. The process of claim 2, where the leaky bitumen reservoir is leaky due to a top water zone.
14. The process of claim 2, where the leaky bitumen reservoir is leaky due to a bottom water zone
15. The process of claim 2, wherein the leaky bitumen reservoir is leaky due to multiple factors comprising WLZ, top water and bottom water.
16. The process of claim 2, wherein the bitumen is a hydrocarbon with <10 API density and >100,000 cp viscosity, at native reservoir conditions.
17. The process of claim 8, wherein the measured SAGD pressure in the reservoir does not exceed:
i) the reservoir parting pressure, for unconsolidated reservoirs;
ii) the reservoir fracturing pressure, for consolidated reservoirs.
18. The process of claim 17, where the measured SAGD pressure does not exceed about 80 percent of the parting pressure or the fracturing pressure.
19. The process of claim 16, where the bitumen reservoir is located in the Athabasca region of Alberta, Canada.
20. The process of claim 2, where the minimum operating pressure is equal to the native reservoir pressure.
Images & Drawings included:


Sources:
- United States Patent and Trademark Office - verify current appl. status at the USPTO↗
Recent applications in this class:
- » 20250154856 2025-05-15
BACK ALLOCATION METHOD - » 20250137362 2025-05-01
MULTIPLE-CONDUIT PRODUCTION STRING COMPLETION - » 20250116174 2025-04-10
STABILITY EVALUATION APPROACH FOR PRODUCTION METERING OPTIMIZATION - » 20250109669 2025-04-03
WELL RELATED INJECTION PRESSURE REGULATION METHODS AND SYSTEMS - » 20250092766 2025-03-20
HYDROCARBON WELL PRODUCTION OPTIMIZATION WITH FLUID COMPOSITION PREDICTION - » 20250092765 2025-03-20
FLOW CONTROL DEVICES FOR BRINE PRODUCTION FROM WELLBORE - » 20250075599 2025-03-06
FLUID FLOW CONTROL SYSTEM EMPLOYING A FLOW RESTRICTOR FOR CONTROL PRESSURE - » 20250075598 2025-03-06
FLUID FLOW CONTROL SYSTEM EMPLOYING A FLUIDIC DIODE FOR CONTROL PRESSURE - » 20250075597 2025-03-06
Sustained casing pressure management system and method of use - » 20250067154 2025-02-27
Methods to regulate downhole fluid flow through a plurality of valves and downhole fluid flow regulation systems
Recent applications for this Assignee:
- » 20140000888 2014-01-02
UPLIFTED SINGLE WELL STEAM ASSISTED GRAVITY DRAINAGE SYSTEM AND PROCESS - » 20130327525 2013-12-12
THERMAL PULSING PROCEDURE FOR REMEDIATION OF COLD SPOTS IN STEAM ASSISTED GRAVITY DRAINAGE - » 20130284461 2013-10-31
Steam anti-coning/cresting technology ( SACT) remediation process - » 20130284435 2013-10-31
SATELLITE STEAM-ASSISTED GRAVITY DRAINAGE WITH OXYGEN (SAGDOX) SYSTEM FOR REMOTE RECOVERY OF HYDROCARBONS - » 20130248177 2013-09-26
SAGDOX geometry for impaired bitumen reservoirs - » 20130175031 2013-07-11
Sagdox geometry - » 20130098607 2013-04-25
Steam Flooding with Oxygen Injection, and Cyclic Steam Stimulation with Oxygen Injection - » 20130098603 2013-04-25
Steam assisted gravity drainage processes with the addition of oxygen - » 20130015100 2013-01-17
Systems and methods for catalytic steam cracking of non-asphaltene containing heavy hydrocarbons - » 20120213694 2012-08-23
HS conversion to sulfur using a regenerated iodine solution