METHODS FOR IDENTIFYING DRUG TARGETS BASED ON GENOMIC SEQUENCE DATA
US20150112652A1
2015-04-23
14/106,377
2013-12-13
Abstract:
This invention provides a computational approach to identifying potential antibacterial drug targets based on a genome sequence and its annotation. Starting from a fully sequenced genome, open reading frame assignments are made which determine the metabolic genotype for the organism. The metabolic genotype, and more specifically its stoichiometric matrix, are analyzed using flux balance analysis to assess the effects of genetic deletions on the fitness of the organism and its ability to produce essential biomolecules required for growth.
Assignee:
- The Regents of the University of California 11,450 🇺🇸 Oakland, CA, United States
Interested in similar patents?
Get notified when new applications in this technology area are published.
Classification:
Description
RELATED APPLICATIONS
This application in a continuation of application Ser. No. 09/243/022, filed Feb. 2, 1999.
BACKGROUND OF THE INVENTION
1. Field of the Invention
This invention relates to methods for identifying drug targets based on genomic sequence data. More specifically, this invention relates to systems and methods for determining suitable molecular targets for the directed development of antimicrobial agents.
2. Description of the Related Art
Infectious disease is on a rapid rise and threatens to regain its status as a major health problem. Prior to the discovery of antibiotics in the 1930s, infectious disease was a major cause of death. Further discoveries, development, and mass production of antibiotics throughout the 1940s and 1950s dramatically reduced deaths from microbial infections to a level where they effectively no longer represented a major threat in developed countries.
Over the years antibiotics have been liberally prescribed and the strong selection pressure that this represents has led to the emergence of antibiotic resistant strains of many serious human pathogens. In some cases selected antibiotics, such as vancomycin, literally represent the last line of defense against certain pathogenic bacteria such as Staphylococcus. The possibility for staphylococci to acquire vancomycin resistance through exchange of genetic material with enterococci, which are commonly resistant to vanconycin, is a serious issue of concern to health care specialists. The pharmaceutical industry continues its search for new antimicrobial compounds, which is a lengthy and tedious, but very important process. The rate of development and introduction of new antibiotics appears to no longer be able to keep up with the evolution of new antibiotic resistant organisms. The rapid emergence of antibiotic resistant ogranisms threatens to lead to a serious widespread health care concern.
The basis of antimicrobial chemotherapy is to selectively kill the microbe with minimal, and ideally no, harm to normal human cells and tissues. Therefore, ideal targets for antibacterial action are biochemical processes that are unique to bacteria, or those that are sufficiently different from the corresponding mammalian process to allow acceptable discrimination between the two. For effective antibiotic action it is clear that a vital target must exist in the bacterial cell and that the antibiotic be delivered to the target in an active form. Therefore resistance to an antibiotic can arise from: (i) chemical destruction or inactivation of the antibiotic; (ii) alteration of the target site to reduce or eliminate effective antibiotic binding; (iii) blocking antibiotic entry into the cell, or rapid removal from the cell after entry; and (iv) replacing the metabolic step inhibited by the antibiotic.
Thus, it is time to fundamentally re-examine the philosophy of microbial killing strategies and develop new paradigms. One such paradigm is a holistic view of cellular metabolism. The identification of “sensitive” metabolic steps in attaining the necessary metabolic flux distributions to support growth and survival that can be attacked to weaken or destroy a microbe, need not be localized to a single biochemical reaction or cellular process. Rather, different cellular targets that need not be intimately related in the metabolic topology could be chosen based on the concerted effect the loss of each of these functions would have on metabolism.
A similar strategy with viral infections has recently proved successful. It has been shown that “cocktails” of different drugs that target different biochemical processes provide enhanced success in fighting against HIV infection. Such a paradigm shift is possible only if the necessary biological information as well as appropriate methods of rational analysis are available. Recent advances in the field of genomics and bioinformatics, in addition to mathematical modeling, offer the possibility to realize this approach.
At present, the field of microbial genetics is entering a new era where the genomes of several microorganisms are being completely sequenced. It is expected that in a decade, or so, the nucleotide sequences of the genomes of all the major human pathogens will be completely determined. The sequencing of the genomes of pathogens such as Haemophilus influenzae has allowed researchers to compare the homology of proteins encoded by the open reading frames (ORFs) with those of Escherichia coli, resulting in valuable insight into the H. influenzae metabolic features. Similar analyses, such as those performed with H. influenzae, will provide details of metabolism spanning the hierarchy of metabolic regulation from bacterial genomes to phenotypes.
These developments provide exciting new opportunities to carry out conceptual experiments in silico to analyze different aspects of microbial metabolism and its regulation. Further, the synthesis of whole-cell models is made possible. Such models can account for each and every single metabolic reaction and thus enable the analysis of their role in overall cell function. To implement such analysis, however, a mathematical modeling and simulation framework is needed which can incorporate the extensive metabolic detail but still retain computational tractability. Fortunately, rigorous and tractable mathematical methods have been developed for the required systems analysis of metabolism.
A mathematical approach that is well suited to account for genomic detail and avoid reliance on kinetic complexity has been developed based on well-known stoichiometry of metabolic reactions. This approach is based on metabolic flux balancing in a metabolic steady state. The history of flux balance models for metabolic analyses is relatively short. It has been applied to metabolic networks, and the study of adipocyte metabolism. Acetate secretion from E. coli under ATP maximization conditions and ethanol secretion by yeast have also been investigated using this approach.
The complete sequencing of a bacterial genome and ORF assignment provides the information needed to determine the relevant metabolic reactions that constitute metabolism in a particular organism. Thus a flux-balance model can be formulated and several metabolic analyses can be performed to extract metabolic characteristics for a particular organism. The flux balance approach can be easily applied to systematically simulate the effect of single, as well as multiple, gene deletions. This analysis will provide a list of sensitive enzymes that could be potential antimicrobial targets.
The need to consider a new paradigm for dealing with the emerging problem of antibiotic resistant pathogens is a problem of vital importance. The route towards the design of new antimicrobial agents must proceed along directions that are different from those of the past. The rapid growth in bioinformatics has provided a wealth of biochemical and genetic information that can be used to synthesize complete representations of cellular metabolism. These models can be analyzed with relative computational ease through flux-balance models and visual computing techniques. the ability to analyze the global metabolic network and understand the robustness and sensitivity of its regulation under various growth conditions offers promise in developing novel methods of antimicrobial chemotherapy.
In one example, Pramanik et al. described a stoichiometric model of E. coli metabolism using flux-balance modeling techniques (Stoichiometric Model of Escherichia coli Metabolism: Incorporation of Growth-Rate Dependent Biomass Composition and Mechanistic Energy Requirement, Biotechnology and Bioengineering, Vol. 56, No. 4, Nov. 20, 1997), However, the analytical methods described by Pramanik, et al. can only be used for situations in which biochemical knowledge exists for the reactions occurring within an organism. Pramanik, et al. produced a metabolic model of metabolism for E. coli based on biochemical information rather than genomic data since the metabolic genes and related reaction for E. coli had already been well studied and characterized. Thus, this method is inapplicable to determining a metabolic model for organisms for which little or no biochemical information on metabolic enzymes and genes is known. It can be envisioned that in the future the only information we may have regarding an emerging pathogen is its genomic sequence. What is needed in the art is a system and method for determining and analyzing the entire metabolic network of ogranisms whose metabolic reactions have not yet been determined from biochemical assays. The present invention provides such a system.
SUMMARY OF THE INVENTION
This invention relates to constructing metabolic genotypes and genome specific stoichiometric matrices from genome annotation data. The functions of the metabolic genes in the target organism are determined by homology searches against data bases of genes from similar organisms. Once a potential function is assigned to each metabolic gene of the target organism, the resulting data is analyzed. In one embodiment, each gene is subjected to a flux-balance analysis to assess the effects of genetic deletions on the ability of the target organism to produce essential biomolecules necessary for its growth. Thus, the invention provides a high-throughput computational method to screen for genetic deletions which adversely affect the growth capabilities of fully sequenced organisms.
Embodiments of this invention also provide a computational, as opposed to an experimental, method for the rapid screening of genes and their gene products as potential drug targets to inhibit an organism's growth. This invention utilizes the genome sequence, the annotation data, and the biomass requirements of an organism to construct genomically complete metabolic genotypes and genome-specific stoichiometric matrices. These stoichiometric matrices are analyzed using a flux-balance analysis. This invention describes how to assess the affects of genetic deletions on the fitness and productive capabilities of an organism under given environmental and genetic conditions.
Construction of a genome-specific stoichiometric matrix from genomic annotation data is illustrated along with applying flux-balance analysis to study the properties of the stoichiometric matrix, and hence the metabolic genotype of the organism. By limiting the constraints on various fluxes and altering the environmental inputs to the metabolic network, genetic deletions may be analyzed for their affects on growth. This invention is embodied in a software application that can be used to create the stoichiometric matrix for a fully sequenced and annotated genome. Additionally, the software application can be used to further analyze and manipulate the network so as to predict the ability of an organism to produce biomolecules necessary for growth, thus essentially simulating a genetic deletion.
BRIEF DESCRIPTION OF THE DRAWINGS
FIG. 1 is a flow diagram illustrating one procedure for creating metabolic genotypes from genomic sequence data for any organism.
FIG. 2 is a flow diagram illustrating one procedure for producing in silico microbial strains from the metabolic genotypes created by the method of FIG. 1, along with additional biochemical and microbiological data.
FIG. 3 is a graph illustrating a predicition of genome scale shifts in transcription. The graph shows the different phases of the metabolic response to varying oxygen availability, starting from completely aerobic to completely anaerobic in E. coli. The predicted changes in expression pattern between phases II and V are indicated.
DETAILED DESCRIPTION OF THE INVENTION
This invention relates to systems and methods for utilizing genome annotation data to construct a stoichiometric matrix representing most of all of the metabolic reactions that occur within an organism. Using these systems and methods, the properties of this matrix can be studied under conditions simulating genetic deletions in order to predict the affect of a particular gene on the fitness of the organism. Moreover, genes that are vital to the growth of an organism can be found by selectively removing various genes from the stoichiometric matrix and thereafter analyzing whether an organism with this genetic makeup could survive. Analysis of these lethal genetic mutations is useful for identifying potential genetic targets for anti-microbial drugs.
It should be noted that the systems and methods described herein can be implemented on any conventional host computer system, such as those based on Intel® microprocessors and running Microsoft Windows operating systems. Other systems, such as those using the UNIX or LINUX operating system and based on IBM®, DEC® or Motorola® microprocessors are also contemplated. The systems and methods described herein can also be implemented to run on client-server systems and wide-area networks, such as the Internet.
Software to implement the system can be written in any well-known computer language, such as Java, C, C++, Visual Basic, FORTRAN or COBOL and compiled using any well-known compatible compiler.
The software of the invention normally runs from instructions stored in a memory on the host computer system. Such a memory can be a hard disk, Random Access Memory, Read Only Memory and Flash Memory. Other types of memories are also contemplated to function within the scope of the invention.
A process 10 for producing metabolic genotypes from an organism is shown in FIG. 1. Beginning at a start state 12, the process 10 then moves to a state 14 to obtain the genomic DNA sequence of an organism. The nucleotide sequence of the genomic DNA can be rapidly determined for an organism with a genome size on the order of a few million base pairs. One method for obtaining the nucleotide sequences in a genome is through commercial gene databases. Many gene sequences are available on-line through a number of sites (see, for example, www.tigr.org) and can easily be downloaded from the Internet. Currently, there are 16 microbial genomes that have been fully sequenced and are publicly available, with countless others held in proprietary databases. It is expected that a number of other organisms, including pathogenic organisms will be found in nature for which little experimental information, except for its genome sequence, will be available.
Once the nucleotide sequence of the entire genomic DNA in the target organism has been obtained at state 14, the coding regions, also known as open reading frames, are determined at a state 16. Using existing computer algorithms, the location of open reading frames that encode genes from within the genome can be determined. For example, to identify the proper location, strand, and reading frame of an open reading frame one can perform a gene search by signal (promoters, ribosomal binding sites, etc.) or by content (positional base frequencies, codon preference). Computer programs for determining open reading frames are available, for example, by the University of Wisconsin Genetics Computer Group and the National Center for Biotechnology Information.
After the location of the open reading frames have been determined at state 16, the process 10 moves to state 18 to assign a function to the protein encoded by the open reading frame. The discovery that an open reading frame or gene has sequence homology to a gene coding for a protein of known function, or family of proteins of known function, can provide the first clues about the gene and it's related protein's function. After the locations of the open reading frames have been determined in the genomic DNA from the target organism, well-established algorithms (i.e. the Basic Local Alignment Search Tool (BLAST) and the FAST family of programs can be used to determine the extent of similarity between a given sequence and gene/protein sequences deposited in worldwide genetic databases. If a coding region from a gene in the target organism is homologous to a gene within one of the sequence databases, the open reading frame is assigned a function similar to the homologously matched gene. Thus, the functions of nearly the entire gene complement or genotype of an organism can be determined so long as homologous genes have already been discovered.
All of the genes involved in metabolic reactions and functions in a cell comprise only a subset of the genotype. This subset of genes is referred to as the metabolic genotype of a particular organism. Thus, the metabolic genotype of an organism includes most or all of the genes involved in the organism's metabolism. The gene products produced from the set of metabolic genes in the metabolic genotype carry out all or most of the enzymatic reactions and transport reactions known to occur within the target organism as determined from the genomic sequence.
To begin the selection of this subset of genes, one can simply search through the list of functional gene assignments from state 18 to find genes involved in cellular metabolism. This would include genes involved in central metabolism, amino acid metabolism, nucleotide metabolism, fatty acid and lipid metabolism, carbohydrate assimilation, vitamin and cofactor biosynthesis, energy and redox generation, etc. This subset is generated at a state 20. The process 10 of determining metabolic genotype of the target organism from genomic data then terminates at an end stage 22.
Referring now to FIG. 2, the process 50 of producing a computer model of an organism. This process is also known as producing in silico microbial strains. The process 50 begins at a start state 52 (same as end state 22 of process 10) and then moves to a state 54 wherein biochemical information is gathered for the reactions performed by each metabolic gene product for each of the genes in the metabolic genotype determined from process 10.
For each gene in the metabolic genotype, the substrates and products, as well as the stoichiometry of any and all reactions performed by the gene product of each gene can be determined by reference to the biochemical literature. This includes information regarding the irreversible or reversible nature of the reactions. The stoichiometry of each reaction provides the molecular ratios in which reactants are converted into products.
Potentially, there may still remain a few reactions in cellular metabolism which are known to occur from in vitro assays and experimental data. These would include well characterized reactions for which a gene or protein has yet to be identified, or was unindentified from the genome sequencing and functional assignment of state 14 and 18. This would also include the transport of metabolites into or out of the cell by uncharacterized genes related to transport. Thus one reason for the missing gene information may be due to a lack of characterization of the actual gene that performs a known biochemical conversion. Therefore upon careful review of existing biochemical literature and available experimental data, additional metabolic reactions can be added to the list of metabolic reactions determined from the metabolic genotype from state 54 at a state 56. This would include information regarding the substrates, products, reversibility/irreversibility, and stoichiometry of the reactions.
All of the information obtained at states 54 and 56 regarding reactions and their stoichiometry can be represented in a matrix format typically referred to as a stoichiometric matrix. Each column in the matrix corresponds to a given reaction or flux, and each row corresponds to the different metabolites involved in the given reaction/flux. Reversible reactions may either be represented as one reaction that operates in both the forward and reverse direction or be decomposed into one forward reaction and one backward reaction in which case all fluxes can only take on positive values. Thus, a given position in the matrix describes the stoichiometric participation of a metabolite (listed in the given row) in a particular flux of interest (listed in the given column). Together all of the columns of the genome specific stoichiometric matrix represent all of the chemical conversions and cellular transport processes that are determined to be present in the organism. This includes all internal fluxes and so called exchange fluxes operating within the metabolic network. Thus, the process 50 moves to a state 58 in order to formulate all of the cellular reactions together in a genome specific stoichiometric matrix. The resulting genome specific stoichiometric matrix is a fundamental representation of a genomically and biochemically defined genotype.
After the genome specific stoichiometric matrix is defined at state 58, the metabolic demands placed on the organism are calculated. The metabolic demands can be readily determined from the dry weight composition of the cell. In the case of well-studied organisms such as Escherichia coli and Bacillus subtilis, the dry weight composition is available in the published literature. However, in some cases it will be necessary to experimentally determine the dry weight composition of the cell for the organism in question. This can be accomplished with vary degrees of accuracy. The first attempt would measure the RNA, DNA, protein, and lipid fractions of the cell. A more detailed analysis would also provide the specific fraction of nucleotides, amino acids, etc. The process 50 moves to state 60 for the determination of the biomass composition of the target organism.
The process 50 then moves to state 62 to perform several experiments that determine the uptake rates and maintenance requirements for the organism. Microbiological experiments can be carried out to determine the uptake rates for many of the metabolites that are transported into the cell. the uptake rate is determined by measuring the depletion of the substrate from the growth media. The measurement of the biomass at each point is also required, in order to determine the uptake rate per unit biomass. The maintenance requirements can be determined from a chemostat experiment. The glucose uptake rate is plotted versus the growth rate, and the y-intercept is interpreted as the non-growth associated maintenance requirements. The growth associated maintenance requirements are determined by fitting the model results to the experimentally determined points in the growth rate versus glucose uptake rate plot.
Next, the process 50 moves to a state 64 wherein information regarding the metabolic demands and uptake rates obtained at state 62 are combined with the genome specific stoichiometric matrix of step 8 together fully define the metabolic system using flux balance analysis (FBA). This is an approach well suited to account for genomic detail as it has been developed based on the well-known stoichiometry of metabolic reactions. The time constants characterizing metabolic transients and/or metabolic reactions are typically very rapid, on the order of milli-seconds to seconds, compared to the time constants of cell growth on the order of hours to days. Thus, the transient mass balances can be simplified to only consider the steady state behavior. Eliminating the time derivatives obtained from dynamic mass balances around every metabolite in the metabolic system, yields the system of linear equations represented in matrix notation,
S*v=0 Equation 1
where S refers to the stoichiometric matrix of the system, and v is the flux vector. This equation simply states that over long times, the formation fluxes of a metabolite must be balanced by the degradation fluxes. Otherwise, significant amounts of the metabolite will accumulate inside the metabolic network. Applying equation 1 to out system we let S now represent the genome specific stoichiometric matrix.
To determine the metabolic capabilities of a defined metabolic genotype Equation 1 is solved for the metabolic fluxes and the internal metabolic reactions, v, which imposing constraints on the activity of these fluxes. Typically the number of metabolic fluxes is greater than the number of mass balances (i.e., m>n) resulting in a plurality of feasible flux distributions that satisfy Equation 1 and any constraints placed on the fluxes of the system. This range of solutions is indicative of the flexibility in the flux distributions that can be achieved with a given set of metabolic reactions. The solutions to Equation 1 lie in a restricted region. This subspace defines the capabilities of the metabolic genotype of a given organism, since the allowable solutions that satisfy Equation 1 and any constraints placed on the fluxes of the system define all the metabolic flux distributions that can be achieved with a particular set of metabolic genes.
The particular utilization of the metabolic genotype can be defined as the metabolic phenotype that is expressed under those particular conditions. Objectives for metabolic function can be chosen to explore the ‘best’ use of the metabolic network within a given metabolic genotype. The solution to equation 1 can be formulated as a linear programming problem, in which the flux distribution that minimizes a particular objective if found. Mathematically, this optimization can be stated as;
Minimize Z Equation 2
where Z=Σci.vi=c*v Equation 3
where Z is the objective which is represented as a linear combination of metabolic fluxes vi. The optimization can also be stated as the equivalent maximization problem; i.e. by changing the sign on Z.
This general representation of Z enables the formulation of a number of diverse objectives. These objectives can be design objectives for a strain, exploitation of the metabolic capabilities of a genotype, or physiologically meaningful objective functions, such as maximum cellular growth. For this application, growth is to be defined in terms of biosynthetic requirements based on literature values of biomass composition or experimentally determined values such as those obtained from state 60. Thus, we can define biomass generation as an additional reaction flux draining intermediate metabolites in the appropriate ratios and represented as an objective function Z. In addition to draining intermediate metabolites this reaction flux can be formed to utilize energy molecules such as ATP, NADH and NADPH so as to incorporate any maintenance requirement that must be met. This new reaction flux then becomes another constraint/balance equation that the system must satisfy as the objective function. It is analagous to adding an addition column to the stoichiometric matrix of Equation 1 to represent such a flux to describe the production demands placed on the metabolic system. Setting this new flux as the objective function and asking the system to maximize the value of this flux for a given set of constraints on all the other fluxes is then a method to simulate the growth of the organism.
Using linear programming, additional constraints can be placed on the value of any of the fluxes in the metabolic network.
βj≦vj≦αj Equation 4
These constraints could be representative of a maximum allowable flux through a given reaction, possibly resulting from a limited amount of an enzyme present in which case the value for αj would take on a finite value. These constraints could also be used to include the knowledge of the minimum flux through a certain metabolic reaction in which case the value for βj would take on a finite value. Additionally, if one chooses to leave certain reversible reactions or transport fluxes to operate in a forward and reverse manner the flux may remain unconstrained by setting βj to negative infinity and αj to positive infinity. If reactions proceed only in the forward reaction βj is set to zero while αj is set to positive infinity. As an example, to simulate the event of a genetic deletion the flux through all of the corresponding metabolic reactions related to the gene in question are reduced to zero by setting βj and αj to be zero in Equation 4. Based on the in vivo environment where the bacteria lives one can determine the metabolic resources available to the cell for biosynthesis of essentially molecules for biomass. Allowing the corresponding transport fluxes to be active provides the in silico bacteria with inputs and outputs for substrates and by-products produces by the metabolic network. Therefore as an example, if one wished to simulate the absence of a particular growth substrate one simply constrains the corresponding transport fluxes allowing the metabolite to enter the cell to be zero by allowing βj and αj to be zero in Equation 4. On the other hand if a substrate is only allowed to enter or exit the cell via transport mechanisms, the corresponding fluxes can be properly constrained to reflect this scenario.
Together the linear programming representation of the genome-specific stoichiometric matrix as in Equation 1 along with any general constraints placed on the fluxes in the system, and any of the possible objective functions completes the formulation of the in silico bacterial strain. The in silico strain can then be used to study theoretical metabolic capabilities by simulating any number of conditions and generating flux distributions through the use of linear programming. The process 50 of formulating the in silico strain and simulating its behavior using linear programming techniques terminates at an end state 66.
Thus, by adding or removing constraints on various fluxes in the network it is possible to (1) simulate a genetic deletion event and (2) simulate or accurately provide the network with the metabolic resources present in its in vivo environment. Using flux balance analysis it is possible to determine the affects of the removal or addition of particular genes and their associated reactions to the composition of the metabolic genotype on the range of possible metabolic phenotypes. If the removal/deletion does not allow the metabolic network to produce necessary precursors for growth, and the cell can not obtain these precursors from its environment, the deletion(s) has the potential as an antimicrobial drug target. Thus by adjusting the constraints and defining the objective function we can explore the capabilities of the metabolic genotype using linear programming to optimize the flux distribution through the metabolic network. This creates what we will refer to as an in silico bacterial strain capable of being studied and manipulated to analyze, interpret, and predict the genotype-phenotype relationship. It can be applied to assess the affects of incremental changes in the genotype or changing environmental conditions, and provide a tool for computer aided experimental design. It should be realized that other types of organisms can similarly be represented in silico and still be within the scope of the invention.
The construction of a genome specific stoichiometric matrix and in silico microbial strains can also be applied to the area of signal transduction. The components of signaling networks can be identified within a genome and used to construct a content matrix that can be further analyzed using various techniques to be determined in the future.
A. Example 1: E. coli Metabolic Genotype and in silico Model
Using the methods disclosed in FIGS. 1 and 2, an in silico strain of Escherichia coli K-12 has been constructed and represents the first such strain of a bacteria largely generated from annotated sequence data and from biochemical information. The genetic sequence and open reading frame identifications and assignments are readily available from a number of on-line locations (ex: www.tigr.org). For this example we obtained the annotated sequence from the following website for the E. coli Genome Project at the University of Wisconsin (http//www.genetics.wisc.edu). Details regarding the actual sequencing and annotation of the sequence can be found at that site. From the genome annotation data the subject of genes involved in cellular metabolism was determined as described above in FIG. 1, state 20, comprising the metabolic genotype of the particular strain of E. coli.
Through detailed analysis of the published biochemical literature on E. coli we determined (1) all of the reactions associated with the genes in the metabolic genotype and (2) any additional reactions known to occur from biochemical data which were not represented by the genes in the metabolic genotype. This provided all of the necessary information to construct the genome specific stoichiometric matrix for E. coli K-12.
Briefly, the E. coli K-12 bacterial metabolic genotype and more specifically the genome specific stoichiometric matrix contains 731 metabolic processes that influence 436 metabolites (dimensions of the genome specific stoichiometric matrix are 436×731). There are 80 reactions present in the genome specific stoichiometric matrix that do not have a genetic assignment in the annotated genome, but are known to be present from biochemical data. The genes contained within this metabolic genotype are shown in Table 1 along with the corresponding reactions they carry out.
Because E. coli is arguably the best studied organism, it was possible to determine the uptake rates and maintenance requirements (state 62 of FIG. 2) by reference to the published literature. This in silico strain accounts for the metabolic capabilities of E. coli. It includes membrane transport processes, the central catabolic pathways, utilization of alternative carbon sources and the biosynthetic pathways that generate all the components of the biomass. In the case of E. coli K-12, we can call upon the wealth of data on overall metabolic behavior and detailed biochemical information about the in vivo genotype to which we can compare the behavior of the in silico strain. One utility of FBA is the ability to learn about the physiology of the particular organism and explore its metabolic capabilities without any specific biochemical data. This ability is important considering possible future scenarios in which the only data that we may have for a newly discovered bacterium (perhaps pathogenic) could be its genome sequence.
B. Example 2: in silico Deletion Analysis for E. coli to Find Antimicrobial Targets
Using the in silico strain constructed in Example 1, the effect of individual deletions of all the enzymes in central metabolism can be examined in silico. For the analysis to determine sensitive linkages in the metabolic network of E. coli, the objective function utilized is the maximization of the biomass yield. This is defined as a flux draining the necessary biosynthetic precursors in the appropriate ratios. This flux is defined as the biomass composition, which can be determined from the literature. See Neidhardt et. al., Escherichia coli and Salmonella: Cellular and Molecular Biology, Second Edition, ASM Press, Washington, D.C., 1996. Thus, the objective function is the maximization of a single flux, this biosynthetic flux.
Constraints are placed on the network to account for the availability of substrates for the growth of E. coli. In the initial deletion analysis, growth was simulated in an aerobic glucose minimal media culture. Therefore, the constraints are set to allow for the components included in the media to be taken up. The specific uptake rate can be included if the value is known, otherwise, an unlimited supply can be provided. The uptake rate of glucose and oxygen have been determined for E. coli (Neidhardt et. al., Escherichia coli and Salmonella: Cellular and Molecular Biology, Second Edition, ASM Press, Washington, D.C., 1996. Therefore, these values are included in the analysis. The uptake rate for phosphate, sulfur, and nitrogen source is not precisely known, so constraints on the fluxes for the uptake of these important substrates is not included, and the metabolic network is allowed to take up any required amount of these substrates.
The results showed that a high degree of redundancy exists in central intermediary metabolism during growth in glucose minimal media, which is related to the interconnectivity of the metabolic reactions. Only a few metabolic functions were found to be essential such that their loss removes the capability of cellular growth on glucose. For growth on glucose, the essential gene products are involved in the 3-carbon state of glycolysis, three reactions of the TCA cycle, and several points within the PPP. Deletions in the 6-carbon stage of glycolysis result in a reduced ability to support growth due to the diversion of additional flux through the PPP.
The results from the gene deletion study can be directly compared with growth data from mutants. The growth characteristics of a series of E. coli mutants on several different carbon sources were examined (80 cases were determined from the literature), and compared to the in silico deletion results (Table 2). The majority (73 of 80 cases or 91%) of the mutant experimental observations are consistent with the predictions of the in silico study. The results from the in silico gene deletion analysis are thus consistent with experimental observations.
C. Example 3: Prediction of Genome Scale Shifts in Gene Expression
Flux based analysis can be used to predict metabolic phenotypes under different growth conditions, such as substrate and oxygen availability. The relation between the flux value and the gene expression levels is non-linear, resulting in bifurcations and multiple steady states. However, FBA can give qualitative (on/off) information as well as the relative importance of gene products under a given condition. Based on the magnitude of the metabolic fluxes, qualitative assessment of gene expression can be inferred.
FIG. 3a shows the five phases of distinct metabolic behavior of E. coli in response to varying oxygen availability, going from completely anaerobic (phase I) to completely aerobic (phase V). FIGS. 3b and 3c display lists of the genes that are predicted to be induced or repressed upon the shift from aerobic growth (phase V) to nearly complete anaerobic growth (phase II). The numerical values shown in FIGS. 3b and 3c are the fold change in the magnitude of the fluxes calculated for each of the listed enzymes.
For this example, the objective of maximization of biomass yield is utilized (as described above). The constraints on the system are also set accordingly (as described above). However, in this example, a change in the availability of a key substrate is leading to changes in the metabolic behavior. The change in the parameter is reflected as a change in the uptake flux. Therefore, the maximal allowable oxygen uptake rate is changed to generate this data. The figure demonstrates how several fluxes in the metabolic network will change as the oxygen uptake flux is continuously decreased. Therefore, the constraints on the fluxes is identical to what is described in the previous section, however, the oxygen uptake rate is set to coincide with the point in the diagram.
Corresponding experimental data sets are now becoming available. Using high-density oligonucleotide arrays the expression levels of nearly every gene in Saccharomyces cerevisiae can now be analyzed under various growth conditions. From these studies it was shown that nearly 90% of all yeast mRNA are present in growth on rich and minimal media, while a large number of mRNAs were shown to be differentially expressed under these two conditions. Another recent article shows how the metabolic and genetic control of gene expression can be studied on a genomic scale using DNA microarray technology (Exploring the Metabolic and Genetic Control of Gene Expression o a Genomic Scale, Science, Vol. 278, Oct. 24, 1997. The temporal changes in genetic expression profiles that occur during the diauxic shift in S. cerevisiae were observed for every known expressed sequence tag (EST) in this genome. As shown above, FBA can be used to qualitatively simulate shifts in metabolic genotype expression patterns due to alterations in growth environments. Thus, FBA can serve to complement current studies in metabolic gene expression, by providing a fundamental approach to analyze, interpret, and predict the data from such experiments.
D. Example 4: Design of Defined Media
An important economic consideration in large-scale bioprocesses is optimal medium formulation. FBA can be used to design such media. Following the approach defined above, a flux-balance model for the first completely sequenced free living organism, Haemophilus influenzae, has been generated. One application of this model is to predict a minimal defined media. It was found that H. influenzae can grow on the minimal defined medium as determined from the ORF assignments and predicted using FBA. Simulated bacterial growth was predicted using the following defined media: fructose, arginine, cysteine, glutamate, putrescine, spermidine, thiamin, NAD, tetrapyrrole, pantothenate, ammonia, phosphate. This predicted minimal medium was compared to the previously published defined media and was found to differ in only one compound, inosine. It is known that inosine is not required for growth, however it does serve to enhance growth. Again the in silico results obtained were consistent with published in vivo research. These results provide confidence in the use of this type of approach for the design of defined media for organisms in which there currently does not exist a defined media.
While particular embodiments of the invention have been described in detail, it will be apparent to those skilled in the art that these embodiments are exemplary rather than limiting, and the true scope of the invention is defined by the claims that follow.
| TABLE 1 |
| The genes included in the E. coli metabolic genotype along with corresponding enzymes and reactions that comprise the |
| genome specific stoichiometric matrix. The final column indicates the presence/absence of the gene (as the number of copies) in |
| the E. coli genome. Thus the presence of a gene in the E. coli genome indicates that the gene is part of the metabolic |
| genotype. Reactions/Genes not present in the genome are those gathered at state 56 in FIG. 2 and together with the reactions |
| of the genes in the metabolic genotype form the columns of the genome specific stoichiometric matrix. |
| E. coli | |||
| Enzyme | Gene | Reaction | Genome |
| Glucokinase | glk | GLC + ATP −> G6P + ADP | 1 |
| Glucokinase | glk | bDGLC + ATP −> bDG6P + ADP | 1 |
| Phosphoglucose isomerase | pgi | G6P <−> F6P | 1 |
| Phosphoglucose isomerase | pgi | bDG6P <−> G6P | 1 |
| Phosphoglucose isomerase | pgi | bDG6P <−> F6P | 1 |
| Aldose 1-epimerase | galM | bDGLC <−> GLC | 1 |
| Glucose-1-phophatase | agp | G1P −> GLC + PI | 1 |
| Phosphofructokinase | pfkA | F6P + ATP −> FDP + ADP | 1 |
| Phosphofructokinase B | pfkB | F6P + ATP −> FDP + ADP | 1 |
| Fructose-1,6-bisphosphatase | fbp | FDP −> F6P + PI | 1 |
| Fructose-1,6-bisphosphatate aldolase | fba | FDP <−> T3P1 + T3P2 | 2 |
| Triosphosphate Isomerase | tpiA | T3P1 <−> T3P2 | 1 |
| Methylglyoxal synthase | mgsA | T3P2 −> MTHGXL + PI | 0 |
| Glyceraldehyde-3-phosphate dehydrogenase-A complex | gapA | T3P1 + PI + NAD <−> NADH + 13PDG | 1 |
| Glyceraldehyde-3-phosphate dehydrogenase-C complex | gapC1C2 | T3P1 + PI + NAD <−> NADH + 13PDG | 2 |
| Phosphoglycerate kinase | pgk | 13PDG + ADP<−> 3PG + ATP | 1 |
| Phosphoglycerate mutase 1 | gpmA | 3PG <−> 2PG | 1 |
| Phosphoglycerate mutase 2 | gpmB | 3PG <−> 2PG | 1 |
| Enolase | eno | 2PG <−> PEP | 1 |
| Phosphoenolpyruvate synthase | ppsA | PYR + ATP −> PEP + AMP + PI | 1 |
| Pyruvate Kinase II | pykA | PEP + ADP −> PYR + ATP | 1 |
| Pyruvate Kinase I | pykF | PEP + ADP −> PYR + ATP | 1 |
| Pyruvate dehydrogenase | lpdA, aceEF | PYR + COA + NAD −> NADH + CO2 + ACCOA | 3 |
| Glucose-1-phosphate adenylytransferase | glgC | ATP + G1P −> ADPGLC + PPI | 1 |
| Glycogen synthase | glgA | ADPGLC −> ADP + GLYCOGEN | 1 |
| Glycogen phosphorylase | glgP | GLYCOGEN + PI −> G1P | 1 |
| Maltodextrin phosphorylase | malP | GLYCOGEN + Pl −> G1P | 1 |
| Glucose 6-phosphate-1-dehydrogenase | zwf | G6P + NADP <−> D6PGL + NADPH | 1 |
| 6-Phosphogluconolactonase | pgl | D6PGL −> D6PGC | 0 |
| 6-Phosphogluconate dehydrogenase (decarboxylating) | gnd | D6PGC + NADP −> NADPH + CO2 + RL5P | 1 |
| Ribose-5-phosphate isomerase A | rpiA | RL5P <−> R5P | 1 |
| Ribose-5-phosphate isomerase B | rpiB | RL5P <−> R5P | 1 |
| Ribulose phosphate 3-epimerase | rpe | RL5P <−> X5P | 1 |
| Transketolase I | tktA | R5P + X5P <−> T3P1 + S7P | 1 |
| Transketolase II | tktB | R5P + X5P <−> T3P1 + S7P | 1 |
| Transketolase I | tktA | X5P + E4P <−> F6P + T3P1 | 1 |
| Transketolase II | tktB | X5P + E4P <−> F6P + T3P1 | 1 |
| Transaldolase B | talB | T3P1 + S7P <−> E4P + F6P | 1 |
| Phosphogluconate dehydratase | edd | D6PGC −> 2KD6PG | 1 |
| 2-Keto-3-deoxy-6-phosphogluconate aldolase | eda | 2KD6PG −> T3P1 + PYR | 1 |
| Citrate synthase | gltA | ACCOA + OA −> COA + CIT | 1 |
| Aconitase A | acnA | CIT <−> ICIT | 1 |
| Aconitase B | acnB | CIT <−> ICIT | 1 |
| Isocitrate dehydrogenase | icdA | ICIT + NADP <−> CO2 + NADPH + AKG | 1 |
| 2-Ketoglutarate dehyrogenase | sucAB, lpdA | AKG + NAD + COA −> CO2 + NADH + SUCCOA | 3 |
| Succinyl-CoA synthetase | sucCD | SUCCOA + ADP + PI <−> ATP + COA + SUCC | 2 |
| Succinate dehydrogenase | sdhABCD | SUCC + FAD −> FADH + FUM | 4 |
| Fumurate reductase | frdABCD | FUM + FADH −> SUCC + FAD | 4 |
| Fumarase A | fumA | FUM <−> MAL | 1 |
| Fumarase B | fumB | FUM <−> MAL | 1 |
| Fumarase C | fumC | FUM <−> MAL | 1 |
| Malate dehydrogenase | mdh | MAL + NAD <−> NADH + OA | 1 |
| D-Lactate dehydrogenase 1 | dld | PYR + NADH <−> NAD + LAC | 1 |
| D-Lactate dehydrogenase 2 | ldhA | PYR + NADH <−> NAD + LAC | 1 |
| Acetaldehyde dehydrogenase | adhE | ACCOA + 2 NADH <−> ETH + 2 NAD + COA | 1 |
| Pyruvate formate lyase 1 | pflAB | PYR + COA −> ACCOA + FOR | 2 |
| Pyruvate formate lyase 2 | pflCD | PYR + COA −> ACCOA + FOR | 2 |
| Formate hydrogen lyase | fdhF, hycBEFG | FOR −> CO2 | 5 |
| Phosphotransacetylase | pta | ACCOA + PI <−> ACTP + COA | 1 |
| Acetate kinase A | ackA | ACTP + ADP <−> ATP + AC | 1 |
| GAR transformylase T | purT | ACTP + ADP <−> ATP + AC | 1 |
| Acetyl-CoA synthetase | acs | ATP + AC + COA −> AMP + PPI + ACCOA | 1 |
| Phosphoenolpyruvate carboxykinase | pckA | OA + ATP −> PEP + CO2 + ADP | 1 |
| Phosphoenolpyruvate carboxylase | ppc | PEP + CO2 −> OA + P1 | 1 |
| Malic enzyme (NADP) | maeB | MAL + NADP −> CO2 + NADPH + PYR | 0 |
| Malic enzyme (NAD) | sfcA | MAL + NAD −> CO2 + NADH + PYR | 1 |
| Isocitrate lyase | aceA | ICIT −> GLX + SUCC | 1 |
| Malate synthase A | aceB | ACCOA + GLX −> COA + MAL | 1 |
| Malate synthase G | glcB | ACCOA + GLX −> COA + MAL | 1 |
| Inorganic pyrophosphatase | ppa | PPI −> 2 PI | 1 |
| NAPIT dehydrogenase II | ndh | NADH + Q −> NAD + QH2 | 1 |
| NADH dehydrogenase I | nuoABEFGHIJ | NADH + Q −> NAD + QH2 + 3.5 HEXT | 1 |
| Formate dehydrogenase-N | fdnGHI | FOR + Q −> QH2 + CO2 + 2 HEXT | 3 |
| Formate dehydrogenase-O | fdoIHG | FOR + Q −> QH2 + CO2 + 2 HEXT | 3 |
| Formate dehydrogenase | fdhF | FOR + Q −> QH2 + CO2 + 2 HEXT | 1 |
| Pyruvate oxidase | poxB | PYR + Q −> AC + CO2 + QH2 | 1 |
| Glycerol-3-phosphate dehydrogenase (aerobic) | glpD | GL3P + Q −> T3P2 + QH2 | 1 |
| Glycerol-3-phosphate dehydrogenase (anaerobic) | glpABC | GL3P + Q −> T3P2 + QH2 | 3 |
| Cytochrome oxidase bo3 | cyoABCD, cyc | QH2 + .5 O2 −> Q + 2.5 HEXT | 6 |
| Cytochrome oxidase bd | cydABCD, app | QH2 + .5 O2 −> Q + 2 HEXT | 6 |
| Succinate dehydrogenase complex | sdhABCD | FADH + Q <−> FAD + QH2 | 4 |
| Thioredoxin reductase | trxB | OTHIO + NADPH −> NADP + RTHIO | 1 |
| Pyridine nucleotide transhydrogenase | pntAB | NADPH + NAD −> NADP + NADH | 2 |
| Pyridine nucleotide transhydrogenase | pntAB | NADP + NADH + 2 HEXT −> NADPH + NAD | 2 |
| Hydrogenase 1 | hyaABC | 2 Q + 2 HEXT <−> 2 QH2 + H2 | 3 |
| Hydrogenase 2 | hybAC | 2 Q + 2 HEXT <−> 2 QH2 + H2 | 2 |
| Hydrogenase 3 | hycFGBE | 2 Q + 2 HEXT <−> 2 QH2 + H2 | 4 |
| F0F1-ATPase | atpABCDEFG | ATP <−> ADP + PI + 4 HEXT | 9 |
| Alpha-galactosidase (melibiase) | melA | MELI −> GLC + GLAC | 1 |
| Galactokinase | galK | GLAC + ATP −> GAL1P + ADP | 1 |
| Galactose-1-phosphate uridylyltransferase | galT | GAL1P + UDPG <−> G1P + UDPGAL | 1 |
| UDP-glucose 4-epimerase | galE | UDPGAL <−> UDPG | 1 |
| UDP-glucose-1-phosphate uridylyltransferase | galU | G1P + UTP <−> UDPG + PPI | 1 |
| Phosphoglucomutase | pgm | G1P <−> G6P | 1 |
| Periplasmic beta-glucosidase precursor | bglX | LCTS −> GLC + GLAC | 1 |
| Beta-galactosidase (LACTase) | lacZ | LCTS −> GLC + GLAC | 1 |
| trehalose-6-phosphate hydrolase | treC | TRE6P −> bDG6P + GLC | 1 |
| Beta-fructofuranosidase | SUC6P −> G6P + FRU | 0 | |
| 1-Phosphofructokinase (Fructose 1-phosphate kinase) | fruK | F1P + ATP −> FDP + ADP | 1 |
| Xylose isomerase | xylA | FRU −> GLC | 1 |
| Phosphomannomutase | cpsG | MAN6P <−> MAN1P | 1 |
| Mannose-6-phosphate isomerase | manA | MACN1P <−> F6P | 1 |
| N-Acetylglucosamine-6-phosphate deacetylase | nagA | NAGP −> GA6P + AC | 1 |
| Glucosamine-6-phosphate deaminase | nagB | GA6P −> F6P + NH3 | 1 |
| N-Acetylneuraminate lyase | nanA | SLA −> PYR + NAMAN | 1 |
| L-Fucose isomerase | fucI | FUC <−> FCL | 1 |
| L-Fuculokinase | fucK | FCL + ATP −> FCL1P + ADP | 1 |
| L-Fuculose phosphate aldolase | fucA | FCL1P <−> LACAL + T3P2 | 1 |
| Lactaldehyde reductase | fucO | LACAL + NADH <−> 12PPD + NAD | 1 |
| Aldehyde dehydrogenase A | aldA | LACAL + NAD <−> LLAC + NADH | 1 |
| Aldehyde dehydrogenase B | aldB | LACAL + NAD <−> LLAC + NADH | 1 |
| Aldehyde dehydrogenase | adhC | LACAL + NAD <−> LLAC + NADH | 1 |
| Aldehyde dehydrogenase | adhC | GLAL + NADH <−> GL + NADH | 1 |
| Aldehyde dehydrogenase | adhE | LACAL + NAD −> LLAC + NADH | 1 |
| Aldehyde dehydrogenase | aldH | LACAL + NAD <−> LLAC + NADH | 1 |
| Aldehyde dehydrogenase | aldH | ACAL + NAD −> AC + NADH | 1 |
| Gluconokinase I | gntV | GLCN + ATP −> D6PGC + ADP | 1 |
| Gluconokinase II | gntK | GLCN + ATP −> D6PGC + ADP | 1 |
| L-Rhamnose isomerase | rhaA | RMN <−> RML | 1 |
| Rhamnulokinase | rhaB | RML + ATP −> RML1P + ADP | 1 |
| Rhamnulose-1-phosphate aldolase | rhaD | RML1P <−> LACAL + T3P2 | 1 |
| L-Arabinose isomerase | araA | ARAB <−> RBL | 1 |
| Arabinose-5-phospliate isomerase | RL5P <−> A5P | 0 | |
| L-Ribulokinase | araB | RBL + ATP −> RL5P + ADP | 1 |
| L-Ribulose-phosphate 4-epimerase | araD | RL5P <−> X5P | 1 |
| Xylose isomerase | xylA | XYL <−> XUL | 1 |
| Xylulokinase | xylB | XUL + ATP −> X5P + ADP | 1 |
| Ribokinase | rbsK | RIB + ATP −> R5P + ADP | 1 |
| Mannitol-1-phosphate 5-dehydrogenase | mtlD | MNT6P + NAD <−> F6P + NADH | 1 |
| Glucitol-6-phosphate dehydrogenase | srlD | GLT6P + NAD <−> F6P + NADH | 1 |
| Galactitol-1-phosphate dehydrogenase | gatD | GLTL1P + NAD <−> TAG6P + NADH | 1 |
| Phosphofructokinase B | pfkB | TAG6P + ATP −> TAG16P + ADP | 1 |
| 1-Phosphofructokinase | fruK | TAG6P + ATP −> TAG16P + ADP | 1 |
| Tagatose-6-phosphate kinase | agaZ | TAG6P + ATP −> TAG16P + ADP | 1 |
| Tagatose-bisphosphate aldolase 2 | gatY | TAG16P <−> T3P2 + T3P1 | 1 |
| Tagatose-bisphosphate aldolase 1 | agaY | TAG16P <−> T3P2 + T3P1 | 1 |
| Glycerol kinase | glpK | GL + ATP −> GL3P + ADP | 1 |
| Glycerol-3-phosphate-dehydrogenase-[NAD(P)+] | gpsA | GL3P + NADP <−> T3P2 + NADPH | 1 |
| Phosphopentomutase | deoB | DR1P <−> DR5P | 1 |
| Phosphopentomutase | deoB | R1P <−> R5P | 1 |
| Deoxyribose-phosphate aldolase | deoC | DR5P −> ACAL + T3P1 | 1 |
| Asparate transaminase | aspC | OA + GLU <−> ASP + AKG | 1 |
| Asparagine synthetase (Glutamate dependent) | asnB | ASP + ATP + GLN −> GLU + ASN + AMP + PPI | 1 |
| Aspartate-ammonia ligase | asnA | ASP + ATP + NH3 −> ASN + AMP + PPI | 1 |
| Glutamate dehydrogenase | gdhA | AKG + NH3 + NADPH <−> GLU + NADP | 1 |
| Glutamate-ammonia ligase | glnA | GLU + NH3 + ATP −> GLN + ADP + PI | 1 |
| Glutamate synthase | gltBD | AKG + GLN + NADPH −> NADP + 2 GLU | 2 |
| Alanine transaminase | alaB | PYR + GLU <−> AKG + ALA | 0 |
| Valine-pyruvate aminotransferase | avtA | OIVAL + ALA −> PYR + VAL | 1 |
| Alanine racemase, biosynthetic | alr | ALA <−> DALA | 1 |
| Alanine racemase, catabolic | dadX | ALA −> DALA | 1 |
| N-Acetylglutamate synthase | argA | GLU + ACCOA −> COA + NAGLU | 1 |
| N-Acetylglutamate kinase | argB | NAGLU + ATP −> ADP + NAGLUYP | 1 |
| N-Acetylglutamate phosphate reductase | argC | NAGLUYP + NADPH <−> NADP + PI + NAGLUSAL | 1 |
| Acetylornithine transaminase | argD | NAGLUSAL + GLU <−> AKG + NAARON | 1 |
| Acetylornithine deacetylase | argE | NAARON −> AC + ORN | 1 |
| Carbamoyl phosphate synthetase | carAB | GLN + 2 ATP + CO2 −> GLU + CAP + 2 ADP + PI | 2 |
| Ornithine carbamoyl transferase 1 | argF | ORN + CAP <−> CITR + PI | 2 |
| Ornithine carbamoyl transferase 2 | argI | ORN + CAP <−> CITR + PI | 1 |
| Ornithine transaminase | ygjGH | ORN + AKG −> GLUGSAL + GLU | 2 |
| Argininosuccinate synthase | argG | CITR + ASP + ATP −> AMP + PPI + ARGSUCC | 1 |
| Argininosuccinate lyase | argH | ARGSUCC <−> FUM + ARG | 1 |
| Arginine decarboxylase, biosynthetic | speA | ARG −> CO2 + AGM | 1 |
| Arginine decarboxylase, degradative | adi | ARG −> CO2 + AGM | 1 |
| Agmatinase | speB | AGM −> UREA + PTRC | 1 |
| Ornithine decarboxylase, biosynthetic | speC | ORN −> PTRC + CO2 | 1 |
| Ornithine decarboxylase, degradative | speF | ORN −> PTRC + CO2 | 1 |
| Adenosylmethionine decarboxylase | speD | SAM <−> DSAM + CO2 | 1 |
| Spermidine synthase | speE | PTRC + DSAM −> SPMD + 5MTA | 1 |
| Methylthioadenosine nucleosidase | 5MTA −> AD + 5MTR | 0 | |
| 5-Methylthioribose kinase | 5MTR + ATP −> 5MTRP + ADP | 0 | |
| 5-Methylthioribose-1-phosphate isomerase | 5MTRP <−> 5MTR1P | 0 | |
| E-1 (Enolase-phosphatase) | 5MTR1P −> DKMPP | 0 | |
| E-3 (Unknown) | DKMPP −> FOR + KMB | 0 | |
| Transamination (Unknown) | KMB + GLN −> GLU + MET | 0 | |
| γ-Glutamyl kinase | proB | GLU + ATP −> ADP + GLUP | 1 |
| Glutamate-5-semialdehyde dehydrogenase | proA | GLUP + NADPH −> NADP + PI + GLUGSAL | 1 |
| N-Acetylornithine deacetylase | argE | NAGLUSAL −> GLUGSAL + AC | 1 |
| Pyrroline-5-carboxylate reductase | proC | GLUGSAL + NADPH −> PRO + NADP | 1 |
| Threonine dehydratase, biosynthetic | ilvA | THR −> NH3 + OBUT | 1 |
| Threonine dehydratase, catabolic | tdcB | THR −> NH3 + OBUT | 1 |
| Acetohydroxybutanoate synthase I | ilvBN | OBUT + PYR −> ABUT + CO2 | 2 |
| Acetohydroxybutanoate synthase II | ilvG(12)M | OBUT + PYR −> ABUT + CO2 | 3 |
| Acetohydroxybutanoate synthase III | ilvIH | OBUT + PYR −> ABUT + CO2 | 2 |
| Acetohydroxy Acid isomeroreductase | ilvC | ABUT + NADPH −> NADP + DHMVA | 1 |
| Dihydroxy acid dehydratase | ilvD | DHMVA −> OMVAL | 1 |
| Branched chain amino acid aminotransferase | ilvE | OMVAL + GLU <−> AKG + ILE | 1 |
| Acetolactate synthase I | ilvBN | 2 PYR −> CO2 + ACLAC | 2 |
| Acetolactate synthase II | ilvG(12)M | 2 PYR −> CO2 + ACLAC | 3 |
| Acetolactate synthase III | ilvIH | 2 PYR −> CO2 + ACLAC | 2 |
| Acetohydroxy acid isomeroreductase | iIvC | ACLAC + NADPH −> NADP + DHVAL | 1 |
| Dihydroxy acid dehydratase | ilvD | DHVAL −> OIVAL | 1 |
| Branched chain amino acid aminotransferase | ilvE | OIVAL + GLU −> AKG + VAL | 1 |
| Valine-pyruvate aminotransferase | avtA | OIVAL + ALA −> PYR + VAL | 1 |
| Isopropylmalate synthase | leuA | ACCOA + OLVAL −> COA + CBHCAP | 1 |
| Isopropylmalate isomerase | leuCD | CBHCAP <−> IPPMAL | 2 |
| 3-Isopropylmalate dehydrogenase | leuB | IPPMAL + NAD −> NADH + OICAP + CO2 | 1 |
| Branched chain amino acid aminotransferase | ilvE | OICAP + GLU −> AKG + LEU | 1 |
| Aromatic amino acid transaminase | tyrB | OICAP + GLU −> AKG + LEU | 1 |
| 2-Dehydro-3-deoxyphosphoheptonate aldolase F | aroF | E4P + PEP −> PI + 3DDAH7P | 1 |
| 2-Dehydro-3-deoxyphosphoheptonate aldolase G | aroG | E4P + PEP −> PI + 3DDAH7P | 1 |
| 2-Dehydro-3-deoxyphosphoheptonate aldolase H | aroH | E4P + PEP −> PI + 3DDAH7P | 1 |
| 3-Dehydroquinate synthase | aroB | 3DDAH7P −> DQT + PI | 1 |
| 3-Dehydroquinate dehydratase | aroD | DQT <−> DHSK | 1 |
| Shikimate dehydrogenase | aroE | DHSK + NADPH <−> SME + NADP | 1 |
| Shikimate kinase I | aroK | SME + ATP −> ADP + SME5P | 1 |
| Shikimate kinase II | aroL | SME + ATP −> ADP + SME5P | 1 |
| 3-Phosphoshikimate-1-carboxyvinyltransferase | aroA | SME5P + PEP <−> 3PSME + PI | 1 |
| Chorismate synthase | aroC | 3PSME −> PI + CHOR | 1 |
| Chorismate mutase 1 | pheA | CHOR −> PHEN | 1 |
| Prephenate dehydratase | pheA | PHEN −> CO2 + PHPYR | 1 |
| Aromatic amino acid transaminase | tyrB | PHPYR + GLU <−> AKG + PHE | 1 |
| Chorismate mutase 2 | tyrA | CHOR −> PHEN | 1 |
| Prephanate dehydrogenase | tyrA | PHEN + NAD −> HPHPYR + CO2 + NADH | 1 |
| Aromatic amino acid transaminase | tyrB | HPHPYR + GLU <−> AKG + TYR | 1 |
| Asparate transaminase | aspC | HPHPYR + GLU <−> AKG + TYR | 1 |
| Anthranilate synthase | trpDE | CHOR + GLN −> GLU + PYR + AN | 2 |
| Anthranilate synthase component II | trpD | AN + PRPP −> PPI + NPRAN | 1 |
| Phosphoribosyl anthranilate isomerase | trpC | NPRAN −> CPAD5P | 1 |
| Indoleglycerol phosphate synthase | trpC | CPAD5P −> CO2 + IGP | 1 |
| Tryptophan synthase | trpAB | IGP + SER −> T3P1 + TRP | 2 |
| Pliosphoribosyl pyrophosphate synthase | prsA | R5P + ATP <−> PRPP + AMP | 1 |
| ATP phosphoribosyltransferase | hisG | PRPP + ATP −> PPI + PRBATP | 1 |
| Phosphoribosyl-ATP pyrophosphatase | hisIE | PRBATP −> PPI + PRBAMP | 1 |
| Phosphoribosyl-AMP cyclohydrolase | hisIE | PRBAMP −> PRFP | 1 |
| Phosphoribosylformimino-5-amino-1-phos- | hisA | PRFP −> PRLP | 1 |
| phoribosyl-4-imidazole c | |||
| Imidazoleglycerol phosphate synthase | hisFH | PRLP + GLN −> GLU + AICAR + DIMGP | 2 |
| Imidazoleglycerol phosphate dehydratase | hisB | DIMGP −> IMACP | 1 |
| L-Histidinol phosphate aminotransferase | hisC | IMACP + GLU −> AKG + HISOLP | 1 |
| Histidinol phosphatase | hisB | HISOLP −> PI + HISOL | 1 |
| Histidinol dehydrogenase | hisD | HISOL + 3 NAD −> HIS + 3 NADH | 1 |
| 3-Phosphoglycerate dehydrogenase | serA | 3PG + NAD −> NADH + PHP | 1 |
| Phosphoserine transaminase | serC | PHP + GLU −> AKG + 3PSER | 1 |
| Phosphoserine phosphatase | serB | 3PSER −> PI + SER | 1 |
| Glycine hydroxymethyltransferase | glyA | THF + SER −> GLY + METTHF | 1 |
| Threonine dehydrogenase | tdh | THR + COA −> GLY + ACCOA | 1 |
| Amino ketobutyrate CoA ligase | kbl | THR + COA −> GLY + ACCOA | 1 |
| Sulfate adenylyltransferase | cysDN | SLF + ATP + GTP −> PPI + APS + GDP + PI | 2 |
| Adenylylsulfate kinase | cysC | APS + ATP −> ADP + PAPS | 1 |
| 3′-Phospho-adenylylsulfate reductase | cysH | PAPS + RTHIO −> OTHIO + H2SO3 + PAP | 1 |
| Sulfite reductase | cysIJ | H2SO3 + 3NADPH <−> H2S + 3 NADP | 2 |
| Serine transacetylase | cysE | SER + ACCOA <−> COA + ASER | 1 |
| O-Acetylserine (thiol)-lyase A | cysK | ASER + H2S −> AC + CYS | 1 |
| O-Acetylserine (thiol)-lyase B | cysM | ASER + H2S −> AC + CYS | 1 |
| 3′-5′ Bisphosphate nucleotidase | PAP −> AMP + PI | 0 | |
| Aspartate kinase I | thrA | ASP + ATP <−> ADP + BASP | 1 |
| Aspartate kinase II | metL | ASP + ATP <−> ADP + BASP | 1 |
| Aspartate kinase III | lysC | ASP + ATP <−> ADP + BASP | 1 |
| Aspartate semialdehyde dehydrogenase | asd | BASP + NADPH <−> NADP + PI + ASPSA | 1 |
| Homoserine dehydrogenase I | thrA | ASPSA + NADPH <−> NADP + HSER | 1 |
| Homoserine dehydrogenase II | metL | ASPSA + NADPH <−> NADP + HSER | 1 |
| Homoserine kinase | thrB | HSER + ATP −> ADP + PHSER | 1 |
| Threonine synthase | thrC | PHSER −> PI + THR | 1 |
| Dihydrodipicolinate synthase | dapA | ASPSA + PYR −> D23PIC | 1 |
| Dihydrodipicolinate reductase | dapB | D23PIC + NADPH −> NADP + PIP26DX | 1 |
| Tetrahydrodipicolinate succinylase | dapD | PIP26DX + SUCCOA −> COA + NS2A6O | 1 |
| Succinyl diaminopimelate aminotransferase | dapC | NS2A6O + GLU <−> AKG + NS26DP | 0 |
| Succinyl diaminopimelate desuccinylase | dapE | NS26DP −> SUCC + D26PIM | 1 |
| Diaminopimelate epimerase | dapF | D26PIM <−> MDAP | 1 |
| Diaminopimelate decarboxylase | lysA | MDAP −> CO2 + LYS | 1 |
| Lysine decarboxylase 1 | cadA | LYS −> CO2 + CADV | 1 |
| Lysine decarboxylase 2 | ldcC | LYS −> CO2 + CADV | 1 |
| Homoserine transsuccinylase | metA | HSER + SUCCOA −> COA + OSLHSER | 1 |
| O-succinlyhomoserine lyase | metB | OSLHSER + CYS −> SUCC + LLCT | 1 |
| Cystathionine-β-lyase | metC | LLCT −> HCYS + PYR + NH3 | 1 |
| Adenosyl homocysteinase (Unknown) | Unknown | HCYS + ADN <−> SAH | 0 |
| Cobalamin-dependent methionine synthase | metH | HCYS + MTHF −> MET + THF | 1 |
| Cobalamin-independent methionine synthase | metE | HCYS + MTHF −> MET + THF | 1 |
| 5-Adenosylmethionine synthetase | metK | MET + ATP −> PPI + PI + SAM | 1 |
| D-Amino acid dehydrogenase | dadA | DALA + FAD −> FADH + PYR + NH3 | 1 |
| Putrescine transaminase | pat | PTRC + AKG −> GABAL + GLU | 0 |
| Amino oxidase | tynA | PTRC −> GABAL + NH3 | 1 |
| Aminobutyraldehyde dehydrogenase | prr | GABAL + NAD −> GABA + NADH | 0 |
| Aldehyde dehydrogenase | aldH | GABAL + NAD −> GABA + NADH | 1 |
| Aminobutyrate aminotransaminase 1 | gabT | GABA + AKG −> SUCCSAL + GLU | 1 |
| Aminobutyrate aminotransaminase 2 | goaG | GABA + AKG −> SUCCSAL + GLU | 1 |
| Succinate semialdehyde dehydrogenase-NAD | sad | SUCCSAL + NAD −> SUCC + NADH | 0 |
| Succinate semialdehyde dehydrogenase-NADP | gabD | SUCCSAL + NADP −> SUCC + NADPH | 1 |
| Asparininase I | ansA | ASN −> ASP + NH3 | 1 |
| Asparininase II | ansB | ASN −> ASP + NH3 | 1 |
| Aspartate ammonia-lyase | aspA | ASP −> FUM + NH3 | 1 |
| Tryptophanase | tnaA | CYS −> PYR + NH3 + H2S | 1 |
| L-Cysteine desulfhydrase | CYS −> PYR + NH3 + H2S | 0 | |
| Glutamate decarboxylase A | gadA | GLU −> GABA + CO2 | 1 |
| Glutamate decarboxylase B | gadB | GLU −> GABA + CO2 | 1 |
| Glutaminase A | GLN −> GLU + NH3 | 0 | |
| Glutaminase B | GLN −> GLU + NH3 | 0 | |
| Proline dehydrogenase | putA | PRO + FAD −> FADH + GLUGSAL | 1 |
| Pyrroline-5-carboxylate dehydrogenase | putA | GLUGSAL + NAD −> NADH + GLU | 1 |
| Serine deaminase 1 | sdaA | SER −> PYR + NH3 | 1 |
| Serine deaminase 2 | sdaB | SER −> PYR + NH3 | 1 |
| Trypothanase | tnaA | SER −> PYR + NH3 | 1 |
| D-Serine deaminase | dsdA | DSER −> PYR + NH3 | 1 |
| Threonine dehydrogenase | tdh | THR + NAD −> 2A3O + NADH | 1 |
| Amino ketobutyrate ligase | kbl | 2A3O + COA −> ACCOA + GLY | 1 |
| Threonine dehydratase catabolic | tdcB | THR −> OBUT + NH3 | 1 |
| Threonine deaminase 1 | sdaA | THR −> OBUT + NH3 | 1 |
| Threonine deaminase 2 | sdaB | THR −> OBUT + NH3 | 1 |
| Tryptophanase | tnaA | TRP <−> INDOLE + PYR + NH3 | 1 |
| Amidophosphoribosyl transferase | purF | PRPP + GLN −> PPI + GLU + PRAM | 1 |
| Phosphoribosylamine-glycine ligase | purD | PRAM + ATP + GLY <−> ADP + PI + GAR | 1 |
| Phosphoribosylglycinamide formyltransferase | purN | GAR + FTHF −> THF + FGAR | 1 |
| GAR transformylase T | purT | GAR + FOR + ATP −> ADP + PI + FGAR | 1 |
| Phosphoribosylformylglycinamide synthetase | purL | FGAR + ATP + GLN −> GLU + ADP + PI + FGAM | 1 |
| Phosphoribosylformylglycinamide cyclo-ligase | purM | FGAM + ATP −> ADP + PI + AIR | 1 |
| Phosphoribosylaminoimidazole carboxylase 1 | purK | AIR + CO2 + ATP <−> NCAIR + ADP + PI | 1 |
| Phosphoribosylaminoimidazole carboxylase 2 | purE | NCAIR <−> CAIR | 1 |
| Phosphoribosylaminoimidazole-succinocarboxamide | purC | CAIR + ATP + ASP <−> ADP + PI + SAICAR | 1 |
| synthetase | |||
| 5′-Phosphoribosyl-4-(N-succinocarboxamide)-5- | purB | SAICAR <−> FUM + AICAR | 1 |
| aminoimidazole lya | |||
| AICAR transformylase | purH | AICAR + FTHF <−> THF + PRFICA | 1 |
| IMP cyclohydrolase | purH | PRFICA <−> IMP | 1 |
| Adenylosuccinate synthetase | purA | IMP + GTP + ASP −> GDP + PI + ASUC | 1 |
| Adenylosuccinate lyase | purB | ASUC <−> FUM + AMP | 1 |
| IMP dehydrogenase | guaB | IMP + NAD −> NADH + XMP | 1 |
| GMP synthase | guaA | XMP + ATP + GLN −> GLU + AMP + PPI + GMP | 1 |
| GMP reductase | guaC | GMP + NADPH −> NADP + IMY + NH3 | 1 |
| Aspartate-carbamoyltransferase | pyrBI | CAP + ASP −> CAASP + PI | 2 |
| Dihydroorotase | pyrC | CAASP <−> DOROA | 1 |
| Dihydroorotate dehydrogenase | pyrD | DOROA + Q <−> QH2 + OROA | 1 |
| Orotate phosphoribosyl transferase | pyrE | OROA + PRPP <−> PPI + OMP | 1 |
| OMP decarboxylase | pyrF | OMP −> CO2 + UMP | 1 |
| CTP synthetase | pyrG | UTP + GLN + ATP −> GLU + CTP + ADP + PI | 1 |
| Adenylate kinase | adk | ATP + AMP <−> 2 ADP | 1 |
| Adenylate kinase | adk | GTP + AMP <−> ADP + GDP | 1 |
| Adenylate kinase | adk | ITP + AMP <−> ADP + IDP | 1 |
| Adenylate kinase | adk | DAMP + ATP <−> ADP + DADP | 1 |
| Guanylate kinase | gmk | GMP + ATP <−> GDP + ADP | 1 |
| Deoxyguanylate kinase | gmk | DGMP + ATP <−> DGDP + ADP | 1 |
| Nucleoside-diphosphate kinase | ndk | GDP + ATP <−> GTP + ADP | 1 |
| Nucleoside-diphosphate kinase | ndk | UDP + ATP <−> UTP + ADP | 1 |
| Nucleoside-diphosphate kinase | ndk | CDP + ATP <−> CTP + ADP | 1 |
| Nucleoside-diphosphate kinase | ndk | DGDP + ATP <−> DGTP + ADP | 1 |
| Nucleoside-diphosphate kinase | ndk | DUDP + ATP <−> DUTP + ADP | 1 |
| Nucleoside-diphosphate kinase | ndk | DCDP + ATP <−> DCTP + ADP | 1 |
| Nucleoside-diphosphate kinase | ndk | DADP + ATP <−> DATP + ADP | 1 |
| Nucleoside-diphosphate kinase | ndk | DTDP + ATP <−> DTTP + ADP | 1 |
| AMP Nucleosidse | amn | AMP −> AD + R5P | 1 |
| Adenosine deaminase | add | ADN −> INS + NH3 | 1 |
| Deoxyadenosine deaminase | add | DA −> DIN + NH3 | 1 |
| Adenine deaminase | yicP | AD −> NH3 + HYXN | 1 |
| Inosine kinase | gsk | INS + ATP −> IMP + ADP | 1 |
| Guanosine kinase | gsk | GSN + ATP −> GMP + ADP | 1 |
| Adenosine kinase | adk | ADN + ATP −> AMP + ADP | 1 |
| Adenine phosphotyltransferase | apt | AD + PRPP −> PPI + AMP | 1 |
| Xanthine-guanine phosphoribosyltransferase | gpt | XAN + PRPP −> XMP + PPI | 1 |
| Xanthine-guanine phosphoribosyltransferase | gpt | HYXN + PRPP −> PPI + IMP | 1 |
| Hypoxanthine phosphoribosyltransferase | hpt | HYXN + PRPP −> PPI + IMP | 1 |
| Xanthine-guanine phosphoribosyltransferase | gpt | GN + PRPP −> PPI + GMP | 1 |
| Hypoxanthine phosphoribosyltransferase | hpt | GN + PRPP −> PPI + GMP | 1 |
| Xanthosine phosphorylase | xapA | DIN + PI <−> HYXN + DR1P | 1 |
| Purine nucleotide phosphorylase | deoD | DIN + PI <−> HYXN + DR1P | 1 |
| Xanthosine phosphorylase | xapA | DA + PI <−> AD + DR1P | 1 |
| Purine nucleotide phosphorylase | deoD | DA + PI <−> AD + DR1P | 1 |
| Xanthosine phosphorylase | xapA | DG + PI <−> GN + DR1P | 1 |
| Purine nucleotide phosphorylase | deoD | DG + PI <−> GN + DR1P | 1 |
| Xanthosine phosphorylase | xapA | HYXN + R1P <−> INS + PI | 1 |
| Purine nucleotide phosphorylase | deoD | HYXN + R1P <−> INS + PI | 1 |
| Xanthosine phosphorylase | xapA | AD + R1P <−> PI + ADN | 1 |
| Purine nucleotide phosphorylase | deoD | AD + R1P <−> PI + ADN | 1 |
| Xanthosine phosphorylase | xapA | GN + R1P <−> PI + GSN | 1 |
| Purine nucleotide phosphorylase | deoD | GN + R1P <−> PI + GSN | 1 |
| Xanthosine phosphorylase | xapA | XAN + R1P <−> PI + XTSN | 1 |
| Purine nucleotide phosphorylase | deoD | XAN + R1P <−> PI + XTSN | 1 |
| Uridine phosphorylase | udp | URI + PI <−> URA + R1P | 1 |
| Thymidine (deoxyuridine) phosphorylase | deoA | DU + PI <−> URA + DR1P | 1 |
| Purine nucleotide phosphorylase | deoD | DU + PI <−> URA + DR1P | 1 |
| Thymidine (deoxyuridine) phosphorylase | deoA | DT + PI <−> THY + DR1P | 1 |
| Cytidylate kinase | cmkA | DCMP + ATP <−> ADP + DCDP | 1 |
| Cytidylate kinase | cmkA | CMP + ATP <−> ADP + CDP | 1 |
| Cytidylate kinase | cmkB | DCMP + ATP <−> ADP + DCDP | 1 |
| Cytidylate kinase | cmkB | CMP + ATP <−> ADP + CDP | 1 |
| Cytidylate kinase | cmkA | UMP + ATP <−> ADP + UDP | 1 |
| Cytidylate kinase | cmkB | UMP + ATP <−> ADP + UDP | 1 |
| dTMP kinase | tmk | DTMP + ATP <−> ADP + DTDP | 1 |
| Uridylate kinase | pyrH | UMP + ATP <−> UDP + ADP | 1 |
| Uridylate kinase | pyrH | DUMP + ATP <−> DUDP + ADP | 1 |
| Thymidine (deoxyuridine) kinase | tdk | DU + ATP −> DUMP + ADP | 1 |
| Uracil phosphoribosyltransferase | upp | URA + PRPP −> UMP + PPI | 1 |
| Cytosine deaminase | codA | CYTS −> URA + NH3 | 1 |
| Uridine kinase | udk | URI + GTP −> GDP + UMP | 1 |
| Cytodine kinase | udk | CYTD + GTP −> GDP + CMP | 1 |
| CMP glycosylase | CMP −> CYTS + R5P | 0 | |
| Cytidine deaminase | cdd | CYTD −> URI + NH3 | 1 |
| Thymidine (deoxynridine) kinase | tdk | DT + ATP −> ADP + DTMP | 1 |
| dCTP deaminase | dcd | DCTP −> DUTP + NH3 | 1 |
| Cytidine deaminase | cdd | DC −> NH3 + DU | 1 |
| 5′-Nucleotidase | ushA | DUMP −> DU + PI | 1 |
| 5′-Nucleotidase | ushA | DTMP −> DT + PI | 1 |
| 5′-Nucleotidase | ushA | DAMP −> DA + PI | 1 |
| 5′-Nucleotidase | ushA | DGMP −> DG + PI | 1 |
| 5′-Nucleotidase | ushA | DCMP −> DC + PI | 1 |
| 5′-Nucleotidase | ushA | CMP −> CYTD + PI | 1 |
| 5′-Nucleotidase | ushA | AMP −> PI + ADN | 1 |
| 5′-Nucleotidase | ushA | GMP −> PI + GSN | 1 |
| 5′-Nucleotidase | ushA | IMP −> PI + INS | 1 |
| 5′-Nucleotidase | ushA | XMP −> PI + XTSN | 1 |
| 5′-Nucleotidase | ushA | UMP −> PT + URI | 1 |
| Ribonucleoside-diphosphate reductase | nrdAB | ADP + RTHIO −> DADP + OTHIO | 2 |
| Ribonucleoside-diphosphate reductase | nrdAB | GDP + RTHIO −> DGDP + OTHIO | 2 |
| Ribonucleoside-triphosphate reductase | nrdD | ATP + RTHIO −> DATP + OTHIO | 1 |
| Ribonucleoside-triphosphate reductase | nrdD | GTP + RTHIO −> DGTP + OTHIO | 1 |
| Ribonucleoside-diphosphate reductase | nrdAB | CDP + RTHIO −> DCDP + OTHIO | 2 |
| Ribonucleoside-diphosphate reductase II | nrdEF | CDP + RTHIO −> DCDP + OTHIO | 2 |
| Ribonucleoside-diphosphate reductase | nrdAB | UDP + RTHIO −> DUDP + OTHIO | 2 |
| Ribonucleoside-triphosphate reductase | nrdD | CTP + RTHIO −> DCTP + OTHIO | 1 |
| Ribonucleoside-triphosphate reductase | nrdD | UTP + RTHIO −> OTHIO + DUTP | 1 |
| dUTP pyrophosphatase | dut | DUTP −> PPI + DUMP | 1 |
| Thymidilate synthetase | thyA | DUMP + METTHF −> DHF + DTMP | 1 |
| Nucleoside triphosphatase | mutT | GTP −> GSN + 3 PI | 1 |
| Nucleoside triphosphatase | mutT | DGTP −> DG + 3 PI | 1 |
| Deoxyguanosinetriphosphate triphophohydrolase | dgt | DGTP −> DG + 3 PI | 1 |
| Deoxyguanosinetriphosphate triphophohydrolase | dgt | GTP −> GSN + 3 PI | 1 |
| Glycine cleavage system (Multi-component system) | gcvHTP, IpdA | GLY + THF + NAD −> METTHF + NADH + CO2 + NH3 | 4 |
| Formyl tetrahydrofolate deformylase | purU | FTHF −> FOR + THF | 1 |
| Methylene tetrahydrofolate reductase | metF | METTHF + NADH −> NAD + MTHF | 1 |
| Methylene THF dehydrogenase | folD | METTHF + NADP <−> METHF + NADPH | 1 |
| Methenyl tetrahydrofolate cyclehydrolase | folD | METHE <−> FTHF | 1 |
| Acetyl-CoA carboxyltransferase | accABD | ACCOA + ATP + CO2 <−> MALCOA + ADP + PI | 3 |
| Malonyl-CoA-ACP transacylase | fabD | MALCOA + ACP <−> MALACP + COA | 1 |
| Malonyl-ACP decarboxylase | fadB | MALACP −> ACACP + CO2 | 1 |
| Acetyl-CoA-ACP transacylase | fabH | ACACP + COA <−> ACCOA + ACP | 1 |
| Acyltransferase | pls | GL3P + 0.035 C140ACP + 0.102 C141ACP + 0.717 C160AC | 0 |
| CDP-Diacylglycerol synthetase | cdsA | PA + CTP <−> CDPDG + PPI | 1 |
| CDP-Diacylglycerol pyrophosphatase | cdh | CDPDG −> CMP + PA | 1 |
| Phosphatidylserine synthase | pssA | CDPDG + SER <−> CMP + PS | 1 |
| Phosphatidylserine decarboxylase | psd | PS −> PE + CO2 | 1 |
| Phosphatidylglycerol phosphate synthase | pgsA | CDPDG + GL3P <−> CMP + PGP | 1 |
| Phosphatidylglycerol phosphate phosphatase A | pgpA | PGP −> PI + PG | 0 |
| Phosphatidylglycerol phosphate phosphatase B | pgpB | PGP −> PI + PG | 1 |
| Cardiolipin synthase | cls | 2 PG <−> CL + GL | 1 |
| Acetyl-CoA C-acetyltransferase | atoB | 2 ACCOA <−> COA + AACCOA | 1 |
| Isoprenyl-pyrophosphate synthesis pathway | T3P1 + PYR + 2 NADPH + ATP- > IPPP + ADP + 2 NADP + | 0 | |
| Isoprenyl pyrophosphate isomerase | IPPP −> DMPP | 0 | |
| Farnesyl pyrophosphate synthetase | ispA | DMPP + IPPP −> GPP + PPI | 1 |
| Geranyltranstransferase | ispA | GPP + IPPP −> FPP + PPI | 1 |
| Octoprenyl pyrophosphate synthase (5 reactions) | ispB | 5 IPPP + FPP −> OPP + 5 PPI | 1 |
| Undecaprenyl pyrophosphate synthase (8 reactions) | 8 IPPP + FPP −> UDPP + 8 PPI | 0 | |
| Chorismate pyruvate-lyase | ubiC | CHOR −> 4HBZ + PYR | 1 |
| Hydroxybenzoate octaprenyltransferase | ubiA | 4HBZ + OPP −> O4HBZ + PPI | 1 |
| Octaprenyl-hydroxybeuzoate decarboxylase | ubiD, ubiX | O4HBZ −> CO2 + 2OPPP | 1 |
| 2-Octaprenylphenol hydroxylase | ubiB | 2OPPP + O2 −> 206H | 1 |
| Methylation reaction | 2O6H + SAM −> 2OPMP + SAH | 0 | |
| 2-Octaprenyl-6-methoxyphenol hydroxylase | ubiH | 2OPMP + O2 −> 2OPMB | 1 |
| 2-Octaprenyl-6-methoxy-1,4-benzoquinone methylase | ubiE | 2OPMB + SAM −> 2OPMMB + SAH | 0 |
| 2-Octaprenyl-3-methyl-6-methoxy-1,4- | ubiF | 2OPMMB + O2 −> 2OMHMB | 0 |
| benzoquinone hydroxylase | |||
| 3-Dimethylubiquinone 3-methyltransferase | ubiG | 2OMHMB + SAM −> QH2 + SAH | 1 |
| Isochorismate synthase 1 | menF | CHOR −> ICHOR | 1 |
| α-Ketoglutarate decarboxylase | menD | AKG + TPP −> SSALTPP + CO2 | 1 |
| SHCHC synthase | menD | ICHOR + SSALTPP −> PYR + TPP + SHCHC | 1 |
| O-Succinylbenzoate-CoA synthase | menC | SHCHC −> OSB | 1 |
| O-Succinylbenzoic acid-CoA ligase | menE | OSB + ATP + COA −> OSBCOA + AMP + PPI | 1 |
| Naphthoate synthase | menB | OSBCOA −> DHNA + COA | 1 |
| 1,4-Dihydroxy-2-naphthoate octaprenyltransferase | menA | DHNA + OPP −> DMK + PPI + CO2 | 1 |
| S-Adenosylmethionine-2-DMK methyltransferase | menG | DMK + SAM −> MK + SAH | 1 |
| Isochorismate synthase 2 | entC | CHOR −> ICHOR | 1 |
| Isochorismatase | entB | ICHOR <−> 23DHDHB + PYR | 1 |
| 2,3-Dihydo-2,3-dihydroxybenzoate dehydrogenase | entA | 23DHDHB + NAD <−> 23DHB + NADH | 1 |
| ATP-dependent activation of 2,3-dihydroxybenzoate | entE | 23DHB + ATP <−> 23DHBA + PPI | 1 |
| ATP-dependent serine activating enzyme | entF | SER + ATP <−> SERA + PPI | 1 |
| Enterochelin synthetase | entD | 3 SERA + 3 23DHBA −> ENTER + 6 AMP | 1 |
| GTP cyclohydrolase II | ribA | GTP −> D6RP5P + FOR + PPI | 1 |
| Pryimidine deaminase | ribD | D6RP5P −> A6RP5P + NH3 | 1 |
| Pyrimidine reductase | ribD | A6RP5P + NADPH −> A6RP5P2 + NADP | 1 |
| Pyrimidine phosphatase | A6RP5P2 −> A6RP + PI | 0 | |
| 3,4 Dihydroxy-2-butanone-4-phosphate synthase | ribB | RL5P −> DB4P + FOR | 1 |
| 6,7-Dimethyl-8-ribityllumazine synthase | ribE | DB4P + A6RP −> D8RL + PI | 1 |
| Riboflavin synthase | ribH | 2 D8RL −> RIBFLV + A6RP | 1 |
| Riboflavin kinase | ribF | RIBFLV + ATP −> FMN + ADP | 1 |
| FAD synthetase | ribF | FMN + ATP −> FAD + PPI | 1 |
| GTP cyclohydrolase I | folE | GTP −> FOR + AHTD | 1 |
| Dihydroneopterin triphosphate pyrophosphorylase | ntpA | AHTD −> PPI + DHPP | 1 |
| Nucleoside triphosphatase | mutT | AHTD −> DHP + 3 PI | 1 |
| Dihydroneopterin monophosphate dephosphorylase | DHPP −> DHP + PI | 0 | |
| Dihydroneopterin aldolase | folB | DHP −> AHHMP + GLAL | 1 |
| 6-Hydroxymethyl-7,8 dihydropterin pyrophosphokinase | folK | AHHMP + ATP −> AMP + AHHMD | 1 |
| Aminodeoxychorismate synthase | pabAB | CHOR + GLN −> ADCHOR + GLU | 2 |
| Aminodeoxychorismate lyase | pabC | ADCHOR −> PYR + PABA | 1 |
| Dihydropteroate synthase | folP | PABA + AHHMD −> PPI + DHPT | 1 |
| Dihydrofolate synthetase | folC | DHPT + ATP + GLU −> ADP + PI + DHF | 1 |
| Dihydrofolate reductase | folA | DHF + NADPH −> NADP + THF | 1 |
| Ketopentoate hydroxymethyl transferase | panB | OIVAL + METTHF −> AKP + THF | 1 |
| Ketopantoate reductase | panE | AKP + NADPH −> NADP + PANT | 0 |
| Acetohyoxyacid isomeroreductase | ilvC | AKP + NADPH −> NADP + PANT | 1 |
| Aspartate decarboxylase | panD | ASP −> CO2 + bALA | 1 |
| Pantoate-β-alanine ligase | panC | PANT + bALA + ATP −> AMP + PPI + PNTO | 1 |
| Pantothenate kinase | coaA | PNTO + ATP −> ADP + 4PPNTO | 1 |
| Phosphopantothenate-cysteine ligase | 4PPNTO + CTP + CYS −> CMP + PPI + 4PPNCYS | 0 | |
| Phosphopantothenate-cysteine decarboxylase | 4PPNCYS −> CO2 + 4PPNTE | 0 | |
| Phospho-pantethiene adenylyltransferase | 4PPNTE + ATP −> PPI + DPCOA | 0 | |
| DephosphoCoA kinase | DPCOA + ATP −> ADP + COA | 0 | |
| ACP Synthase | acpS | COA −> PAP + ACP | 1 |
| Aspartate oxidase | nadB | ASP + FAD −> FADH + ISUCC | 1 |
| Quinolate synthase | nadA | ISUCC + T3P2 −> PI + QA | 1 |
| Quinolate phosphoribosyl transferase | nadC | QA + PRPP −> NAMN + CO2 + PPI | 1 |
| NAMN adenylyl transferase | nadD | NAMN + ATP −> PPI + NAAD | 0 |
| NAMN adenylyl transferase | nadD | NMN + ATP −> NAD + PPI | 0 |
| Deamido-NAD ammonia ligase | nadE | NAAD + ATP + NH3 −> NAD + AMP + PPI | 1 |
| NAD kinase | nadFG | NAD + ATP −> NADP + ADP | 0 |
| NADP phosphatase | NADP −> NAD + PI | 0 | |
| DNA ligase | lig | NAD −> NMN + AMP | 1 |
| NMN amidohydrolase | pncC | NMN −> NAMN + NH3 | 0 |
| NMN glycohydrolase (cytoplasmic) | NMN −> R5P + NAm | 0 | |
| NAm amidohydrolase | pncA | NAm −> NAC + NH3 | 0 |
| NAPRTase | pncB | NAC + PRPP + ATP −> NAMN + PPI + PI + ADP | 1 |
| NAD pyrophosphatase | pnuE | NADxt −> NMNxt + AMPxt | 0 |
| NMN permease | pnuC | NMNxt −> NMN | 1 |
| NMN glycohydrolase (membrane bound) | NMNxt −> R5P + NAm | 0 | |
| Nicotinic acid uptake | NACxt −> NAC | 0 | |
| GSA synthetase | hemM | GLU + ATP −> GTRNA + AMP + PPI | 1 |
| Glutamyl-tRNA synthetase | gltX | GLU + ATP −> GTRNA + AMP + PPI | 1 |
| Glutamyl-tRNA reductase | hemA | GTRNA + NADPH −> GSA + NADP | 1 |
| Glutamate-1-semialdehyde aminotransferase | hemL | GSA −> ALAV | 1 |
| Porphobilinogen synthase | hemB | 8 ALAV −> 4 PBG | 1 |
| Hydroxymethylbilane synthase | hemC | 4 PBG −> HMB + 4 NH3 | 1 |
| Uroporphyrinogen III synthase | hemD | HMB −> UPRG | 1 |
| Uroporphyrin-III C-methyltransferase 1 | hemX | SAM + UPRG −> SAH + PC2 | 1 |
| Uroporphyrin-Ill C-methyltransferase 2 | cysG | SAM + UPRG −> SAH + PC2 | 1 |
| 1,3-Dimethyluroporphyrinogen III dehydrogenase | cysG | PC2 + NAD −> NADH + SHCL | 1 |
| Siroheme ferrochelatase | cysG | SHCL −> SHEME | 1 |
| Uroporphyrinogen decarboxylase | hemE | UPRG −> 4 CO2 + CPP | 1 |
| Coproporphyrinogen oxidase, aerobic | hemF | O2 + CPP −> 2 CO2 + PPHG | 2 |
| Protoporphyrinogen oxidase | hemG | O2 + PPHG −> PPIX | 2 |
| Ferrochelatase | hemH | PPIX −> PTH | 1 |
| Heme O synthase | cyoE | PTH + FPP −> HO + PPI | 1 |
| 8-Amino-7-oxononanoate synthase | bioF | ALA + CHCOA <−> CO2 + COA + AONA | 1 |
| Adenosylmethionine-8-amino-7-oxononanoate | bioA | SAM + AONA <−> SAMOB + DANNA | 1 |
| aminotransferase | |||
| Dethiobiotin synthase | bioD | CO2 + DANNA + ATP <−> DTB + PI + ADP | 1 |
| Biotin synthase | bioB | DTB + CYS <−> BT | 1 |
| Glutamate-cysteine ligase | gshA | CYS + GLU + ATP −> GC + PI + ADP | 1 |
| Glutathione synthase | gshB | GLY + GC + ATP −> RGT + PI + ADP | 1 |
| Glutathione reductase | gor | NADPH + OGT <−> NADP + RGT | 1 |
| thiC protein | thiC | AIR −> AHM | 1 |
| HMP kinase | thiN | AHM + ATP −> AHMP + ADP | 0 |
| HMP-phosphate kinase | thiD | AHMP + ATP −> AHMPP + ADP | 0 |
| Hypothetical | T3P1 + PYR −> DTP | 0 | |
| thiG protein | thiG | DTP + TYR + CYS −> THZ + HBA + CO2 | 1 |
| thiE protein | thiE | DTP + TYR + CYS −> THZ + HBA + CO2 | 1 |
| thiF protein | thiF | DTP + TYR + CYS −> THZ + HBA + CO2 | 1 |
| thiH protein | thiH | DTP + TYR + CYS −> THZ + HBA + CO2 | 1 |
| THZ kinase | thiM | THZ + ATP −> THZP + ADP | 0 |
| Thiamin phosphate synthase | thiB | THZP + AHMPP −> THMP + PPI | 0 |
| Thiamin kinase | thiK | THMP + ADP <−> THIAMIN + ATP | 0 |
| Thiamin phosphate kinase | thiL | THMP + ATP <−> TPP + ADP | 0 |
| Erythrose 4-phosphate dehydrogenase | epd | E4P + NAD <−> ER4P + NADH | 1 |
| Erythronate-4-phosphate dehydrogenase | pdxB | ER4P + NAD <−> OHB + NADH | 1 |
| Hypothetical transaminase/phosphoserine transaminase | serC | OHB + GLU <−> PHT + AKG | 1 |
| Pyridoxal-phosphate biosynthetic proteins pdxJ-pdxA | pdxAJ | PHT + DX5P −> P5P + CO2 | 2 |
| Pyridoxine 5′-phosphate oxidase | pdxH | P5P + O2 <−> PL5P + H2O2 | 1 |
| Threonine synthase | thrC | PHT −> 4HLT + PI | 1 |
| Hypothetical Enzyme | 4HLT −> PYRDX | 0 | |
| Pyridoxine kinase | pdxK | PYRDX + ATP −> P5P + ADP | 1 |
| Hypothetical Enzyme | P5P −> PYRDX + PI | 0 | |
| Hypothetical Enzyme | PL5P −> PL + PI | 0 | |
| Pyridoxine kinase | pdxK | PL + ATP −> PL5P + ADP | 1 |
| Pyridoxine 5′-phosphate oxidase | pdxH | PYRDX + O2 <−> PL + H2O2 | 1 |
| Pyridoxine 5′-phosphate oxidase | pdxH | PL + O2 + NH3 <−> PDLA + H2O2 | 1 |
| Pyridoxine kinase | pdxK | PDLA + ATP −> PDLA5P + ADP | 1 |
| Hypothetical Enzyme | PDLA5P −> PDLA + PI | 0 | |
| Pyridoxine 5′-phosphate oxidase | pdxH | PDLA5P + O2 −> PL5P + H2O2 + NH3 | 1 |
| Serine hydroxymethyltransferase (serine methylase) | glyA | PL5P + GLU −> PDLA5P + AKG | 1 |
| Serine hydroxymethyltransferase (serile methylase) | glyA | PL5P + ALA −> PDLA5P + PYR | 1 |
| Glutamine fructose-6-phosphate Transaminase | glmS | F6P + GLN −> GLU + GA6P | 1 |
| Phosphoglucosamine mutase | glmM | GA6P <−> GA1P | 0 |
| N-Acetylglucosamine-1-phosphate-uridyltransferase | glmU | UTP + GAlP + ACCOA −> UDPNAG + PPI + COA | 1 |
| UDP-N-acetylglucosamine acyltransferase | lpxA | C140ACP + UDPNAG −> ACP + UDPG2AA | 1 |
| UDP-3-O-acyl-N-acetylglucosamine deacetylase | lpxC | UDPG2AA −> UDPG2A + AC | 1 |
| UDP-3-O-(3-hydroxymyristoyl)glucosamine- | lpxD | UDPG2A + C140ACP −> ACP + UDPG23A | 1 |
| acyltransferase | |||
| UDP-sugar hydrolase | ushA | UDPG23A −> UMP + LIPX | 1 |
| Lipid A disaccharide synthase | lpxB | LIPX + UDPG23A −> UDP + DISAC1P | 1 |
| Tetraacyldisaccharide 4′ kinase | DISAC1P + ATP −> ADP + LIPIV | 0 | |
| 3-Deoxy-D-manno-octulosonic-acid transferase | kdtA | LIPIV + CMPKDO −> KDOLIPIV + CMP | 1 |
| (KDO transferase) | |||
| 3-Deoxy-D-manno-octulosonic-acid transferase | kdtA | KDOLIPIV + CMPKDO −> K2LIPIV + CMP | 1 |
| (KDO transferase) | |||
| Endotoxin synthase | htrB, msbB | K2LIPIV + C140ACP + C120ACP −> LIPA + 2 ACP | 2 |
| 3-Deoxy-D-manno-octulosonic-acid 8-phosphate | kdsA | PEP + A5P −> KDOP + PI | 1 |
| synthase | |||
| 3-Deoxy-D-manno-octulosonic-acid 8-phosphate | KDOP −> KDO + PI | 0 | |
| phosphatase | |||
| CMP-2-keto-3-deoxyoctonate synthesis | kdsB | KDO + CTP −> PPI + CMPKDO | 1 |
| ADP-L-glycero-D-mannoheptose-6-epimerase | lpcA, rfaED | S7P + ATP −> ADPHEP + PPI | 1 |
| UDP glucose-1-phosphate uridylyltransferase | galU, galF | G1P + UTP −> PPI + UDPG | 2 |
| Ethanolamine phosphotransferase | PE + CMP <−> CDPETN + DGR | 0 | |
| Phosphatidate phosphatase | PA −> PI + DGR | 0 | |
| Diacylglycerol kinase | dgkA | DGR + ATP −> ADP + PA | 1 |
| LPS Synthesis - truncated version of LPS (ref neid) | rfaLJIGFC | LIPA + 3 ADPHEP + 2 UDPG + 2 CDPETN + 3 CMPKDO −> | 6 |
| UDP-N-acetylglucosamine-enolpyruvate transferase | murA | UDPNAG + PEP −> UDPNAGEP + PI | 1 |
| UDP-N-acetylglucosamine-enolpyruvate dehydrogenase | murB | UDPNAGEP + NADPH −> UDPNAM + NADP | 1 |
| UDP-N-acetylmuramate-alanine ligase | murC | UDPNAM + ALA + ATP −> ADP + PI + UDPNAMA | 1 |
| UDP-N-acetylmuramoylalanine-D-glutamate ligase | murD | UDPNAMA + DGLU + ATP −> UDPNAMAG + ADP + PI | 1 |
| UDP-N-acetylmuramoylalanyl-D-glutamate 2,6-diamino- | murE | UDPNAMAG + ATP + MDAP −> UNAGD + ADP + PI | 1 |
| pimelate lig | |||
| D-Alanine-D-alanine adding enzyme | murF | UNAGD + ATP + AA −> UNAGDA + ADP + PI | 1 |
| Glutamate racemase | murI | GLU <−> DGLU | 1 |
| D-ala:D-ala ligases | ddlAB | 2 DALA <−> AA | 2 |
| Phospho-N-acetylmuramoylpentapeptide transferase | mraY | UNAGDA −> UMP + PI + UNPTDO | 1 |
| N-Acetylglucosaminyl transferase | murG | UNPTDO + UDPNAG −> UDP + PEPTIDO | 1 |
| Arabinose (low affinity) | araE | ARABxt + HEXT <−> ARAB | 1 |
| Arabinose (high affinity) | araFGH | ARABxt + ATP −> ARAB + ADP + PI | 3 |
| Dihydroxyacetone | DHAxt + PEP −> T3P2 + PYR | 0 | |
| Fructose | fruABF | FRUxt + PEP −> F1P + PYR | 2 |
| Fucose | fucP | FUCxt + HEXT <−> FUC | 1 |
| Galacitol | gatABC | GLTLxt + PEP −> GLTL1P + PYR | 3 |
| Galactose (low affinity) | galP | GLACxt + HEXT −> GLAC | 1 |
| Galactose (low affinity) | galP | GLCxt + HEXT −> GLC | 1 |
| Galactose (high affinity) | mglABC | GLACxt + ATP −> GLAC + ADP + PI | 3 |
| Glucitol | srlA1A2B | GLTxt + PEP −> GLT6P + PYR | 3 |
| Gluconate | gntST | GLCNxt + ATP −> GLCN + ADP + PT | 1 |
| Glucose | ptsG, crr | GLCxt + PEP −> G6P + PYR | 2 |
| Glycerol | glpF | GLxt <−> GL | 1 |
| Lactose | lacY | LCTSxt + NEXT <−> LCTS | 1 |
| Maltose | malX, crr, malE | MLTxt + PEP −> MLT6P + PYR | 7 |
| Mannitol | mtlA, cmtAB | MNTxt + PEP −> MNT6P + PYR | 3 |
| Mannose | manATZ, ptsPA | MANxt + PEP −> MAN1P + PYR | 6 |
| Melibiose | melB | MELIxt + HEXT −> MELI | 1 |
| N-Acetylglucosamine | nagE, ptsN | NAG + PEP −> NAGP + PYR | 2 |
| Rhamnose | rhaT | RMNxt + ATP −> RMN + ADP + PI | 1 |
| Ribose | rbsABCD, xylH | RIBxt + ATP −> RIB + ADP + PI | 5 |
| Sucrose | scr | SUCxt + PEP −> SUC6P + PYR | 0 |
| Trehalose | treAB | TRExt + PEP −> TRE6P + PYR | 2 |
| Xylose (low affinity) | xylE | XYLxt + NEXT −> XYL | 1 |
| Xylose (high affinity) | xylFG, rbsB | XYLxt + ATP −> XYL + ADP + PI | 3 |
| Alanine | cycA | ALAxt + ATP −> ALA + ADP + PI | 1 |
| Arginine | artPMQJI, arg | ARGxt + ATP −> ARG + ADP + PI | 9 |
| Asparagine (low Affinity) | ASNxt + HEXT <−> ASN | 0 | |
| Asparagine (high Affinity) | ASNxt + ATP −> ASN + ADP + PI | 0 | |
| Aspartate | gltP | ASPxt + HEXT −> ASP | 1 |
| Aspartate | gltJKL | ASPxt + ATP −> ASP + ADP + PI | 3 |
| Branched chain amino acid transport | brnQ | BCAAxt + HEXT <−> BCAA | 1 |
| Cysteine | not identified | CYSxt + ATP −> CYS + ADP + PI | 0 |
| D-Alanine | cycA | DALAxt + ATP −> DALA + ADP + PI | 1 |
| D-Alanine glycine permease | cycA | DALAxt + HEXT <−> DALA | 1 |
| D-Alanine glycine permease | cycA | DSERxt + HEXT <−> DSER | 1 |
| D-Alanine glycine permease | cycA | GLYxt + HEXT <−> GLY | 1 |
| Diaminopimelic acid | MDAPxt + ATP −> MDAP + ADP + PI | 0 | |
| γ-Aminobutyrate transport | gabP | GABAxt + ATP −> GABA + ADP + PI | 1 |
| Glutamate | gltP | GLUxt + HEXT <−> GLU | 1 |
| Glutamate | gltS | GLUxt + HEXT <−> GLU | 1 |
| Glutamate | gltJKL | GLUxt + ATP −> GLU + ADP + PI | 3 |
| Glutamine | glnHPQ | GLNxt + ATP −> GLN + ADP + PI | 3 |
| Glycine | cycA, proVWX | GLYxt + ATP −> GLY + ADP + PI | 4 |
| Histidine | hisJMPQ | HISxt + ATP −> HIS + ADP + PI | 4 |
| Isoleucine | livJ | ILExt + ATP −> ILE + ADP + PI | 1 |
| Leucine | livHKM/livFGJ | LEUxt + ATP −> LEU + ADP + PI | 6 |
| Lysine | lysP | LYSxt + HEXT <−> LYS | 1 |
| Lysine | argT, hisMPQ | LYSxt + ATP −> LYS + ADP + PI | 4 |
| Lysine/Cadaverine | cadB | LYSxt + ATP −> LYS + ADP + PI | 1 |
| Methionine | metD | METxt + ATP −> MET + ADP + PI | 0 |
| Ornithine | argT, hisMPQ | ORNxt + ATP −> ORN + ADP + PI | 4 |
| Phenlyalanine | aroP/mtr/pheP | PHExt + HEXT <−> PHE | 3 |
| Proline | putP, proPWX | PROxt + HEXT <−> PRO | 4 |
| Proline | cycA, proVW | PROxt + ATP −> PRO + ADP + PI | 4 |
| Putrescine | potEFHIG | PTRCxt + ATP −> PTRC + ADP + PI | 5 |
| Serine | sdaC | SERxt + HEXT <−> SER | 1 |
| Serine | cycA | SERxt + ATP −> SER + ADP + PI | 1 |
| Spermidine & putrescine | potABCD | SPMDxt + ATP −> SPMD + ADP + PI | 4 |
| Spermidine & putrescine | potABCD | PTRCxt + ATP −> PTRC + ADP + PI | 4 |
| Threonine | livJ | THRxt + ATP −> THR + ADP + PI | 1 |
| Threonine | tdcC | THRxt + HEXT <−> THR | 1 |
| Tryptophan | tnaB | TRPxt + HEXT <−> TRP | 1 |
| Tyrosine | tyrP | TYRxt + HEXT <−> TYR | 1 |
| Valine | livJ | VALxt + ATP −> VAL + ADP + PI | 1 |
| Dipeptide | dppABCDF | DIPEPxt + ATP −> DIPEP + ADP + PI | 5 |
| Oligopeptide | oppABCDF | OPEPxt + ATP −> OPEP + ADP + PI | 5 |
| Peptide | sapABD | PEPTxt + ATP −> PEPT + ADP + PI | 3 |
| Uracil | uraA | URAxt + HEXT −> URA | 1 |
| Nicotinamide mononucleotide transporter | pnuC | NMNxt + HEXT −> + NMN | 1 |
| Cytosine | codB | CYTSxt + HEXT −> CYTS | 1 |
| Adenine | purB | ADxt + HEXT −> AD | 1 |
| Guanine | gpt, hpt | GNxt <−> GN | 2 |
| Hypoxanthine | gpt, hpt | HYXNxt <−> HYXN | 2 |
| Xanthosine | xapB | XTSNxt <−> XTSN | 1 |
| Xanthine | gpt | XANxt <−> XAN | 1 |
| G-system | nupG | ADNxt + NEXT −> ADN | 1 |
| G-system | nupG | GSNxt + NEXT −> GSN | 1 |
| G-system | nupG | URIxt + NEXT −> URI | 1 |
| G-system | nupG | CYTDxt + HEXT −> CYTD | 1 |
| G-system (transports all nucleosides) | nupG | INSxt + HEXT −> INS | 1 |
| G-system | nupG | XTSNxt + HEXT −> XTSN | 1 |
| G-system | nupG | DTxt + HEXT −> DT | 1 |
| G-system | nupG | DINxt + HEXT −> DIN | 1 |
| G-system | nupG | DGxt + HEXT −> DG | 1 |
| G-system | nupG | DAxt + HEXT −> DA | 1 |
| G-system | nupG | DCxt + HEXT −> DC | 1 |
| G-system | nupG | DUxt + HEXT −> DU | 1 |
| C-system | nupC | ADNxt + HEXT −> ADN | 1 |
| C-system | nupC | URIxt + HEXT −> UIRI | 1 |
| C-system | nupC | CYTDxt + HEXT −> CYTD | 1 |
| C-system | nupC | DTxt + HEXT −> DT | 1 |
| C-system | nupC | DAxt + HEXT −> DA | 1 |
| C-system | nupC | DCxt + HEXT −> DC | 1 |
| C-system | nupC | DUxt + HEXT −> DU | 1 |
| Nucleosides and deoxynucleoside | tsx | ADNxt + HEXT −> ADN | 1 |
| Nucleosides and deoxynucleoside | tsx | GSNxt + HEXT −> GSN | 1 |
| Nucleosides and deoxynucleoside | tsx | URIxt + HEXT −> URI | 1 |
| Nucleosides and deoxynucleoside | tsx | CYTDxt + HEXT −> CYTD | 1 |
| Nucleosides and deoxynucleoside | tsx | INSxt + HEXT −> INS | 1 |
| Nucleosides and deoxynucleoside | tsx | XTSNxt + HEXT −> XTSN | 1 |
| Nucleosides and deoxynucleoside | tsx | DTxt + HEXT −> DT | 1 |
| Nucleosides and deoxynucleoside | tsx | DINxt + HEXT −> DIN | 1 |
| Nucleosides and deoxynucleoside | tsx | DGxt + HEXT −> DG | 1 |
| Nucleosides and deoxynucleoside | tsx | DAxt + HEXT −> DA | 1 |
| Nucleosides and deoxynucleoside | tsx | DCxt + HEXT −> DC | 1 |
| Nucleosides and deoxynucleoside | tsx | DUxt + HEXT −> DU | 1 |
| Acetate transport | ACxt + HEXT <−> AC | 0 | |
| Lactate transport | LACxt + HEXT <−> LAC | 0 | |
| L-Lactate | lldP | LLACxt + HEXT <−> LLAC | 1 |
| Formate transport | focA | FORxt <−> FOR | 1 |
| Ethanol transport | ETHxt + HEXT <−> ETH | 0 | |
| Succinate transport | dcuAB | SUCCxt + HEXT <−> SUCC | 2 |
| Pyruvate transport | PYRxt + HEXT <−> PYR | 0 | |
| Ammonia transport | amtB | NH3xt + HEXT <−> NH3 | 1 |
| Potassium transport | kdpABC | Kxt + ATP −> K + ADP + PI | 3 |
| Potassium transport | trkAEHG | Kxt + HEXT K−> K | 3 |
| Sulfate transport | cysPTUWAZ, s | SLFxt + ATP −> SLF + ADP + PI | 7 |
| Phosphate transport | pstABCS | PIxt + ATP −> ADP + 2 PI | 4 |
| Phosphate transport | pitAB | PIxt + HEXT <−> PI | 2 |
| Glycerol-3-phosphate | glpT, ugpABCE | GL3Pxt + PI −> GL3P | 5 |
| Dicarboxylates | dcuAB, dctA | SUCCxt + HEXT <−> SUCC | 3 |
| Dicarboxylates | dcuAB, dctA | FUMxt + HEXT <−> FUM | 3 |
| Dicarboxylates | dcuAB, dctA | MALxt + HEXT <−> MAL | 3 |
| Dicarboxylates | dcuAB, dctA | ASPxt + HEXT <−> ASP | 3 |
| Fatty acid transport | fadL | C140xt −> C140 | 1 |
| Fatty acid transport | fadL | C160xt −> C160 | 1 |
| Fatty acid transport | fadL | C180xt −> C180 | 1 |
| α-Ketoglutarate | kgtP | AKGxt + HEXT <−> AKG | 1 |
| Na/H antiporter | nhaABC | NAxt + <−> NA + HEXT | 2 |
| Na/H antiporter | chaABC | NAxt + <−> NA + HEXT | 3 |
| Pantothenate | panF | PNTOxt + HEXT <−> PNTO | 1 |
| Sialic acid permease | nanT | SLAxt + ATP −> SLA + ADP + PI | 1 |
| Oxygen transport | O2xt <−> O2 | 0 | |
| Carbon dioxide transport | CO2xt <−> CO2 | 0 | |
| Urea transport | UREAxt + 2 HEXT <−> UREA | 0 | |
| ATP drain flux for constant maintanence requirements | ATP −> ADP + PI | 0 | |
| Glyceraldehyde transport | gufP | GLALxt <−> GLAL | 0 |
| Acetaldehyde transport | ACALxt <−> ACAL | 0 | |
| TABLE 2 |
| Comparison of the predicted mutant growth characteristics from the gene deletion |
| study to published experimental results with single and double mutants. |
| Glucose | Glycerol | Succinate | Acetate | |
| Gene | (in vivo/in silico) | (in vivo/in silico) | (in vivo/in silico) | (in vivo/in silico) |
| aceEF | −/+ | |||
| aceA | −/− | |||
| aceB | −/− | |||
| ackA | +/+ | |||
| acs | +/+ | |||
| acn | −/− | −/− | −/− | −/− |
| cyd | +/+ | |||
| cyo | +/+ | |||
| eno | −/+ | −/+ | −/− | −/− |
| fba | −/+ | |||
| fbp | +/+ | −/− | −/− | −/− |
| gap | −/− | −/− | −/− | −/− |
| gltA | −/− | −/− | −/− | −/− |
| gnd | +/+ | |||
| idh | −/− | −/− | −/− | −/− |
| ndh | +/+ | +/+ | ||
| nuo | +/+ | +/+ | ||
| pfk | −/+ | |||
| pgi | +/+ | +/+ | ||
| pgk | −/− | −/− | −/− | −/− |
| pgl | +/+ | |||
| pntAB | +/+ | +/+ | +/+ | +/+ |
| glk | +/+ | |||
| ppc | ±/+ | −/+ | +/+ | +/+ |
| pta | +/+ | |||
| pts | +/+ | |||
| pyk | +/+ | |||
| rpi | −/− | −/− | −/− | −/− |
| sdhABCD | +/+ | |||
| tpi | −/+ | −/− | −/− | −/− |
| unc | +/+ | −/− | −/− | |
| zwf | +/+ | |||
| sucAD | +/+ | |||
| zwf, pnt | +/+ | |||
| pck, mes | −/− | −/− | ||
| pck, pps | −/− | −/− | ||
| pgi, zwf | −/− | |||
| pgi, gnd | −/− | |||
| pta, acs | −/− | |||
| tktA, tktB | −/− | |||
| Results are scored as + or − meaning growth or no growth determined from in vivo/in silico data. In 73 of 80 cases the in silico behavior is the same as the experimentally observed behavior. |
Claims
1-23. (canceled)
24. A memory storing data for access by a software program being executed by at least one processor, comprising:
a genome specific stoichiometric matrix stored in said memory, said genome specific stoichiometric matrix storing substrates, products, and stoichiometry for a plurality of metabolic reactions specific to an organism,
wherein at least one of said metabolic reactions corresponds to a potential function of a candidate protein that is encoded by an open reading frame of the organism's genome and for which a function is not known.
25. The memory of claim 24, wherein the potential function is based on homology of the open reading frame to a nucleotide encoding a protein of known function in another organism.
26. The memory of claim 24, wherein the potential function is based on homology of an amino acid sequence of the candidate protein to an amino acid sequence of a protein of known function in another organism.
27. The memory of claim 24, wherein said memory is selected from the group consisting of: a hard disk, optical memory, Random Access Memory, Read Only Memory and Flash Memory.
28. The memory of claim 24, wherein said organism is Escherichia coli.
Images & Drawings included:
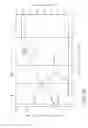
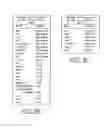
Sources:
- United States Patent and Trademark Office - verify current appl. status at the USPTO↗
Similar patent applications:
Recent applications in this class:
- » 20210103642 2021-04-08
DETERMINING A PROBABILISTIC DIAGNOSIS OF CANCER BY ANALYSIS OF GENOMIC COPY NUMBER VARIATIONS - » 20200104463 2020-04-02
GENOMIC NETWORK SERVICE USER INTERFACE - » 20200026822 2020-01-23
SYSTEM AND METHOD FOR POLYGENIC PHENOTYPIC TRAIT PREDISPOSITION ASSESSMENT USING A COMBINATION OF DYNAMIC NETWORK ANALYSIS AND MACHINE LEARNING - » 20200019675 2020-01-16
POLYGENIC RECOMMENDATIONS BASED ON INDIVIDUALIZED EXPRESSION OF GENETIC VARIANTS - » 20190325113 2019-10-24
DETERMINING A PROBABILISTIC DIAGNOSIS OF CANCER BY ANALYSIS OF GENOMIC COPY NUMBER VARIATIONS - » 20190258776 2019-08-22
Single sample genetic classification via tensor motifs - » 20190228131 2019-07-25
Method capable of differentiating fetal sex and fetal sex chromosome abnormality on various platforms - » 20190205502 2019-07-04
Systems and methods for leveraging relatedness in genomic data analysis - » 20190180000 2019-06-13
PATIENT DIAGNOSIS AND TREATMENT BASED ON GENOMIC TENSOR MOTIFS - » 20190121937 2019-04-25
Systems and Methods For RNA Analysis In Functional Confirmation Of Cancer Mutations
Recent applications for this Assignee:
- » 20250173891 2025-05-29
HUMAN POSE RECOGNITION USING SYNTHETIC IMAGES AND VIEWPOINT/POSE ENCODING - » 20250172572 2025-05-29
NONINVASIVE METHOD TO QUANTIFY KIDNEY FUNCTION AND FUNCTIONAL DECLINE - » 20250170215 2025-05-29
METHODS FOR SCAR REDUCTION BY CONVERTING SCAR FIBROBLASTS INTO ADIPOCYTES WITH HAIR FOLLICLE-DERIVED SIGNALS - » 20250170177 2025-05-29
METHODS AND COMPOSITIONS FOR TREATING CANCER - » 20250170054 2025-05-29
APPLICATIONS AND IMAGING OF SHEAR-THINNING BIOMATERIAL - » 20250169122 2025-05-22
ULTRA-CLEAN VAN DER WAALS HETEROSTRUCTURES AND TECHNIQUES OF FABRICATION THEREOF - » 20250164250 2025-05-22
SYSTEMS AND METHODS FOR PRIORITIZED IMU SELECTION FOR ENHANCING INERTIAL NAVIGATION ACCURACY - » 20250164249 2025-05-22
SYSTEMS AND METHODS FOR PRIORITIZED IMU SELECTION FOR ENHANCING INERTIAL NAVIGATION ACCURACY - » 20250163125 2025-05-22
LFA3 VARIANTS AND COMPOSITIONS AND USES THEREOF - » 20250161933 2025-05-22
Particle-drop structures and methods for making and using the same