Early detection of cell activation by ATR-FTIR spectroscopy
US20160305877A1
2016-10-20
15/102,091
2014-12-04
✅ Patent granted
US 9,983,129 B2
2018-05-29
WO; PCT/US2014/068542; 20141204
WO; WO2015/085056; 20150611
Casey Bryant
Meunier Carlin & Curfman LLC
2034-12-04
Abstract:
Disclosed are methods, systems, and apparatuses for rapidly detecting a cellular interaction, such as ligand:receptor interactions. For example, the disclosed methods and systems can be used to detect a cellular interaction within 15 minutes to 75 minutes. This allows cells to be used as biosensors to detect cell activating agents in a sample.
Inventors:
- A.G. UNIL PERERA 9 🇺🇸 MABLETON, GA, United States
- Jitto TITUS 11 🇺🇸 Acworth, GA, United States
- Chadi FILFILT 1 🇺🇸 Suwanee, GA, United States
- Julia K. HILLIARD 1 🇺🇸 Atlanta, GA, United States
- A. G. Unil Perera 5 🇺🇸 Mableton, GA, United States
- Chadi Filfili 1 🇺🇸 Suwanee, GA, United States
Assignee:
- GEORGIA STATE UNIVERSITY RESEARCH FOUNDATION, INC. 153 🇺🇸 Atlanta, GA, United States
Applicant:
Interested in similar patents?
Get notified when new applications in this technology area are published.
Classification:
G01N21/35 » CPC further
Investigating or analysing materials by the use of optical means, i.e. using sub-millimetre waves, infrared, visible or ultraviolet light; Systems in which incident light is modified in accordance with the properties of the material investigated; Colour; Spectral properties, i.e. comparison of effect of material on the light at two or more different wavelengths or wavelength bands; Investigating relative effect of material at wavelengths characteristic of specific elements or molecules, e.g. atomic absorption spectrometry using infra-red light
G01N33/483 » CPC further
Investigating or analysing materials by specific methods not covered by groups -; Biological material, e.g. blood, urine ; Haemocytometers Physical analysis of biological material
G01N2021/3595 » CPC further
Investigating or analysing materials by the use of optical means, i.e. using sub-millimetre waves, infrared, visible or ultraviolet light; Systems in which incident light is modified in accordance with the properties of the material investigated; Colour; Spectral properties, i.e. comparison of effect of material on the light at two or more different wavelengths or wavelength bands; Investigating relative effect of material at wavelengths characteristic of specific elements or molecules, e.g. atomic absorption spectrometry using infra-red light using FTIR
G01N21/552 » CPC main
Investigating or analysing materials by the use of optical means, i.e. using sub-millimetre waves, infrared, visible or ultraviolet light; Systems in which incident light is modified in accordance with the properties of the material investigated; Specular reflectivity Attenuated total reflection
B07C5/3416 » CPC further
Sorting according to a characteristic or feature of the articles or material being sorted, e.g. by control effected by devices which detect or measure such characteristic or feature; Sorting by manually actuated devices, e.g. switches; Sorting according to other particular properties according to radiation transmissivity, e.g. for light, x-rays, particle radiation
B07C5/34 IPC
Sorting according to a characteristic or feature of the articles or material being sorted, e.g. by control effected by devices which detect or measure such characteristic or feature; Sorting by manually actuated devices, e.g. switches Sorting according to other particular properties
Description
CROSS-REFERENCE TO RELATED APPLICATIONS
This application claims benefit of U.S. Provisional Application No. 61/912,137, filed Dec. 5, 2013, which is hereby incorporated herein by reference in its entirety.
BACKGROUND
In its simplest form, direct observation of responses, such as cytopathic changes induced by virus infections, has been used historically to screen for viruses in cell culture. Confirmatory assays for specific pathogen identification depend on neutralization assays or complex molecular methods that use biological and chemical probes depending on the signals to be detected. These assays are generally elaborate, and require specific reagents and complex methods usually requiring a range of two hours to weeks where there is sufficient material for detection, or up to months when there is not. Measurement of cellular and/or humoral responses to stimuli is also very useful for the identification of normal immune responses or, alternatively, disease or infection states. Cellular and humoral responses engage immediately after immune defenses detect a foreign agent, a stimulant, an antibody, or a pathogen. Devices and methods are needed that can directly detect these responses as they occur, particularly at the cellular level.
SUMMARY
Disclosed are methods, systems, and devices for rapidly detecting cellular responses to stimuli, such as ligand:receptor interactions. These interactions can take place within seconds-to-minutes, and the disclosed methods can detect these interactions within minutes after they occur. For example, the disclosed methods and systems can be used to detect a cellular interaction within 5 minutes to 120 minutes, such as within 15 minutes to 75 minutes, including within 5, 6, 7, 8, 9, 10, 11, 12, 13, 14, 15, 16, 17, 18, 19, 20, 25, 30, 35, 40, 45, 50, 55, 60, 65, 70, 75, 90, 120, or more minutes. This allows cells to be used as biosensors to detect cell activating agents in a sample.
The disclosed method can involve depositing a sample comprising a homogeneous population of cells under reaction conditions on an internal reflection element (IRE). A beam of infrared (IR) radiation can then be directed through the IRE under conditions such that the IR radiation interacts with the homogeneous population of cells. In preferred embodiments, the IR radiation is an evanescent wave with an average penetration depth of about 2 μm. The average size of the cell ranges from 10-40 μm. An absorption spectrum can then be recorded over a range of preselected frequencies at different times post exposure the cell population. This absorption spectrum can then be compared to a control spectrum from untreated cells to identify differences. In some embodiments, a change in absorbance at one or more frequencies compared to the control spectrum is an indication of a cellular interaction in the homogeneous population of cells. In some embodiments, the reaction conditions comprise exposing the homogeneous population of cells with a sample comprising one or more potential cell activating agents. Examples of potential cell activating agents include pathogens (e.g., virus, bacteria, or yeast) or allergens. Examples of potential cell activating agents also include ligands, such as antibodies, growth factors, cytokines, chemokines, hormones, extracellular matrix proteins, or cell-surface proteins. In addition, the potential cell activating agent can be a protein, peptide, peptide nucleic acid, toxin, or small molecule, e.g., from a combinatorial library. In some embodiments, the reaction conditions comprise contacting the homogeneous population of cells with a sample comprising a change in temperature, pH, salinity, or any combination thereof, compared to the control conditions. The disclosed methods can be used for direct assay of tissues, blood, or other bodily fluids from patient to detect infection within minutes. Other commercial uses can stem from the ability to detect toxins or unidentified biological agents in environmental samples, as is common in biological attacks. The methods can also be used for diagnosis through the detection of disease-causing agents in patient samples, when spectra are compared to those obtained from untreated cells.
Also disclosed is a method for using cells as a biosensor, comprising contacting a plurality of cells with a sample, disposing the plurality of cells on an IRE, directing a beam of IR radiation through the IRE under conditions such that the IR radiation interacts with the homogeneous population of cells, recording an absorption spectrum over a range of preselected frequencies at time points following cell exposures, and comparing the absorption spectra to a control spectra. In this method, a change in absorbances at one or more frequencies compared to the control spectra at similar time points is an indication of a cell activating agent in the sample.
Also disclosed is a system for detecting a cell activating agent in a sample that comprises a Fourier transform infrared spectrometer configured with an IRE for ATR, and a homogeneous population of cells selected to react with the cell activating agent.
The cells used in the disclosed methods and systems can be chosen by one of skill in the art based on the cellular interaction/potential cell activating agent of interest. In some embodiments, the cells are unicellular organisms, e.g., bacterial or yeast cells. In some embodiments, the cells are mammalian cells, e.g., human cells of multiple varieties useful to the purpose of identification. In some embodiments, the cells are from a cell line, such as a transformed cell line. In some embodiments, the cells are genetically or morphologically modified in the lab to enhance their ability to detect specific ligands or conditions, such as cells modified to express specific receptors or pathogen pattern recognition molecules.
The range of preselected frequencies for recording absorbance can be selected based on the agent or pathogen-specific cell responses of interest based on the agent or pathogen-specific diversion of cell defenses in time and place. In general, the preselected frequencies will range between 50 cm−1 and 3700 cm−1, in particular between 800 cm−1 and 1500 cm−1.
In preferred embodiments, the IRE is an attenuated total reflectance (ATR) crystal comprising an optical material with a higher refractive index than the sample comprising the plurality of cells. For example, the IRE can be a germanium, zinc selenide, silicon, diamond, or KRS-5 crystal.
In preferred embodiments, the methods and systems involve Fourier Transform Infrared Spectroscopy (FTIR). Therefore, the disclosed methods and systems can further comprise Fourier transformation of the absorbance spectrum. In some embodiments, the ATR crystal is used with a diffractive monochromator instead of an FTIR.
The sample in the above methods and systems can be a biological sample, an environmental sample, or any other sample where a potential agent that derives a cellular response might be present. For example, the biological sample can be a bodily fluid from a subject.
The details of one or more embodiments of the invention are set forth in the accompanying drawings and the description below. Other features, objects, and advantages of the invention will be apparent from the description and drawings, and from the claims.
DESCRIPTION OF DRAWINGS
FIG. 1 is an ATR-FTIR spectra of Jurkat cells in medium initially showing the characteristic peaks of the medium and later the peaks representative of the Jurkat cells along with the medium. Inset (a) is a schematic of the ATR technique where a mid-infrared light beam passes through a Zinc Selenide (ZnSe) crystal such that it is totally internally reflected creating an evanescent wave penetrating approximately 2 microns into the cell suspension deposited on the ZnSe crystal which is absorbed by the cell suspension as dictated by the vibrational modes of the components. (The penetration depth and size of the cells are enlarged for clarity). Inset (b) shows the spectra obtained by the conventional transmission mode FTIR and the ATR-FTIR spectroscopy. The ATR-FTIR spectra shows higher signal to noise ratio and better resolved peaks.
FIG. 2 is an ATR spectrum of cells treated with an activating antibody and cells treated with a control IgG isotype, indicating spectral markers whose absorbance values differentiate the activated from the unactivated cells. The markers are: 1367 cm−1, 1358 cm−1 (Deformation of C—H and N—H), 1335 cm−1 (C—H stretching) and 1250 cm−1 (Amide III of proteins).
FIG. 3 is an ATR spectra of IgG isotypes (impotent activating agents that have the same m chemical composition as that of the activating agents) read at 15 and 75 min. Note that there are 5 reads plotted for each sample to show the reproducibility.
FIG. 4 is an ATR spectra showing a difference at 1200-1500 cm−1 range between activated and unactivated samples at 15 and 75 min time points.
FIG. 5 is an ATR spectra showing a difference at 1300-1375 cm−1 range between activated and unactivated samples at 15 and 75 min.
DETAILED DESCRIPTION
The disclosed methods involve the use of an infrared spectrum measuring apparatus. In some embodiments, the apparatus comprises: an internal reflecting element (IRE) comprising a reflection face located on the IRE at a region of intended contact between the IRE and a sample; an infrared radiation source for supplying an evanescent wave of infrared radiation and directing the same from the outside of the IRE to the inside thereof so as to cause the infrared radiation to be incident on the reflection face; and a detector for detecting the once-reflected infrared radiation. Representative, but non-limiting examples of instruments that can provide the infrared radiation source include Fourier Transform Infrared Spectroscopy (FTIR) spectrometers.
The range of preselected frequencies for recording absorbance can be selected based on the cell interactions of interest. In general, the preselected frequencies will range between 50 cm−1 and 3700 cm−1, in particular between 800 cm−1 and 1500 cm−1. Table 1 (Applied Spectroscopy Reviews (2008) 43(2):134-179) provides a detailed account of spectral frequencies of the biological tissues.
| TABLE 1 |
| The spectral interpretations |
| Assignment | |
| Peak |
| 472/5 | cm−1 | Cα = Cα′ torsion and C—OH3 torsion of methoxy group |
| 521 | cm−1 | Cα = Cα′torsion and ring torsion of phenyl |
| 600-900 | cm−1 | CH out-of-plane bending vibrations |
| 606 | cm−1 | Ring deformation of phenyl |
| 608 | cm−1 | Ring deformation of phenyl |
| 635 | cm−1 | OH out-of-plane bend (associated) |
| 700-1000 | cm−1 | Out-of-plane bending vibrations |
| 793 | cm−1 | Guanine in a C3′endo/syn conformation in the Z conformation of |
| DNA | ||
| 802-5 | cm−1 | Left-handed helix DNA (Z form) |
| 805 | cm−1 | C3′endo/anti (A-form helix) conformation |
| 813 | cm−1 | Ring CH deformation |
| 829 | cm−1 | C2′ endo conformation of sugar |
| 831/3 | cm−1 | C2′ endo conformation of sugar |
| 835 | cm−1 | C2′ endo/anti (B-form helix) conformation |
| 835-40 | cm−1 | Left-handed helix DNA (Z form) |
| 860 | cm−1 | C3′ endo/anti (A-form helix) conformation |
| 868 | cm−1 | Left-handed helix DNA (Z form) |
| 878 | cm−1 | C3′ endo/anti (A-form helix) conformation |
| 889 | cm−1 | C—C, C—O deoxyribose |
| 890 | cm−1 | C3′ endo/anti (A-form helix) conformation; C2′ endo/anti (B-form |
| helix) conformation | ||
| 892 | cm−1 | C—C, C—O deoxyribose Fatty acid, saccharide (β) |
| 900-1300 | cm−1 | Phosphodiester region |
| 900-1350 | cm−1 | Phosphodiester stretching bands region (for absorbances due to |
| collagen and glycogen) | ||
| 925-9 | cm−1 | Left-handed helix DNA (Z form) |
| 938 | cm−1 | Unassigned |
| 940 | cm−1 | Carotenoid |
| 960 | cm−1 | Symmetric stretching vibration of ν1PO43− (phosphate of HA) |
| 961 | cm−1 | C—O deoxyribose, C—C |
| 963 | cm−1 | δ(C═O) (polysaccharides, pectin) |
| 963/4 | cm−1 | C—C, C—O deoxyribose |
| 964 | cm−1 | C—C and C—O in deoxyribose of DNA of tumor cells C—O |
| deoxyribose, C—C | ||
| 965 | cm−1 | C—O stretching of the phosphodiester and the ribose |
| 966 | cm−1 | C—O deoxyribose, C—C DNA |
| 970 | cm−1 | Symmetric stretching mode of dianionic phosphate monoesters of |
| phosphorylated proteins or cellular nucleic acids DNA | ||
| 971 | cm−1 | νPO4 = of nucleic acids and proteins Symmetric stretching mode |
| of dianionic phosphate monoester in phosphorylated proteins, | ||
| such as phosvitin | ||
| 972 | cm−1 | OCH3 (polysaccharides, pectin) |
| 985 | cm−1 | OCH3 (polysaccharides-cellulose) |
| 994 | cm−1 | C—O ribose, C—C |
| 995 | cm−1 | Ring breathing |
| 996 | cm−1 | C—O ribose, C—C |
| 1000-50 | cm−1 | Ring stretching vibrations mixed strongly with CH in-plane |
| bending | ||
| 1000-140 | cm−1 | Protein amide I absorption |
| 1000-150 | cm−1 | A reasonably specific area for nucleic acids in the absence of |
| glycogen | ||
| 1000-200 | cm−1 | C—OH bonds in oligosaccharides such as mannose & galactose; |
| Mainly from phosphate or oligosaccharide groups; C—O stretching | ||
| (carbohydrates) | ||
| 1000-300 | cm−1 | CH in-plane bending vibrations - The aromatic CH bending and |
| rocking |
| vibrations |
| 1000-350 | cm−1 | Region of the phosphate vibration - Carbohydrate residues |
| attached to collagen and amide III vibration (in collagen) | ||
| 1000-650 | cm−1 | Porphyrin ring of heme proteins |
| 1008 | cm−1 | CHα, α′ out-of-plane bending and Cα = Cα′ torsion |
| 1009/10/1 | cm−1 | Stretching C—O deoxyribose |
| 1011 | cm−1 | CHα, α′ out-of-plane bending and Cα = Cα′ torsion |
| 1018 | cm−1 | ν(CO), ν(CC), δ(OCH), ring (polysaccharides, pectin) |
| 1020 | cm−1 | DNA |
| 1020-50 | cm−1 | Glycogen |
| 1022 | cm−1 | Glycogen |
| 1024 | cm−1 | Glycogen (C—O stretch associated with glycogen) |
| 1025 | cm−1 | Carbohydrates peak for solutions Vibrational frequency of —CH2OH |
| groups of carbohydrates (including glucose, fructose, | ||
| glycogen, etc.); Glycogen; —CH2OH groups and the C—O | ||
| stretching vibration coupled with C—O bending of the C—OH | ||
| groups of carbohydrates (including glucose, fructose, glycogen, | ||
| etc.) | ||
| 1028 | cm−1 | Glycogen absorption due to C—O and C—C stretching and C—O—H |
| deformation motions | ||
| 1029/30 | cm−1 | O—CH3 stretching of methoxy groups |
| 1030 | cm−1 | Glycogen vibration, CH2OH vibration; νs C—O; Collagen & |
| phosphodiester groups of nucleic acids | ||
| 1030 | cm−1 | Stretching C—O ribose |
| 1030 | cm−1 | Collagen |
| 1031 | cm−1 | ν(CC) skeletal cis conformation, ν(CH2OH); ν(CO) stretching |
| coupled with C—O: Bending; Collagen; One of the triad peaks of | ||
| nucleic acids (along with 1060 and 1081) | ||
| 1032 | cm−1 | O—CH3 stretching of methoxy groups |
| 1033 | cm−1 | ν(CC) skeletal cis conformation, ν(CH2OH), ν(CO) stretching |
| coupled with C—O bending | ||
| 1034 | cm−1 | Collagen |
| 1035 | cm−1 | Skeletal trans conformation (CC) of DNA; ν(CC) skeletal cis |
| conformation, ν(CH2OH), n(CO) stretching coupled with C—O | ||
| bending; Glycogen ; ν(CO), ν(CC), ν(CCO), | ||
| (polysaccharidescellulose) | ||
| 1037 | cm−1 | ν(CC) skeletal cis conformation, ν(CH2OH), ν(CO) stretching |
| coupled with C—O bending | ||
| 1039/40 | cm−1 | Stretching C—O ribose |
| 1040-100 | cm−1 | Symmetric PO2− stretching in RNA and DNA |
| 1045 | cm−1 | Glycogen band (due to OH stretching coupled with bending); C—O |
| stretching frequencies coupled with C—O bending frequencies of | ||
| the C—OH groups of carbohydrates (including glucose, fructose, | ||
| glycogen, etc.); —CH2OH groups and the C—O stretching vibration | ||
| coupled with C—O bending of the C—OH groups of carbohydrates | ||
| (including glucose, fructose, glycogen, etc.) | ||
| 1045/545 | cm−1 | Gives an estimate carbohydrate concentrations (lower in |
| malignant cells) | ||
| 1050 | cm−1 | νs CO—O—C; C—O stretching coupled with C—O bending of the C—OH |
| of carbohydrates; Glycogen | ||
| 1050-70 | cm−1 | C—O—C stretching (nucleic acids and phospholipids) |
| 1050-80 | cm−1 | Indicates a degree of oxidative damage to DNA |
| 1050-100 | cm−1 | Phosphate & oligosaccharides; PO2− stretching modes, P—O—C |
| antisymmetric stretching mode of phosphate ester, and C—OH | ||
| stretching of oligosaccharides | ||
| 1051 | cm−1 | C—O—C stretching of DNA and RNA |
| 1052 | cm−1 | Phosphate I band for two different C—O vibrations of deoxyribose |
| in DNA in A and B forms of helix or ordering structure | ||
| 1053 | cm−1 | νC—O & δC—O of carbohydrates; Shoulder of 1121 cm−1 band, due |
| to DNA | ||
| 1055 | cm−1 | Oligosaccharide C—O bond in hydroxyl group that might interact |
| with some other membrane components; Mainly from | ||
| phospholipid phosphate and partly from oligosaccharide C—OH | ||
| bonds; Phosphate ester; PO2− stretching and C—OH stretching of | ||
| oligosaccharides; Phosphate residues; Membrane-bound | ||
| oligosaccharide C—OH bond (a part of it may originate from the | ||
| hydroxyl group of the sugar residue); ν(CO), ν(CC), δ(OCH) | ||
| (polysaccharides, pectin) | ||
| 1056/7 | cm−1 | Stretching C—O deoxyribose |
| 1059 | cm−1 | 2-Methylmannoside Oligosaccharide C—OH stretching band; |
| Mannose & mannose-6-phosphate | ||
| 1060 | cm−1 | Stretching C—O deoxyribose; One of the triad peaks of nucleic |
| acids (along with 1031 and 1081 cm−1); ν(CO), ν(CC), δ(OCH) | ||
| (polysaccharidescellulose) | ||
| 1064 | cm−1 | Stretching C—O ribose |
| 1065 | cm−1 | C—O stretching of the phosphodiester and the ribose; Nucleic |
| acids, in the absence of glycogen | ||
| 1068 | cm−1 | Stretching C—O ribose |
| 1070 | cm−1 | Mannose & mannose-6-phosphate |
| 1070-80 | cm−1 | Nucleic acid band |
| 1071 | cm−1 | Phosphate I band for two different C—O vibrations of Deoxyribose |
| in DNA in disordering structure | ||
| 1075 | cm−1 | Symmetric phosphate stretching modes or ν(PO2−) sym. |
| (phosphate stretching modes originate from the phosphodiester | ||
| groups in nucleic acids and suggest an increase in the nucleic | ||
| acids in the malignant tissues); ν(PO2−) symmetric stretching of | ||
| phosphodiesters | ||
| 1076 | cm−1 | Skeletal cis conformation (CC) of DNA |
| 1076 | cm−1 | Symmetric phosphate [PO2− (sym)] stretching |
| 1078 | cm−1 | νs PO2−; Phosphate I in RNA; Symmetric phosphate; Glycogen |
| absorption due to C—O and C—C stretching and C—O—H deformation | ||
| motions; DNA in healthy samples, in the absence of glycogen; | ||
| Indicating the role of phosphates during diseases; C—OH | ||
| stretching band of oligosaccharide residue | ||
| 1079 | cm−1 | νs PO2− |
| 1080 | cm−1 | ν PO2−; Phosphate vibration; Symmetric phosphate [PO2− (sym)] |
| stretching; Collagen & phosphodiester groups of nucleic acids | ||
| 1081 | cm−1 | Symmetric phosphate stretching modes or n(PO2−) sym. |
| (phosphate stretching modes originate from the phosphodiester | ||
| groups in nucleic acids and suggest an increase in the nucleic | ||
| acids in the malignant tissues); n(PO2−) symmetric stretching of | ||
| phosphodiesters; Phosphate I in RNA; One of the triad peaks of | ||
| nucleic acids (along with 1031 and 1060) | ||
| 1082 | cm−1 | PO2− symmetric; Phosphate band; Collagen; Symmetric phosphate |
| stretching band of the normal cells | ||
| 1083 | cm−1 | PO2− symmetric |
| 1084 | cm−1 | DNA (band due to PO2− vibrations); Symmetric phosphate [PO2− |
| (sym)] stretching; PO2− symmetric; Stretching PO2− symmetric; | ||
| Absorbance by the phosphodiester bonds of the phosphate/sugar | ||
| backbone of nucleic acids; Nucleic acid region; Nucleic acid- | ||
| phosphate band | ||
| 1084-6 | cm−1 | νs(PO2−) of nucleic acids |
| 1085 | cm−1 | PO2− symmetric (phosphate II); PO2− symmetric; Mainly from |
| absorption bands of the phosphodiester group of nucleic acids and | ||
| membrane phospholipids, and partially protein (amide III). The | ||
| band originating from sugar chains (C—OH band) overlaps. Mainly | ||
| from phospholipid phosphate and partly from oligosaccharide C—OH | ||
| bonds; Phosphate ester | ||
| 1086 | cm−1 | Symmetric phosphate stretching modes or ν(PO2−) sym. |
| (phosphate stretching modes originate from the phosphodiester | ||
| groups in nucleic acids and suggest an increase in the nucleic | ||
| acids in the malignant tissues); PO2− symmetric: ν(PO2−) | ||
| symmetric stretching of phosphodiesters | ||
| 1087 | cm−1 | PO2− symmetric (phosphate II); Symmetric stretching of |
| phosphate groups of phosphodiester linkages in DNA and RNA; | ||
| Symmetric PO2− stretching in RNA and DNA; Symmetric | ||
| stretching of phosphate groups in phospholipids | ||
| 1088-90 | cm−1 | Phosphate I (stretching PO2− symmetric vibration) in B-form DNA |
| 1089 | cm−1 | Stretching PO2− symmetric in RNA |
| 1090 | cm−1 | Mannose & mannose6-phosphate Phosphate ester (C—O—P) band |
| 1090-100 | cm−1 | Phosphate II (stretching PO2− asymmetric vibration) in A-form |
| RNA | ||
| 1094 | cm−1 | Stretching PO2− symmetric (phosphate II); nasym(C—O—C) |
| (polysaccharides-cellulose) | ||
| 1095 | cm−1 | Stretching PO2− symmetric |
| 1099/100 | cm−1 | Stretching PO2− symmetric (phosphate II) |
| 1104 | cm−1 | Symmetric stretching P—O—C |
| 1105 | cm−1 | Carbohydrates |
| 1107 | cm−1 | ν(CO), ν(CC), ring (polysaccharides, pectin) |
| 1110 | cm−1 | ν(CO), ν(CC) ring (polysaccharides, cellulose) |
| 1113/5 | cm−1 | Symmetric stretching P—O—C |
| 1117 | cm−1 | C—O stretching vibration of C—OH group of ribose (RNA) |
| 1119 | cm−1 | Symmetric stretching P—O—C |
| 1119 | cm−1 | C—O stretching mode |
| 1120 | cm−1 | Mannose-6-phosphate Phosphorylated saccharide residue |
| 1121 | cm−1 | Symmetric phosphodiester stretching band RNA; Shoulder of |
| 1121 cm−1 band, due to RNA | ||
| 1122 | cm−1 | νC—O of carbohydrates |
| 1125 | cm−1 | CH2, 6 in-plane bend and C1—Cα—Hα bend ν(CO), ν(CC) ring |
| (polysaccharides, cellulose) | ||
| 1126 | cm−1 | ν(C—O), disaccharides, sucrose; ν(C—O) + ν(C—C), disaccharides, |
| sucrose | ||
| 1137 | cm−1 | Oligosaccharide C—OH stretching band; 2-Methylmannoside |
| 1145 | cm−1 | Phosphate & oligosaccharides; Oligosaccharide C—O bond in |
| hydroxyl group that might interact with some other membrane | ||
| components; Membrane-bound oligosaccharide C—OH bond | ||
| 1150 | cm−1 | C—O stretching vibration; C—O stretching mode of the |
| carbohydrates; CH8, CH″8 deformations; n(C—O—C), ring | ||
| (polysaccharides, pectin) | ||
| 1150-200 | cm−1 | Phosphodiester stretching bands (sym. and asym.) |
| 1151 | cm−1 | Glycogen absorption due to C—O and C—C stretching and C—O—H |
| deformation motions | ||
| 1152 | cm−1 | CH8, CH8″deformations |
| 1153 | cm−1 | Stretching vibrations of hydrogen-bonding C—OH groups |
| 1155 | cm−1 | C—O stretching vibration; ν (C—C)-diagnostic for the presence of a |
| carotenoid structure, most likely a cellular pigment | ||
| 1159-74 | cm−1 | νC—O of proteins and carbohydrates |
| 1160 | cm−1 | CO stretching |
| 1161 | cm−1 | Stretching vibrations of hydrogen-bonding C—OH groups |
| 1161/2 | cm−1 | Mainly from the C—O stretching mode of C—OH groups of serine, |
| threosine, & tyrosine of proteins); ν(CC), δ(COH), ν(CO) | ||
| stretching | ||
| 1161 | cm−1 | Stretching modes of the C—OH groups of serine, threonine, and |
| tyrosine residues of cellular proteins; δ(C—O—C), ring | ||
| (polysaccharides, cellulose) | ||
| 1163 | cm−1 | CH′9, CH7, CH′7 deformations |
| 1163/4 | cm−1 | C—O stretching band of collagen (type I) |
| 1164 | cm−1 | Mainly from the C—O stretching mode of C—OH groups of serine, |
| threosine, & tyrosine of proteins); ν(CC), δ(COH), ν(CO) | ||
| stretching; C—O stretching (in normal tissue); Hydrogen-bonded | ||
| stretching mode of C—OH groups | ||
| 1170 | cm−1 | νas CO—O—C; C—O bands from glycomaterials and proteins |
| 1172 | cm−1 | Stretching vibrations of nonhydrogen-bonding C—OH groups; CO |
| stretching; CO stretching of collagen (type I); Stretching modes of | ||
| the C—OH groups of serine, threonine, and tyrosine residues of | ||
| cellular proteins | ||
| 1172/3 | cm−1 | CO stretching of the C—OH groups of serine, threosine, & tyrosine |
| in the cell proteins as well as carbohydrates | ||
| 1173 | cm−1 | C—O stretching (in malignant tissues) |
| 1173 | cm−1 | Non-hydrogen-bonded stretching mode of C—OH groups |
| 1180-300 | cm−1 | Amide III band region |
| 1185/1/2 | cm−1 | CH2 |
| 1188 | cm−1 | Deoxyribose |
| 1200 | cm−1 | Collagen; Phosphate (P═O) band |
| 1201 | cm−1 | PO2− asymmetric (phosphate I) |
| 1204 | cm−1 | Vibrational modes of collagen proteins-amide III; C—O—C, C—O |
| dominated by the ring vibrations of polysaccharides C—O—P, P—O—P; | ||
| Collagen | ||
| 1205 | cm−1 | C—O—C, C—O dominated by the ring vibrations of polysaccharides |
| C—O—P, P—O—P | ||
| 1206 | cm−1 | Amide III; Collagen |
| 1207 | cm−1 | PO2− asymmetric (phosphate I); Collagen |
| 1209 | cm−1 | PO2− asymmetric (phosphate I) |
| 1212 | cm−1 | PO2− asymmetric (phosphate I) |
| 1217 | cm−1 | PO2− asymmetric (phosphate I) |
| 1220 | cm−1 | PO2− asymmetric vibrations of nucleic acids when it is highly |
| hydrogen-bonded Asymmetric hydrogen-bonded phosphate | ||
| stretching mode | ||
| 1220-4 | cm−1 | Phosphate II (stretching PO2− asymmetric vibration) in B-form |
| DNA | ||
| 1220-40 | cm−1 | Asymmetric PO2− stretching in RNA and DNA |
| 1220-50 | cm−1 | νPO2− |
| 1220-350 | cm−1 | Amide III (C—N stretching and N—H in plane bending, often with |
| significant contributions from CH2 wagging vibrations) | ||
| 1222 | cm−1 | Phosphate stretching bands from phosphodiester groups of |
| cellular nucleic acids; CH6, 2′, α, α′ rock | ||
| 1222/3 | cm−1 | PO2− asymmetric (phosphate I) |
| 1224 | cm−1 | Collagen; Asymmetric stretching of phosphate groups of |
| phosphodiester linkages in DNA and RNA; Asymmetric PO2− | ||
| stretching in RNA and DNA; Symmetric stretching of phosphate | ||
| groups in phospholipids | ||
| 1226 | cm−1 | PO2− asymmetric (phosphate I) |
| 1230 | cm−1 | Stretching PO2− asymmetric; Overlapping of the protein amide III |
| and the nucleic acid phosphate vibration | ||
| 1235 | cm−1 | Composed of amide III as well as phosphate vibration of nucleic |
| acids; CH6, 2′, α, α′ rock | ||
| 1236 | cm−1 | Amide III and asymmetric phosphodiester stretching mode |
| (νasPO2−), mainly from the nucleic acids; νasPO2− of nucleic acids | ||
| 1236-42 | cm−1 | Relatively specific for collagen and nucleic acids |
| 1236/7 | cm−1 | Stretching PO2− asymmetric (phosphate I) |
| 1237 | cm−1 | PO2− asymmetric (phosphate I); PO2− asymmetric |
| 1238 | cm−1 | Stretching PO2− asymmetric (phosphate I); Asymmetric phosphate |
| [PO2− (asym.)] stretching modes; Stretching PO2− asymmetric; | ||
| Amide III | ||
| 1238/9 | cm−1 | Asymmetric PO2− stretching |
| 1240 | cm−1 | νasPO2−; Collagen; Asymmetric non-hydrogen-bonded phosphate |
| stretching mode (phosphate stretching modes originate from the | ||
| phosphodiester groups of nucleic acids and suggest an increase in | ||
| the nucleic acids in the malignant tissues); Mainly from | ||
| absorption bands of the phosphodiester group of nucleic acids and | ||
| membrane phospholipids, and partially protein (amide III); Amide | ||
| III; PO2− asymmetric vibrations of nucleic acids when it is non- | ||
| hydrogen-bonded νasPO2−; Collagen; Asymmetric phosphodiester | ||
| stretching band; Amide III; PO2−ionized asymmetric stretching; | ||
| ν(PO2−) asymmetric stretching of phosphodiesters; Composed of | ||
| amide III mode of collagen protein and the asymmetric stretching | ||
| mode of the phosphodiester groups of nucleic acids; Asymmetric | ||
| stretching mode of phosphodiester groups of nucleic acids; | ||
| Asymmetric PO2− stretching in RNA | ||
| 1240-45 | cm−1 | Phosphate I (stretching PO2− symmetric vibration) in A-form RNA |
| 1240-65 | cm−1 | Amide III (C—N stretching mode of proteins, indicating mainly a- |
| helix conformation) | ||
| 1240-310 | cm−1 | νC—N, amide III |
| 1241 | cm−1 | PO2− asymmetric (phosphate I); Phosphate band (phosphate |
| stretching modes originate from the phosphodiester groups of | ||
| nucleic acids and suggest an increase in the nucleic acids in the | ||
| malignant tissues; generally, the PO2− groups of phospholipids do | ||
| not contribute to these bands); Phosphate stretching bands from | ||
| phosphodiester groups of cellular nucleic acids; νas Phosphate | ||
| 1242 | cm−1 | PO2− asymmetric; Collagen I & IV; Amide III; Amide III collagen |
| 1243 | cm−1 | ν(PO2−) asymmetric stretching of phosphodiesters; Asymmetric |
| phosphate [PO2− (asym.)] stretching modes (phosphate stretching | ||
| modes originate from the phosphodiester groups of nucleic acids | ||
| and suggest an increase the nucleic acids in the malignant tissues) | ||
| (Generally, the PO2− groups of phospholipids do not contribute to | ||
| these bands); Phosphate in RNA | ||
| 1243/4 | cm−1 | Collagen (type I) |
| 1244 | cm−1 | Collagen I & IV; Asymmetric phosphate stretching (νasPO2−) |
| 1244/5 | cm−1 | PO2− asymmetric (phosphate I) |
| 1245 | cm−1 | PO2− asymmetric |
| 1246 | cm−1 | PO2− asymmetric |
| 1247 | cm−1 | PO2− asymmetric (phosphate I) |
| 1248 | cm−1 | PO2− asymmetric |
| 1250 | cm−1 | Amide III |
| 1250-400 | cm−1 | CH2 wagging vibration of the acyl chains (phospholipids) |
| 1255 | cm−1 | Amide III |
| 1256 | cm−1 | PO2− asymmetric (phosphate I) |
| 1262 | cm−1 | PO2− asymmetric (phosphate I) |
| 1265 | cm−1 | PO2− asymmetric (phosphate I); CHα′ rocking |
| 1272/3 | cm−1 | CHα′ rocking |
| 1276 | cm−1 | N—H thymine |
| 1278 | cm−1 | Vibrational modes of collagen proteins-amide III |
| 1278/9 | cm−1 | Deformation N—H |
| 1280 | cm−1 | Collagen; Amide III |
| 1282 | cm−1 | Amide III band components of proteins; Collagen |
| 1283 | cm−1 | Collagen |
| 1283-1339 | cm−1 | Collagen |
| 1284 | cm−1 | Amide III band components of proteins; Collagen |
| 1287 | cm−1 | Deformation N—H |
| 1288 | cm−1 | N—H thymine |
| 1291/2 | cm−1 | N—H thymine |
| 1294/5/6 | cm−1 | Deformation N—H cytosine |
| 1306 | cm−1 | Unassigned band |
| 1307 | cm−1 | Amide III |
| 1310 | cm−1 | Amide III |
| 1312 | cm−1 | Amide III band components of proteins |
| 1317 | cm−1 | Amide III band components of proteins; Collagen |
| 1327/8 | cm−1 | Stretching C—N thymine, adenine |
| 1328 | cm−1 | Benzene ring mixed with the CH in-plane bending from the |
| phenyl ring and the ethylene bridge | ||
| 1330 | cm−1 | CH2 wagging |
| 1335 | cm−1 | δ(CH), ring (polysaccharides, pectin) |
| 1335 | cm−1 | δ(CH), ring (polysaccharides, pectin) |
| 1336 | cm−1 | δ(CH), ring (polysaccharides, cellulose) |
| 1337 | cm−1 | Collagen |
| 1337/8 | cm−1 | CH2 wagging |
| 1339 | cm−1 | Collagen; In-plane C—O stretching vibration combined with the |
| ring stretch of phenyl | ||
| 1340 | cm−1 | CH2 wagging; Collagen |
| 1358 | cm−1 | Stretching C—O, deformation C—H, deformation N—H |
| 1367 | cm−1 | Stretching C—O, deformation C—H, deformation N—H |
| 1368 | cm−1 | δ(CH2), ν(CC) (polysaccharides, pectin) |
| 1369/70 | cm−1 | Stretching C—N cytosine, guanine |
| 1370/1 | cm−1 | Stretching C—O, deformation C—H, deformation N—H |
| 1370/1/3 | cm−1 | Deformation N—H, C—H |
| 1373 | cm−1 | Stretching C—N cytosine, guanine |
| 1380 | cm−1 | δCH3 Stretching C—O, deformation C—H, deformation N—H |
| 1390 | cm−1 | Carbon particle |
| 1395 | cm−1 | Less characteristic, due to aliphatic side groups of the amino acid |
| residues | ||
| 1396 | cm−1 | Symmetric CH3 bending of the methyl groups of proteins |
| 1398 | cm−1 | CH3 symmetric deformation |
| 1399 | cm−1 | Extremely weak peaks of DNA & RNA-arises mainly from the |
| vibrational modes of methyl and methylene groups of proteins and | ||
| lipids and amide groups; Symmetric CH3 bending modes of the | ||
| methyl groups of proteins; δ[(CH3)] sym.; δ[C(CH3)2] symmetric | ||
| 1400 | cm−1 | Symmetric stretching vibration of COO2 group of fatty acids and |
| amino acids; dsCH3 of proteins; Symmetric bending modes of | ||
| methyl groups in skeletal proteins; Specific absorption of | ||
| proteins; Symmetric stretch of methyl groups in proteins | ||
| 1400-500 | cm−1 | Ring stretching vibrations mixed strongly with CH in-plane |
| bending | ||
| 1400/1 | cm−1 | COO2 symmetric stretching of acidic amino acids aspartate and |
| glutamate | ||
| 1400/1/2 | cm−1 | CH3 symmetric deformation |
| 1401 | cm−1 | Symmetric CH3 bending modes of the methy l groups of proteins; |
| δ[(CH3)l sym.; COO2 symmetric stretching of fatty acids | ||
| 1401/2 | cm−1 | Symmetric CH3 bending modes of the methyl groups of proteins; |
| δ[(CH3)] sym.; Stretching C—N, deformation N—H, deformation C—H; | ||
| δ[C(CH3)2] symmetric | ||
| 1403 | cm−1 | Symmetric CH3 bending modes of the methyl groups of proteins; |
| δ[(CH3)] sym.; dsCH3 of collagen; δ[C(CH3)2] symmetric | ||
| 1404/5 | cm−1 | CH3 asymmetric deformation |
| 1412/4 | cm−1 | Stretching C—N, deformation N—H, deformation C—H |
| 1416 | cm−1 | Deformation C—H, N—H, stretching C—N |
| 1417 | cm−1 | Stretching C—N, deformation N—H, deformation C—H |
| 1418/9 | cm−1 | Deformation C—H |
| 1419 | cm−1 | νs(COO−) (polysaccharides, pectin) |
| 1430 | cm−1 | δ(CH2) (polysaccharides, cellulose) |
| 1444 | cm−1 | δ(CH2), lipids, fatty acids; δ(CH) (polysaccharides, pectin) |
| 1449 | cm−1 | Asymmetric CH3 bending of the methyl groups of proteins |
| 1450 | cm−1 | Methylene deformation in biomolecules; Polyethylene methylene |
| deformation modes | ||
| 1451 | cm−1 | Asymmetric CH3 bending modes of the methyl groups of |
| proteins; δ[(CH3)] asym. | ||
| 1454 | cm−1 | Asymmetric methyl deformation |
| 1455 | cm−1 | C—O—H; Less characteristic, due to aliphatic side groups of the |
| amino acid residues δasCH3 of proteins; Symmetric bending | ||
| modes of methyl groups in skeletal proteins | ||
| 1455/6 | cm−1 | Asymmetric CH3 bending modes of the methyl groups of |
| proteins; δ[(CH3)] asym. | ||
| 1456 | cm−1 | CH3 bending vibration (lipids and proteins) |
| 1457 | cm−1 | Extremely weak peaks of DNA & RNA-arises mainly from the |
| vibrational modes of methyl and methylene groups of proteins and | ||
| lipids and amide groups; Asymmetric CH3 bending modes of the | ||
| methyl groups of proteins; δ[(CH3)] asym. | ||
| 1458 | cm−1 | δasCH3 of collagen |
| 1462 | cm−1 | Paraffin |
| 1465 | cm−1 | CH2 scissoring mode of the acyl chain of lipid |
| 1467 | cm−1 | Cholesterol-methyl band |
| 1468 | cm−1 | δCH2; δCH2 of lipids; CH2 bending vibration (lipids and proteins) |
| 1469 | cm−1 | CH2 bending of the acyl chains of lipids; CH2 scissoring vibration |
| of the acyl chains (phospholipids) | ||
| 1470 | cm−1 | CH2 bending of the methylene chains in lipids |
| 1480 | cm−1 | Polyethylene methylene deformation modes |
| 1480-543 | cm−1 | Amide II |
| 1480-600 | cm−1 | The region of the amide II band in tissue proteins. Amide II |
| mainly stems from the C—N stretching and C—N—H bending | ||
| vibrations weakly coupled to the C═O stretching mode | ||
| 1482 | cm−1 | Benzene |
| 1482/3/5 | cm−1 | C8—H coupled with a ring vibration of guanine |
| 1486 | cm−1 | Deformation C—H |
| 1487/8 | cm−1 | C═C, deformation C—H |
| 1488/9 | cm−1 | Deformation C—H |
| 1489 | cm−1 | In-plane CH bending vibration |
| 1490 | cm−1 | C═C, deformation C—H; In-plane CH bending vibration |
| 1494 | cm−1 | In-plane CH bending vibration |
| 1495/6 | cm−1 | C═C, deformation C—H |
| 1500 | cm−1 | In-plane CH bending vibration from the phenyl rings; CH in-plane |
| bending | ||
| 1500-60 | cm−1 | Amide II (an N—H bending vibration coupled to C—N stretching |
| 1504 | cm−1 | In-plane CH bending vibration from the phenyl rings |
| 1510 | cm−1 | In-plane CH bending vibration from the phenyl rings; CH in-plane |
| bend | ||
| 1514 | cm−1 | ν(C═C)-diagnostic for the presence of a carotenoid structure, most |
| likely a cellular pigment | ||
| 1517 | cm−1 | Amide II |
| 1524 | cm−1 | Stretching C═N, C═C |
| 1526 | cm−1 | C═N guanine |
| 1527 | cm−1 | Stretching C═N, C═C |
| 1528 | cm−1 | C═N guanine |
| 1529/30 | cm−1 | C═N adenine, cytosine |
| 1530 | cm−1 | Stretching C═N, C═C |
| 1531 | cm−1 | Modified guanine? |
| 1532 | cm−1 | Stretching C═N, C═C |
| 1534 | cm−1 | Modified guanine; Amide II |
| 1535/7 | cm−1 | Stretching C═N, C═C |
| 1540 | cm−1 | Protein amide II absorption- predominately β-sheet of amide II; |
| Amide II | ||
| 1540-650 | cm−1 | Amide II |
| 1541 | cm−1 | Amide II absorption (primarily an N—H bending coupled to a C—N |
| stretching vibrational mode); Amide II | ||
| 1543 | cm−1 | Amide II |
| 1544 | cm−1 | Amide II bands (arises from C—N stretching & CHN bending |
| vibrations) | ||
| 1545 | cm−1 | Protein band; Amide II (dN—H, nC—N); Peptide amide II |
| 1549 | cm−1 | Amide II; Amide II of proteins |
| 1550 | cm−1 | Amide II; Amide II of proteins; N—H bending and C—N stretching |
| 1550-650 | cm−1 | Ring stretching vibrations with little interaction with CH in-plane |
| bending | ||
| 1550-800 | cm−1 | Region of the base vibrations |
| 1552 | cm−1 | Ring base |
| 1553 | cm−1 | CO stretching; Predominately a-sheet of amide II (Amide II band |
| mainly stems from the C—N stretching and C—N—H bending | ||
| vibrations weakly coupled to the C═O stretching mode) | ||
| 1555 | cm−1 | Ring base |
| 1559 | cm−1 | Ring base |
| 1567 | cm−1 | Ring base |
| 1570 | cm−1 | Amide II |
| 1571/3 | cm−1 | C═N adenine |
| 1574/5 | cm−1 | C═N adenine |
| 1576 | cm−1 | C═N adenine |
| 1577 | cm−1 | Ring C—C stretch of phenyl |
| 1581 | cm−1 | Ring C—C stretch of phenyl |
| 1589 | cm−1 | Ring C—C stretch of phenyl |
| 1592 | cm−1 | C═N, NH2 adenine |
| 1594 | cm−1 | Ring C—C stretch of phenyl |
| 1596 | cm−1 | Methylated nucleotides |
| 1597 | cm−1 | C═N, NH2 adenine |
| 1600-720 | cm−1 | The region of the amide I band of tissue proteins (highly sensitive |
| to the conformational changes in the secondary structure; amide I | ||
| band is due to in-plane stretching of the C═O bond, weakly | ||
| coupled to stretching of the C—N and in-plane bending of the N—H | ||
| bond) | ||
| 1600-800 | cm−1 | C═O stretching (lipids) |
| 1601/2 | cm−1 | C═N cytosine, N—H adenine |
| 1603/4 | cm−1 | C═N, NH2 adenine |
| 1604 | cm−1 | Adenine vibration in DNA |
| 1605 | cm−1 | νas (COO−) (polysaccharides, pectin) |
| 1606 | cm−1 | Adenine vibration in DNA |
| 1609 | cm−1 | Adenine vibration in DNA |
| 1618 | cm−1 | Ring C—C stretch of phenyl |
| 1620 | cm−1 | Peak of nucleic acids due to the base carbonyl stretching and ring |
| breathing mode | ||
| 1630-700 | cm−1 | Amide I region |
| 1632 | cm−1 | Ring C—C stretch of phenyl |
| 1632/4 | cm−1 | C═C uracyl, C═O |
| 1635 | cm−1 | β-sheet structure of amide I; Proportion of b-sheet secondary |
| structures (shoulder) | ||
| 1637 | cm−1 | C═C uracyl, C═O |
| 1638/9 | cm−1 | C═C thymine, adenine, N—H guanine |
| 1639 | cm−1 | Amide I |
| 1640 | cm−1 | Amide I band of protein and H—O—H deformation of water |
| 1642 | cm−1 | C5 methylated cytosine |
| 1643 | cm−1 | Amide I band (arises from C═O stretching vibrations) |
| 1644 | cm−1 | Amide I |
| 1646 | cm−1 | Amide I; C5 methylated cytosine; C═O, stretching C═C uracyl, |
| NH2 guanine | ||
| 1647/8 | cm−1 | Amide I in normal tissues-for cancer is in lower frequencies |
| 1649 | cm−1 | Unordered random coils and turns of amide I; C═O, C═N, N—H of |
| adenine, thymine, guanine, cytosine; O—H bending (water) | ||
| 1650 | cm−1 | Amide I absorption (predominantly the C═O stretching vibration |
| of the amide C═O); Protein amide I absorption; C═O, stretching | ||
| C═C uracyl, NH2 guanine; Peptide amide I | ||
| 1652 | cm−1 | Amide I |
| 1652/3 | cm−1 | C2═O cytosine |
| 1653/4 | cm−1 | C═O, C═N, N—H of adenine, thymine, guanine, cytosine |
| 1655 | cm−1 | Amide I (of proteins in α-helix conformation); Amide I (ν C═O, δ |
| C—N, δ N—H); C═O cytosine; C55O, C55N, N—H of adenine, | ||
| thymine, guanine, cytosine; Peak of nucleic acids due to the base | ||
| carbonyl stretching and ring breathing mode; Amide I has some | ||
| overlapping with the carbonyl stretching modes of nucleic acid; | ||
| Amide I (α-helix) | ||
| 1656 | cm−1 | Amide I; C2═O cytosine |
| 1657 | cm−1 | α-helical structure of amide I |
| 1658 | cm−1 | C═O, stretching C═C uracyl, NH2 guanine; Amide I |
| 1659 | cm−1 | Amide I |
| 1660 | cm−1 | Amide I band; ν(C═C) cis, lipids, fatty acids |
| 1664/5 | cm−1 | C═O Cytosine, uracyl |
| 1665 | cm−1 | Amide I (disordered structure-solvated) |
| 1666 | cm−1 | C═O stretching vibration of pyrimidine base |
| 1670 | cm−1 | Amide I (anti-parallel β-sheet); ν(C═C) trans, lipids, fatty acids |
| 1679 | cm−1 | Stretching C55O vibrations that are H-bonded (changes in the |
| C═O stretching vibrations could be connected with destruction of | ||
| old H-bonds and creation of the new ones); C═O guanine | ||
| deformation N—H in plane | ||
| 1680 | cm−1 | Unordered random coils and turns of amide I |
| 1681/4 | cm−1 | C═O Guanine deformation N—H in plane |
| 1684 | cm−1 | C═O Guanine deformation N—H in plane |
| 1685 | cm−1 | Amide I (disordered structure-non-hydrogen bonded) |
| 1690 | cm−1 | Peak of nucleic acids due to the base carbonyl stretching and ring |
| breathing mode | ||
| 1694 | cm−1 | A high frequency vibration of an anti-parallel β-sheet of amide I |
| (the amide I band is due to in-plane stretching of the C═O band | ||
| weakly coupled to stretching of the C—N and in-plane bending of | ||
| the N—H bond) | ||
| 1698/9 | cm−1 | C2═O guanine; N—H thymine |
| 1700-15 | cm−1 | The region of the bases |
| 1700-800 | cm−1 | Fatty acid esters |
| 1700/2 | cm−1 | C═O guanine |
| 1702 | cm−1 | C═O thymine; Stretching (C═O) vibrations that are H-bonded |
| (changes in the C═O stretching vibrations could be connected | ||
| with destruction of old H-bonds and creation of the new ones) | ||
| 1706/7 | cm−1 | C═O thymine |
| 1707 | cm−1 | C═O guanine |
| 1708 | cm−1 | C═O thymine |
| 1712/9 | cm−1 | C═O |
| 1713/4/6 | cm−1 | C═O thymine |
| 1717 | cm−1 | C═O thymine; Amide I (arises from C═O stretching vibration); |
| C═O stretching vibration of DNA and RNA; C═O stretching | ||
| vibration of purine base | ||
| 1719 | cm−1 | C═O |
| 1725-45 | cm−1 | C═O stretching band mode of the fatty acid ester |
| 1728/9 | cm−1 | C═O band |
| 1730 | cm−1 | Absorption band of fatty acid ester; Fatty acid ester band |
| 1736 | cm−1 | C═O stretching (lipids) |
| 1739 | cm−1 | ν(C═O) (polysaccharides, hemicellulose) |
| 1740 | cm−1 | C═O; C═O stretching (lipids); Ester C═O stretching vibration |
| (phospholipids) | ||
| 1743 | cm−1 | C═O stretching mode of lipids |
| 1745 | cm−1 | Ester group (C═O) vibration of triglycerides; ν(C═O) |
| (polysaccharides, pectin) | ||
| 1750 | cm−1 | ν(C═C) lipids, fatty acids |
| 1997/2040/53/58 | cm−1 | The band of second order |
| 2100 | cm−1 | A combination of hindered rotation and O—H bending (water) |
| 2600 | cm−1 | H-bonded NH vibration band |
| 2633/678 | cm−1 | Stretching N—H (NH3+) |
| 2727/731 | cm−1 | Stretching N—H (NH3+) |
| 2761 | cm−1 | CH3 modes |
| 2765/66/69/99 | cm−1 | Stretching N—H (NH3+) |
| 2800 | cm−1 | Stretching N—H (NH3+) |
| 2800-3000 | cm−1 | C—H: Lipid region; CH3, CH2-lipid and protein |
| 2800-3100 | cm−1 | C—H stretching vibrations of methyl (CH3) & methylene (CH2) |
| groups & olefins | ||
| 2800-3500 | cm−1 | Cholesterol, phospholipids and creatine (higher in normal tissues); |
| Stretching vibrations of CH2 & CH3 of phospholipids, cholesterol | ||
| and creatine | ||
| 2802/12/20/21/4/34 | cm−1 | Stretching N—H (NH3+) |
| 2834 | cm−1 | Symmetric stretching of methoxy |
| 2836 | cm−1 | Stretching N—H (NH3+) |
| 2838 | cm−1 | Stretching C—H; Symmetric stretching of methoxy |
| 2846 | cm−1 | Symmetric stretching of methoxy |
| 2848 | cm−1 | Cholesterol, phospholipids, and creatine (higher in normal |
| tissues); Stretching vibrations of CH2 & CH3 of phospholipids, | ||
| cholesterol, and creatine | ||
| 2849 | cm−1 | Stretching C—H |
| 2850 | cm−1 | C—H stretching bands; Stretching C—H; νs CH2, lipids, fatty acids; |
| CH2 symmetric | ||
| 2851 | cm−1 | Symmetric CH2 stretch |
| 2852 | cm−1 | νs CH2; Symmetric stretching vibration of CH2 of acyl chains |
| (lipids) | ||
| 2853 | cm−1 | νs CH2 of lipids; Asymmetric CH2 stretching mode of the |
| methylene chains in membrane lipids | ||
| 2860 | cm−1 | Stretching C—H |
| 2874 | cm−1 | νs CH3; Stretching C—H, N—H; Symmetric stretching vibration of |
| CH3 of acyl chains (lipids) | ||
| 2884/85 | cm−1 | Stretching C—H |
| 2886/7/8/9/90 | cm−1 | Stretching C—H |
| 2893/4/6 | cm−1 | CH3 symmetric stretch |
| 2916 | cm−1 | Cholesterol, phospholipids and creatine (higher in normal tissues); |
| Stretching vibrations of CH2 & CH3 of phospholipids, cholesterol | ||
| and creatine | ||
| 2917/8/9 | cm−1 | Stretching C—H |
| 2922 | cm−1 | Asymmetric stretching vibration of CH2 of acyl chains (lipids) |
| 2923-33 | cm−1 | C—H stretching bands in malignant tissues |
| 2923/5 | cm−1 | Stretching C—H |
| 2925 | cm−1 | C—H stretching bands in normal tissues; νas CH2 lipids |
| 2928 | cm−1 | Stretching C—H |
| 2930 | cm−1 | C—H stretching bands; νas CH2 |
| 2947/8 | cm−1 | Stretching C—H |
| 2951 | cm−1 | Stretching C—H |
| 2952 | cm−1 | CH3 asymmetric stretch |
| 2951/3/5/6 | cm−1 | Stretching C—H |
| 2956 | cm−1 | Asymmetric stretching vibration of CH3 of acyl chains (lipids) |
| 2959 | cm−1 | C—H stretching; νas CH3 of lipids, DNA, and proteins; |
| Asymmetric stretching mode of the methyl groups from cellular | ||
| proteins, nucleic acids and lipids | ||
| 2960 | cm−1 | νas CH3 |
| 2963 | cm−1 | CH3 modes |
| 2965 | cm−1 | Stretching C—H |
| 2970 | cm−1 | νas CH3, lipids, fatty acids |
| 2975 | cm−1 | Stretching N—H, stretching C—H |
| 2984 | cm−1 | CHα, α′ stretch |
| 2993/4 | cm−1 | C—H ring |
| 2994 | cm−1 | CHα, α′ stretch |
| 2998/9 | cm−1 | C—H ring |
| 3000 | cm−1 | C—H ring; CH stretching vibrations (remain unaltered by the |
| methoxy and hydroxyl substitution) | ||
| 3000-600 | cm−1 | N—H stretching |
| 3000-700 | cm−1 | O—H stretching (water) |
| 3007 | cm−1 | C—H |
| 3007-10 | cm−1 | ═C—H groups that are related to olefins bands or unsaturated fatty |
| acids (absent in cancer samples) | ||
| 3008 | cm−1 | C—H ring; νas (═C—H), lipids, fatty acids |
| 3015 | cm−1 | ν ═CH of lipids |
| 3015/17/20 | cm−1 | CH2′ aromatic stretch |
| 3021/2 | cm−1 | C—H ring |
| 3050 | cm−1 | Amid B (N—H stretching) |
| 3064 | cm−1 | C2 aromatic stretching |
| 3070 | cm−1 | Fermi-enhanced overtone of the amide II band (at 1550 cm−1) |
| 3072/4 | cm−1 | C—H ring |
| 3074 | cm−1 | CH stretching band of the phenyl rings; C2—CH2 aromatic |
| stretching | ||
| 3075 | cm−1 | Amide B bands steming from N—H stretching modes in proteins |
| and nucleic acids | ||
| 3078 | cm−1 | C—H ring |
| 3111/4/6 | cm−1 | C—H ring |
| 3163/82 | cm−1 | Stretching N—H symmetric |
| 3190 | cm−1 | N—H stretching bands of mainly cis-ordered substructures |
| 3194/5/7/9/200 | cm−1 | Stretching N—H symmetric |
| 3200-550 | cm−1 | Symmetric and asymmetric vibrations attributed to water. So it |
| would be better not to consider this region for detailed analysis | ||
| 3201 | cm−1 | Stretching N—H symmetric |
| 3216/17/26 | cm−1 | Stretching O—H symmetric |
| 3273/87/89 | cm−1 | Stretching O—H symmetric |
| 3293 | cm−1 | OH stretching (associated) |
| 3295 | cm−1 | Amid A (N—H stretching) |
| 3300 | cm−1 | Amide A bands steming from N—H stretching modes in proteins |
| and nucleic acids | ||
| 3301 | cm−1 | Amide A band |
| 3313 | cm−1 | Amide A band |
| 3320 | cm−1 | NH band |
| 3327 | cm−1 | Stretching N—H asymmetric |
| 3328 | cm−1 | Amide A band |
| 3330/5/7/9/43 | cm−1 | Stretching N—H asymmetric |
| 3350 | cm−1 | O—H, N—H, C—H |
| 3353 | cm−1 | Stretching N—H asymmetric |
| 3354 | cm−1 | O—H, N—H, C—H |
| 3359 | cm−1 | Stretching N—H asymmetric O—H, N—H, C—H |
| 3362 | cm−1 | O—H, N—H, C—H |
| 3396 | cm−1 | Stretching O—H asymmetric |
| 3401 | cm−1 | O—H & N—H stretching vibrations (hydrogen bonding network |
| may vary in the malignant tissues) | ||
| 3410/16/20/22 | cm−1 | Stretching O—H asymmetric |
| 3430 | cm−1 | N—H stretching bands of mainly trans-ordered substructures |
| 3435/442 | cm−1 | Stretching O—H asymmetric |
| 3500-600 | cm−1 | OH bonds |
| 3506 | cm−1 | OH stretching (free) |
| 3524/28/42 | cm−1 | Stretching O—H |
| 3561 | cm−1 | OH stretching (free) |
| 3570/77/78/82/90/9 | cm−1 | Stretching O—H |
| 3611 | cm−1 | O—H & N—H stretching vibrations (hydrogen bonding network |
| may vary in the malignant tissues) | ||
The term “internal reflection element” or IRE refers to a crystal, prism, or other structure that will admit incoming radiation and reflect the radiation at least once from a surface on the interior of the element, preferably following interaction of the radiation with a sample in contact with the reflecting surface. Following such a reflectance, the radiation can be re-reflected or emitted from the element. Preferably the IRE comprises a germanium crystal, a zinc selenide crystal, or other material with higher index of refraction than the refractive index of the sample being read that are capable of transmitting IR or visible light.
The term “multi-pass ATR” refers to an attenuated total reflectance technique in which radiation that is incident on an internal reflectance element having two or more reflection faces within the IRE experiences two or more interactions with a reflection face before exiting the IRE. At these interfaces, the light is totally reflected back into the IRE material. Such interactions are typically referred to as “bounces” or “passes”. Application of multi-pass ATR generates a multi-pass ATR spectrum. Typically, the IRE is in contact with a sample, the incident radiation is IR radiation and the exiting radiation subsequently interacts with a detector.
The term “single-pass ATR” refers to an attenuated total reflectance technique in which radiation incident on an internal reflectance element (IRE) having one or more reflection faces within the IRE experiences only one interaction with a reflection face before exiting the IRE. At this interface, the light is totally reflected back into the IRE material. Application of single-pass ATR generates a single-pass ATR spectrum.
The term “reflecting surface” refers to a surface capable of reflecting incident radiation. On the IR surface where the sample is deposited, the incident light is at an angle greater than the critical angle and hence experiences total internal reflection. There is no transmission of light at this interface, but rather an evanescent wave that escapes out of the surface of the IRE but is coupled back into the IRE material. Indeed, the technique of attenuated total internal reflection (ATR) is based on the principle that an evanescent wave interacts with a sample that is within one fifth of one wavelength of the dielectric boundary.
Attenuated total reflection (ATR) spectroscopy is predicated on the concept that, when light traveling within a medium impinges upon an interface between that medium and a medium of lower refractive index, it either passes into the second medium or is totally internally reflected, depending on whether the quantity [n1/n2 sin θi] is less than or greater than one. In this relationship, n1 and n2 are the refractive indices of the first and second media, respectively, and θi is the angle of incidence. If n1/n2 sin θi is greater than one, total internal reflection occurs. Although the internal reflection is referred to as total, the light, during the reflection process, penetrates a short distance into the second medium. The depth of penetration depends in a predictable fashion on the refractive indices of the two media and the angle of incidence, and is typically on the order of tenths of the wavelength of the light. If the incident light includes a wavelength absorbed by a constituent of the second medium, light of such wavelength will be partially absorbed or attenuated during reflection due to the penetration of the light into the second medium. This effect is referred to as attenuated total reflection. Due to the very shallow penetration of the light into the second medium, ATR is a useful technique for measuring absorbance by strongly absorbing materials. ATR has also been particularly useful for measuring absorbance of material deposited on a surface. Attenuated total reflection spectroscopy is widely used to collect an absorption spectrum from samples that are too opaque for direct absorption measurements.
In practice, one surface of an internal reflecting element (IRE) is placed in contact with a test sample. An incident beam of radiation is directed through the IRE so that it is totally internally reflected at the boundary between the IRE and the test sample. Some of the energy of the incident radiation is absorbed by the test sample through evanescent coupling. The amount of absorption is representative of the molecular structure and/or the molecular species found in the test sample. The reflected radiation, therefore, includes information from which an absorption spectrum for the test sample can be acquired. IREs utilizing total internal reflection or attenuated total reflection principles are commonly found in optical systems designed to analyze samples by assessing the optical constants of the sample and by establishing the physical and chemical composition thereof. Examples of IREs disposed in various optical systems are shown, for example, in U.S. Pat. Nos. 4,602,869 and 3,393,603. In some embodiments, the IRE is a germanium crystal or a zinc selenide crystal. The angle of incidence is defined as the angle between the ray direction and the normal to the surface. A 45-degree angle of incidence is often convenient for a multi-pass FTIR-ATR element. However, the angle of incidence and the composition of an element can be varied to optimize the parameters for a given experiment.
Mathematical and statistical operations that are performed in the course of practicing the present methods can be performed using any suitable computational equipment and software. For example, a commercially available personal computer can be used as a platform for software that can facilitate the acquisition of data, the calculation of difference spectra and perform spectral and other analysis. Computers networked with an FTIR instrument can be employed to acquire data on one machine and process it on another. Suitable data acquisition and management software packages can be designed and written de novo or can be purchased. Suitable commercially available software packages can include SCANTRAQ BASIC™ software package available from FTG Software Associates of Princeton, N.J., and GRAMS/32™ Version 5.2 software package, available from ThermoGalactic of Salem, N.H.
In some embodiments, the process of acquiring a spectrum of a sample is automated. Suitable commercially available software packages for automated spectrum acquisition include the WINFIRST™ package available from Thermo Mattson of Madison, Wis., and the AUTOPRO™ software package available from Pike Technologies, Inc. of Madison, Wis. These software packages can be employed to automate spectrum acquisition and can be useful for analyzing large numbers of samples. In some embodiments, the process is fully automated and can comprise an autosampler to inject and remove samples and a spectrum acquisition software package to run an FTIR microscope or FTIR bench accessory. Additionally, the identified software packages can be modified, or software can be written or purchased, to perform the various mathematical and statistical operations that can be performed when acquiring data by employing the present inventive methods. For example, software can be provided and employed to analyze an acquired spectrum, whereby the water component is automatically subtracted from the spectrum and the quality and quantity of secondary structure is subsequently identified using algorithms referred to, incorporated and disclosed herein. In this embodiment, a researcher can simply prepare the autosampler, configure the software and begin the process.
The term “cell” as used herein also refers to individual cells, cell lines, primary culture, or cultures derived from such cells unless specifically indicated. A “culture” refers to a composition comprising isolated cells of the same or a different type. A cell line is a culture of a particular type of cell that can be reproduced indefinitely, thus making the cell line “immortal.” A cell culture can be a population of cells grown on a medium such as agar. A primary cell culture is a culture from a cell or taken directly from a living organism, which is not immortalized.
The term “cellular interaction” refers here to extracellular and intracellular interactions (e.g., between molecules on the surface of contacting cells, for example, receptor:ligand and m antibody:antigen interactions or internal molecules within signaling pathways associated with defenses). The molecules used to perturb cell biosensors can therefore be non-cell-associated molecules, such as extracellular antibodies and ligands that are interacting with other molecules on or within the cell, such as receptors or antigens. The molecules can also be endogenous molecules that are interacting on or within the cell as part of a signal cascade (e.g., triggered by an extracellular event).
The term “biological sample” refers to a tissue (e.g., tissue biopsy), organ, cell (including a cell maintained in culture), cell lysate (or lysate fraction), biomolecule derived from a cell or cellular material (e.g. a polypeptide or nucleic acid), or body fluid from a subject. Non-limiting examples of body fluids include blood, urine, plasma, serum, tears, lymph, bile, cerebrospinal fluid, interstitial fluid, aqueous or vitreous humor, colostrum, sputum, amniotic fluid, saliva, anal and vaginal secretions, perspiration, semen, transudate, exudate, and synovial fluid.
The term “environmental sample” refers to any sample taken from the environment for purposes of detecting cell activating agents in the sample. For example, the environmental sample can be a water sample, e.g., taken from an aquifer, stream, lake, or river. The environmental sample can also be a food sample. The environmental sample can also be from a solid surface, e.g., using a swab or other collection means.
A number of embodiments of the invention have been described. Nevertheless, it will be understood that various modifications may be made without departing from the spirit and scope of the invention. Accordingly, other embodiments are within the scope of the following claims.
EXAMPLES
Example 1
Early Detection of CD3-Mediated T-Cell Activation by ATR-FTIR Spectroscopy
The application of Infrared Spectroscopy to measure and identify cellular responses has numerous benefits (Erukhimovitch, V., et al., in DNA Viruses (Springer, 2005), pp. 161-172; Hastings, G., et al., Analyst (2009) 134(7):1462-1471; Lee-Montiel, F. T., et al., Journal of biological engineering (2011) 5:16). Cells in culture mount stimulus-specific responses that are induced by receptor:ligand interactions. As disclosed herein, one can use ATR-FTIR to identify specific cellular signals that define ligands, e.g., antibodies, pathogens, allergens, capable of interacting with cell surface receptors, thus exploiting the cell as a sensor. This provides a read-out that, in turn, can be used to identify specific cellular interactions. In its simplest form, direct observation of responses such as cytopathic changes induced by virus infections has been used historically to screen for viruses in cell culture. Confirmatory assays for specific pathogen identification depend on complex molecular methods and the use of biological and chemical probes depending on the signals to be detected. These assays are generally elaborate, and require specific reagents and complex methods usually requiring a range of three hours (Erukhimovitch, V., et al., Analyst (2011) 136(13):2818-2824) to weeks where there is sufficient material for detection, or up to months when there is not. Measurement of cellular responses to stimuli is also very useful for the identification of normal immune responses or, alternatively, disease or infection states. Cellular responses engage immediately after a cell detects a foreign agent, a stimulant, an antibody, or a pathogen. ATR-FTIR, which greatly reduces background noise, is more sensitive to the events occurring on the cell membrane compared to transmission FTIR since the interrogating light penetrates only about 2 microns into the cell suspension rather than the entire thickness of the cell suspension spot as in transmission FTIR. The ATR-FTIR configuration also produces better resolution of spectral features. This is confirmed by the features seen in FIG. 1 Inset b, where more details with better signal-to-noise ratio are visible in the ATR-FTIR absorbance curve compared to the FTIR absorbance curve. The use of Fourier Transform Infrared Spectroscopy (FTIR) is reported, employing the Attenuated Total
Reflectance (ATR) technique to detect early activation events in Jurkat T-cells after the binding of their cell surface CD3-receptors by a specific antibody (anti-CD3) at 75 minutes post stimulation. One can identify, using this rapid and non-intrusive method, the spectral patterns of cells undergoing activation events and show them to be distinct from their control counterparts under the same conditions. This method will also allow the interrogation of the cells at time points as early as five minutes post stimulation.
ATR-FTIR Spectroscopy
When electromagnetic radiation passes through a material, photons with certain frequencies of light are absorbed while the rest are transmitted. These absorbed frequencies of light correspond to the vibrational frequencies of atomic and molecular bonds. Thus FTIR spectroscopy is able to identify the chemical composition of specific materials. FTIR spectroscopy is employed to detect changes in materials that are exposed to specific reagents. ATR is a particular configuration where light is totally internally reflected inside a prism of high refractive index (FIG. 1 Inset a). The prism material used in the following experiments was Zinc Selenide (ZnSe) crystal. Some photons penetrate out of the surface of the crystal, and then are coupled back in. This evanescent wave can interact with any material on the surface of the crystal and thus the intensities of the frequencies of light measured after passing through the prism are highly sensitive to the materials present on the surface of the crystal. Five microliter aliquots of cell suspension (625,000 cells) were spotted on ZnSe ATR crystal and allowed to air dry. The samples were scanned in the mid-infrared range (1500 to 800 cm−1). The ATR configuration allowed for light to penetrate an average depth of 2 microns into the cell suspension at the given frequency range. The penetration depth, however, is a function of the incident wavelength.
The ATR absorption spectra initially revealing the peaks characteristic of the interrogated medium are shown in FIG. 1. As the water evaporated (—15 minutes), the cells settled to the surface of the crystal and peaks representative of the biological material composition of the cells such as proteins, DNA, and phospholipids in addition to that of the medium were captured.
Sample Preparation
Jurkat T-cells were chosen as model biosensors to be interrogated using the ATR-FTIR spectroscopic technique. The Clone E6-1 cells (ATCC #TIB-152) were grown in log-phase in R-10 growth medium (RPMI-1640, (Mediatech Manassas, VA); supplemented with 10% FBS, 100 Uml penicillin, and 100 μg/ml streptomycin). Cells were counted and checked for viability by the trypan blue exclusion method and only cells with >95% viability was accepted as sensors. The cells were then aliquoted into about a million cells each in sterile capped 1.5 ml vials, and centrifuged at room temperature for four minutes at 800 g. The growth medium was then completely removed and replaced with 100 μl of either fresh R-10, a matched isotype control antibody, or with R-10 supplemented with 100 ng/ml anti-CD3 antibody (Mabtech, Nacka Strand, Sweden). The cells were gently mixed and incubated in a humidified chamber at 37° C. in 5% CO2 for 75 minutes with the vial lids loosened to allow for gas exchange. At the end of the incubation, the contents of two vials with the same treatment conditions were then pooled together (two million cells per vial). Ice-cold unsupplemented RPMI-1640 medium (1 ml) was added to each vial, which was then centrifuged at 800 g for four minutes at room temperature. The supernatant was removed and the pellet washed a second time with one ml of ice-cold unsupplemented RPMI-1640 medium after which the supernatant was removed completely. The pellet of two million cells was re-suspended in 16 μl of cold, fresh, unsupplemented RPMI-1640 medium, placed on ice and transported to the neighboring FTIR facility to be read using the Bruker Vertex 70 FTIR spectrometer. Jurkat cells without the anti-CD3 antibody treatment or with an equivalent amount of isotype antibody were used as negative controls. A five microliter drop (˜625,000 cells) was spotted onto the ZnSe crystal and allowed to air dry.
Post Processing of Data
Spectral data were collected in the range of 1500 to 800 cm−1 for the activated and unactivated (control) cells. Some moisture absorption lines from the background were corrected. In later experiments, the water noise was further reduced by employing an ATR with dry air purging capability. A five point moving average was performed and the spectrum was vector normalized where the average of all the absorbance values of the spectrum was subtracted from the entire spectrum. This reduced the mid-spectrum to zero. Then the sum of the squares of all the absorbance values was calculated and the spectrum divided by the square root of this sum.
Analysis and Results
The vector normalized ATR spectra reveal some marked differences between the activated and unactivated cell sensors (FIG. 2). The activated state of the experimentally treated cells and the unactivated state of the control cells have been validated by data from parallel flow cytometry experiments monitoring the cells for 24 hours post treatment for the presence of cell surface expression of the activation marker CD69 as measured by a BD LSRFortessa (BD BioSciences, San Jose, Calif.). Five repeat spectra for each set were collected and each spectrum was an average of 50 separate scans. Specific frequencies at which the absorbance varied between the activated and the unactivated cells were identified. Four spectral frequencies namely, 1358, 1367, 1335 and 1250 cm31 1 were selected and the differences between the absorbances at these identified frequencies were considered as the differentiating markers. A two-tailed paired student's t-test was performed by using the absorbance values at the chosen markers and was followed by post-hoc Bonferroni corrections for multiple comparisons with false discovery rate analysis. A confidence interval of 95% was chosen as a test of significance. Of the four spectral markers (Table 2), the differences at 1358 cm−1 and 1367 cm−1 efficiently distinguished the activated from the unactivated cells at 75 minutes after cell incubation with anti-CD3 antibody in eleven independent experiments with p-values of 0.02. The markers at 1335 cm−1 and 1250 cm−1 have p values of 0.028 and 0.038 respectively.
| TABLE 2 |
| Paired t-tests on selected spectral bands, corrected for |
| multiple comparisons with false discovery rate analysis. |
| Post-hoc | ||||
| Wavenumber | Paired t-test | Bonferroni | Statistically | |
| Comparisons | (cm−1) | Significance | Correction | Significant? |
| 1 | 1358 | 0.020 | 0.050 | Yes |
| 2 | 1367 | 0.020 | 0.025 | Yes |
| 3 | 1335 | 0.028 | 0.017 | No |
| 4 | 1250 | 0.038 | 0.013 | No |
Discussion and Conclusion
ATR-FTIR spectroscopic tool has been successfully used for the first time to rapidly detect Jurkat cells early activation events mediated by exposure of cells to antibody specific to the CD3 T cell co-receptor. Cells were interrogated 75 minutes post exposure and the ratios of specific absorbance values of the cells were calculated and used to differentiate treatment groups. These experiments have validated that the treatment conditions mediate T-cell activation determined by CD69 cell surface expression. Ligation of the T-cell receptor, which occurs by treatment of the cells with anti-CD3, activates T cells by modulating specific molecular events including the assembly of specific activation complexes that initiate after the recruitment of ZAP-70 to the cytoplasmic domain of ligated CD3. Ultimately, correlation of the spectral changes with activation of signaling events induced by specific agents may enhance understanding of the relationship between spectral changes and recruitment of specific molecular interactions.
Example 2
Detection of Cell Activation by ATR-FTIR Spectroscopy at 15 Minutes Post Exposure
Jurkat T-cells were exposed to both anti-CD3 and anti-CD28 which is a well-accepted method of activating Jurkat cells to proliferate and produce specific cytokines. The activated T-cells were interrogated by ATR-FTIR at 15 min and 75 min post exposure to the activating agent. The control sample for the experiment was T-cells exposed to a non-specific IgG isotype of the antibodies used. ATR-FTIR spectra showed marked differences in the 1200-1500 cm−1 region between activated and unactivated t-cell samples at 15 and 75 min post exposure (FIG. 4). The isotype control was ratified by plotting 5 reads of the isotype at 15 and 75 min with nearly identical spectra. Detection of activation at 15 min post exposure has been successfully observed in three independent experiments. More repeats are underway on which statistical analysis will be performed.
FIG. 3 is an ATR spectra of isotypes (impotent activating agents that have the same chemical composition as that of the activating agents) read at 15 and 75 min. Note that there are 5 reads plotted for each sample to show the reproducibility.
FIG. 4 is an ATR spectra showing a difference at 1200-1500 cm−1 range between activated and unactivated samples at 15 and 75 min time points.
FIG. 5 is an ATR spectra showing a difference at 1300-1375 cm−1 range between activated and unactivated samples at 15 and 75 min.
Unless defined otherwise, all technical and scientific terms used herein have the same meanings as commonly understood by one of skill in the art to which the disclosed invention belongs. Publications cited herein and the materials for which they are cited are specifically incorporated by reference.
Those skilled in the art will recognize, or be able to ascertain using no more than routine experimentation, many equivalents to the specific embodiments of the invention described herein. Such equivalents are intended to be encompassed by the following claims.
Claims
1. A method for detecting a cellular response resulting from a defined treatment or exposure, comprising
(a) depositing a sample comprising a plurality of cells under reaction conditions on an internal reflection element (IRE);
(b) directing a beam of infrared (IR) radiation through the IRE under conditions such that the IR radiation interacts with the plurality of cells;
(c) recording an absorption spectrum over a range of preselected frequencies; and
(d) comparing the absorption spectrum to a control spectrum;
wherein a change in absorbance at one or more frequencies compared to the control spectrum is an indication of a cellular interaction in the plurality of cells.
2. The method of claim 1, wherein the reaction conditions comprise contacting the homogeneous population of cells with a sample comprising one or more potential pathogens or allergens.
3. The method of claim 2, wherein the potential pathogen is a virus, bacteria, or yeast.
4. The method of claim 1, wherein the reaction conditions comprise contacting the plurality of cells with a sample comprising one or more potential ligands.
5. The method of claim 4, wherein the potential ligand is selected from the group consisting of antibodies, growth factors, cytokines, chemokines, hormones, extracellular matrix proteins, and cell-surface proteins.
6. The method of claim 4, wherein the potential ligand is selected from the group consisting of proteins, peptides, peptide nucleic acids, and small molecules.
7. The method of claim 1, wherein the reaction conditions comprise a change in temperature, pH, salinity, or any combination thereof.
8. The method of claim 1, wherein the cellular interaction is detected within 15 minutes to 75 minutes.
9. The method of claim 1, wherein the plurality of cells comprise bacterial or yeast cells
10. The method of claim 1, wherein the homogeneous population of cells comprise mammalian cells.
11. The method of claim 1, wherein the homogeneous population of cells comprise a transformed cell line.
12. The method of claim 1, wherein the range of preselected frequencies is between 50 cm−1 and 3700 cm−1.
13. The method of claim 12, wherein the range of preselected frequencies is between 800 cm−1 and 1500 cm−1.
14. The method of claim 1, wherein the IRE is an attenuated total reflectance (ATR) crystal comprising an optical material with a higher refractive index than the sample comprising the homogeneous population of cells.
15. The method of claim 14, wherein the IRE comprises a germanium crystal or a zinc selenide crystal.
16. The method of claim 1, wherein the IR radiation that interacts with the plurality of cells is an evanescent wave with an average penetration depth of about 2 μm.
17. The method of claim 1, further comprising Fourier transformation of the absorbance spectrum.
18. The method of claim 1, wherein the cellular interaction is detected within 15 minutes to 75 minutes.
19. A method for using cells as a biosensor, comprising:
(e) exposing a homogeneous population of cells with a sample;
(f) depositing the homogeneous population of cells on an internal reflection element (IRE);
(g) directing a beam of infrared (IR) radiation through the IRE under conditions such that the IR radiation interacts with the plurality of cells;
(h) recording an absorption spectrum over a range of preselected frequencies; and
(i) comparing the absorption spectrum to a control spectrum;
wherein a change in absorbance at one or more frequencies compared to the control spectrum is an indication of a cell activating agent in the sample.
20-33. (canceled)
34. A system for detecting a cell activating agent in a sample, comprising:
(j) a Fourier transform infrared spectrometer configured with an internal reflection element (IRE) for attenuated total reflectance (ATR); and
(k) a homogeneous population of cells selected to react with the cell activating agent.
35-41. (canceled)
Images & Drawings included:
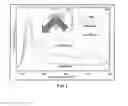
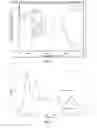
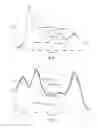
Sources:
- United States Patent and Trademark Office - verify current appl. status at the USPTO↗
Recent applications in this class:
- » 20250231106 2025-07-17
MULTI-CANCER DETECTION - » 20250164395 2025-05-22
SLIM ATR SENSOR WITH A MEASURING AND REFERENCE SIGNAL - » 20250110051 2025-04-03
ANALYSIS OF MIXED VOLATILE COMPOUNDS - » 20250085221 2025-03-13
IMPROVEMENTS IN OR RELATING TO A DEVICE FOR IMAGING - » 20250067668 2025-02-27
APPARATUS AND METHOD FOR MEASURING A SAMPLE - » 20250020588 2025-01-16
MEASUREMENT APPARATUS AND MEASUREMENT METHOD - » 20250003874 2025-01-02
MEASUREMENT METHOD AND SUBSTRATE PROCESSING APPARATUS - » 20240361240 2024-10-31
EVANESCENT FIELD RESONANCE IMAGING MICROSCOPY APPARATUS AND METHOD - » 20240175813 2024-05-30
SPECTRUM ANALYSIS SYSTEM AND SPECTRUM ANALYSIS METHOD - » 20240142374 2024-05-02
Gas Flow Chamber Device and Method of ATR Infrared Spectroscopy for Monitoring Chemical Reactions in Controlled Environments
Recent applications for this Assignee:
- » 20250011292 2025-01-09
NOVEL RHODANINE DERIVATIVES AND USES THEREOF - » 20240391886 2024-11-28
CARBON MONOXIDE PRODRUGS FOR THE TREATMENT OF MEDICAL DISORDERS - » 20240041967 2024-02-08
COMPOSITIONS AND METHODS RELATED TO RHAMNUS PRINOIDES (GESHO) EXTRACT FOR THE INHIBITION OF POLYMICROBIAL BIOFILM FORMATION - » 20230143415 2023-05-11
Treatment of aneurysms - » 20230105108 2023-04-06
COMPOUNDS FOR THE TREATMENT OF BACTERIAL INFECTIONS AND POTENTIATION OF ANTIBIOTICS - » 20220275016 2022-09-01
Compounds and methods for synthesizing sphingosines and glycolipids - » 20220219135 2022-07-14
Composite materials and methods of making and use thereof - » 20220184200 2022-06-16
VIRUS-LIKE PARTICLES AND USES THEREOF - » 20220118082 2022-04-21
Compositions and methods for generating an immune response to hepatitis B virus - » 20220096441 2022-03-31
TREATMENT OF ACANTHAMOEBA OR BALAMUTHIA TROPHOZOITES AND/OR CYSTS