Methods and materials for identifying malignant skin lesions
US20190338372A1
2019-11-07
16/518,783
2019-07-22
✅ Patent granted
US 11,840,735 B2
2023-12-12
-
-
Jeanine A Goldberg
TraskBritt
2039-07-22
Abstract:
This document provides methods and materials for identifying malignant skin lesions (e.g., malignant pigmented skin lesions). For example, methods and materials for using quantitative PCR results and correction protocols to reduce the impact of basal keratinocyte contamination on the analysis of test sample results to identify malignant skin lesions are provided.
Inventors:
- Alexander MEVES 10 🇺🇸 Rochester, MN, United States
- Ekaterina M. NIKOLOVA 4 🇺🇸 Rochester, MN, United States
Assignee:
- MAYO FOUNDATION FOR MEDICAL EDUCATION AND RESEARCH 1,899 🇺🇸 Rochester, MN, United States
Applicant:
Interested in similar patents?
Get notified when new applications in this technology area are published.
Classification:
C12Q2600/112 » CPC further
Oligonucleotides characterized by their use Disease subtyping, staging or classification
C12Q2600/16 » CPC further
Oligonucleotides characterized by their use Primer sets for multiplex assays
C12Q1/6886 » CPC main
Measuring or testing processes involving enzymes, nucleic acids or microorganisms ; Compositions therefor; Processes of preparing such compositions involving nucleic acids; Nucleic acid products used in the analysis of nucleic acids, e.g. primers or probes for diseases caused by alterations of genetic material for cancer
C07H21/04 IPC
Compounds containing two or more mononucleotide units having separate phosphate or polyphosphate groups linked by saccharide radicals of nucleoside groups, e.g. nucleic acids with deoxyribosyl as saccharide radical
C12Q1/68 IPC
Measuring or testing processes involving enzymes, nucleic acids or microorganisms ; Compositions therefor; Processes of preparing such compositions involving nucleic acids
C12Q2600/158 » CPC further
Oligonucleotides characterized by their use Expression markers
Description
CROSS-REFERENCE TO RELATED APPLICATIONS
This application is a continuation of U.S. patent application Ser. No. 14/442,673, filed May 13, 2015, pending, which is a National Stage application under 35 U.S.C. § 371 of International Patent Application PCT/US2013/053982, having an International filing date of Aug. 7, 2013, designating the United States of America and published in English as International Patent Publication WO 2014/077915 A1 on May 22, 2014, which claims the benefit under Article 8 of the Patent Cooperation Treaty to U.S. Provisional Patent Application Ser. No. 61/726,217, filed Nov. 14, 2012, the disclosure of each of which is hereby incorporated herein in its entirety by this reference.
STATEMENT ACCORDING TO 37 C.F.R. § 1.821(c) or (e)—REQUEST TO TRANSFER COMPUTER-READABLE FORM OF SEQUENCE LISTING FROM PARENT APPLICATION
Pursuant to 37 C.F.R. § 1.821(c) or (e), the transmittal documents of this application include a Request to Transfer Computer-Readable Form of the Sequence Listing from the parent application, the contents of the Sequence Listing are incorporated herein by this reference.
TECHNICAL FIELD
This document relates to methods and materials for identifying malignant skin lesions (e.g., malignant pigmented skin lesions). For example, this document relates to methods and materials for using quantitative PCR results and correction protocols to reduce the impact of basal keratinocyte contamination on the analysis of test sample results to identify malignant skin lesions.
BACKGROUND
Malignant skin lesions are typically identified by obtaining a skin biopsy and morphologically assessing the biopsy's melanocytes under a microscope. Such a procedure can be difficult to standardize and can lead to overcalling of melanomas.
Once a diagnosis of melanoma is made by morphological assessment, the risk of metastasis is typically determined by the invasion depth of malignant cells into the skin (i.e., the Breslow depth). The Breslow depth can dictate further work-up such as a need for an invasive sentinel lymph node (SLN) procedure. Such procedures, however, can lead to inaccurate determinations of the true malignant potential of a pigmented lesion.
BRIEF SUMMARY
Provided are methods and materials for identifying malignant skin lesions (e.g., malignant pigmented skin lesions). For example, this document provides methods and materials for using quantitative PCR results and correction protocols to reduce the impact of basal keratinocyte contamination on the analysis of test sample results to identify malignant skin lesions.
As described herein, quantitative PCR can be performed using a routine skin biopsy sample (e.g., a paraffin-embedded tissue biopsy) to obtain expression data (e.g., gene copy numbers) for one or more marker genes. Correction protocols can be used to reduce the impact of basal keratinocyte contamination on the analysis of the expression data from the test sample. For example, the contribution of gene expression from basal keratinocytes present within the test skin sample can be determined and removed from the overall gene expression values to determine the final gene expression value for a particular gene as expressed from cells other than basal keratinocytes (e.g., melanocytes). An assessment of the final gene expression values, which include minimal, if any, contribution from basal keratinocytes, for a collection of marker genes can be used to determine the benign or malignant biological behavior of the tested skin lesion.
In general, one aspect hereof features a method for identifying a malignant skin lesion. The method comprises, or consists essentially of, (a) determining, within a test sample, the expression level of a marker gene selected from the group consisting of PLAT, SPP1, TNC, ITGB3, COL4A1, CD44, CSK, THBS1, CTGF, VCAN, FARP1, GDF15, ITGB1, PTK2, PLOD3, ITGA3, IL8, and CXCL1 to obtain a measured expression level of the marker gene for the test sample, (b) determining, within the test sample, the expression level of a keratinocyte marker gene to obtain a measured expression level of the keratinocyte marker gene for the test sample, (c) removing, from the measured expression level of the marker gene for the test sample, a level of expression attributable to keratinocytes present in the test sample using the measured expression level of the keratinocyte marker gene for the test sample and a keratinocyte correction factor to obtain a corrected value of marker gene expression for the test sample, and (d) identifying the test sample as containing a malignant skin lesion based, at least in part, on the corrected value of marker gene expression for the test sample. The keratinocyte marker gene can be K14. The marker gene can be SPP1. The step (c) can comprise (i) multiplying the measured expression level of the keratinocyte marker gene for the test sample by the keratinocyte correction factor to obtain a correction value and (ii) subtracting the correction value from the measured expression level of the marker gene for the test sample to obtain the corrected value of marker gene expression for the test sample.
Unless otherwise defined, all technical and scientific terms used herein have the same meaning as commonly understood by one of ordinary skill in the art to which this invention pertains. Although methods and materials similar or equivalent to those described herein can be used in the practice or testing of the present invention, suitable methods and materials are described below. All publications, patent applications, patents, and other references mentioned herein are incorporated by reference in their entirety. In case of conflict, the present specification, including definitions, will control. In addition, the materials, methods, and examples are illustrative only and not intended to be limiting.
BRIEF DESCRIPTION OF THE DRAWINGS
FIG. 1 is a flow chart of an exemplary process for determining the gene expression value, which includes minimal, if any, contribution from basal keratinocytes, for a marker gene by cells within a tested sample (e.g., a tested skin biopsy sample).
FIG. 2 is a flow chart of an exemplary process for determining a keratinocyte correction factor for a marker gene of interest.
FIG. 3 is a flow chart of an exemplary process for removing copy number contamination from basal keratinocytes from a copy number value for a marker gene to determine the gene expression value, which includes minimal, if any, contribution from basal keratinocytes, for that marker gene by cells within a tested sample (e.g., a tested skin biopsy sample).
FIG. 4 is a diagram of an example of a generic computer device and a generic mobile computer device that can be used as described herein.
FIG. 5 is a flow chart of an exemplary process for using FN1 and SPP1 expression levels to determine the benign or malignant nature of a skin lesion.
FIG. 6 is a flow chart of an exemplary process for using FN1 and ITGB3 expression levels to determine the benign or malignant nature of a skin lesion.
FIG. 7 is a network diagram.
DETAILED DESCRIPTION
This document provides methods and materials for identifying malignant skin lesions (e.g., malignant pigmented skin lesions). For example, this document provides methods and materials for using quantitative PCR results and correction protocols to reduce the impact of basal keratinocyte contamination on the analysis of test sample results to identify malignant skin lesions.
FIG. 1 shows an exemplary process 100 for determining a gene expression value, which includes minimal, if any, contribution from basal keratinocytes, for a marker gene by cells within a tested sample (e.g., a tested skin biopsy sample). The process begins at box 102, where quantitative PCR using a collection of primer sets and a test sample is used to obtain a Ct value for the target of each primer set. Each gene of interest can be assessed using a single primer set or multiple different primer sets (e.g., two, three, four, five, six, seven, or more different primer sets). In some cases, quantitative PCR is performed using each primer set and control nucleic acid of the target of each primer set (e.g., linearized cDNA fragments) to obtain a standard curve for each primer set as set forth in box 104. In some cases, quantitative PCR is performed using each primer set and a known sample as an internal control (e.g., a stock biological sample) to obtain an internal control value for each primer set as set forth in box 106. This internal control can be used to set values for each primer set across different assays. In some cases, the quantitative PCR performed according to boxes 102, 104, and 106 can be performed in parallel. For example, the quantitative PCR performed according to boxes 102, 104, and 106 can be performed in a single 96 well format.
At box 108, the quality of the obtained standard curves can be confirmed. In some cases, a gene of interest included in the assay format can be a melanocyte marker (e.g., levels of MLANA and/or MITF expression) to confirm the presence of melanocytes in the test sample. Other examples of melanocyte markers that can be used as described herein include, without limitation, TYR, TYRP1, DCT, PMEL, OCA2, MLPH, and MC1R.
At box 110, the raw copy number of each target present in the test sample is determined using the Ct values and the standard curve for each target. In some cases, the averaged, corrected copy number for each gene is calculated using the raw copy number of each target of a particular gene and the internal control value for each primer set (box 112). This averaged, corrected copy number value for each gene can be normalized to a set number of one or more housekeeping genes as set forth in box 114. For example, each averaged, corrected copy number value for each gene can be normalized to 100,000 copies of the combination of ACTB, RPL8, RPLP0, and B2M. Other examples of housekeeping genes that can be used as described herein include, without limitation, RRN18S, GAPD, PGK1, PPIA, RPL13A, YWHAZ, SDHA, TFRC, ALAS1, GUSB, HMBS, HPRT1, TBP, and TUPP. Once normalized, the copy number values for each gene can be referred to as the averaged, corrected, normalized copy number for that gene as present in the test sample.
At box 116, the averaged, corrected, normalized copy number for each gene can be adjusted to remove the copy number contamination from basal keratinocytes present in the test sample. In general, copy number contamination from basal keratinocytes can be removed by (a) determining a keratinocyte correction factor for the gene of interest using one or more keratinocyte markers (e.g., keratin 14 (K14)) and one or more normal skin samples (e.g., FFPE-embedded normal skin samples), (b) determining the averaged, corrected, normalized copy number value for the one or more keratinocyte markers of the test sample and multiplying that value by the keratinocyte correction factor to obtain a correction value for the gene of interest, and (c) subtracting that correction value from the averaged, corrected, normalized copy number value of the gene of interest to obtain the final copy number for the gene of interest. Examples of keratinocyte markers that can be used as described herein include, without limitation, KRT5, KRT1, KRT10, KRT17, ITGB4, ITGA6, PLEC, DST, and COL17A1.
With reference to FIG. 2, process 200 can be used to obtain a keratinocyte correction factor for a gene of interest. At box 202, the averaged, corrected, normalized copy number for one or more genes of interest (e.g., Gene X) and one or more basal keratinocyte marker genes (e.g., K14) are determined using one or more normal skin samples and procedures similar to those described in FIG. 1. As box 204, the keratinocyte correction factor for each gene of interest (e.g., Gene X) is determined by dividing the averaged, corrected, normalized copy number for each gene of interest present in a normal skin sample by the averaged, corrected, normalized copy number of a basal keratinocyte marker gene present in a normal skin sample. Examples of keratinocyte correction factors for particular genes of interest are set forth in Table E under column “AVG per copy K14.”
With reference to FIG. 3, once a keratinocyte correction factor in determined for a particular gene of interest (e.g., Gene X), then the averaged, corrected, normalized copy number for the basal keratinocyte marker gene present in the test sample can be multiplied by the keratinocyte correction factor for the gene of interest (e.g., Gene X) to obtain a correction value for the gene of interest (e.g., Gene X). See, e.g., box 302. At box 304, the correction value for the gene of interest (e.g., Gene X) is subtracted from the averaged, corrected, normalized copy number for the gene of interest (e.g., Gene X) present in the test sample to obtain a final copy number value of the gene of interest (e.g., Gene X) present in the test sample.
FIG. 4 is a diagram of an example of a generic computer device 1400 and a generic mobile computer device 1450, which may be used with the techniques described herein. Computing device 1400 is intended to represent various forms of digital computers, such as laptops, desktops, workstations, personal digital assistants, servers, blade servers, mainframes, and other appropriate computers. Computing device 1450 is intended to represent various forms of mobile devices, such as personal digital assistants, cellular telephones, smart phones, and other similar computing devices. The components shown here, their connections and relationships, and their functions, are meant to be exemplary only, and are not meant to limit implementations of the inventions described and/or claimed in this document.
Computing device 1400 includes a processor 1402, memory 1404, a storage device 1406, a high-speed interface 1408 connecting to memory 1404 and high-speed expansion ports 1410, and a low speed interface 1415 connecting to low speed bus 1414 and storage device 1406. Each of the components 1402, 1404, 1406, 1408, 1410, and 1415, are interconnected using various busses, and may be mounted on a common motherboard or in other manners as appropriate. The processor 1402 can process instructions for execution within the computing device 1400, including instructions stored in the memory 1404 or on the storage device 1406 to display graphical information for a GUI on an external input/output device, such as display 1416 coupled to high speed interface 1408. In other implementations, multiple processors and/or multiple buses may be used, as appropriate, along with multiple memories and types of memory. Also, multiple computing devices 1400 may be connected, with each device providing portions of the necessary operations (e.g., as a server bank, a group of blade servers, or a multi-processor system).
The memory 1404 stores information within the computing device 1400. In one implementation, the memory 1404 is a volatile memory unit or units. In another implementation, the memory 1404 is a non-volatile memory unit or units. The memory 1404 may also be another form of computer-readable medium, such as a magnetic or optical disk.
The storage device 1406 is capable of providing mass storage for the computing device 1400. In one implementation, the storage device 1406 may be or contain a computer-readable medium, such as a floppy disk device, a hard disk device, an optical disk device, or a tape device, a flash memory or other similar solid state memory device, or an array of devices, including devices in a storage area network or other configurations. A computer program product can be tangibly embodied in an information carrier. The computer program product may also contain instructions that, when executed, perform one or more methods, such as those described herein. The information carrier is a computer- or machine-readable medium, such as the memory 1404, the storage device 1406, memory on processor 1402, or a propagated signal.
The high speed controller 1408 manages bandwidth-intensive operations for the computing device 1400, while the low speed controller 1415 manages lower bandwidth-intensive operations. Such allocation of functions is exemplary only. In one implementation, the high-speed controller 1408 is coupled to memory 1404, display 1416 (e.g., through a graphics processor or accelerator), and to high-speed expansion ports 1410, which may accept various expansion cards (not shown). In the implementation, low-speed controller 1415 is coupled to storage device 1406 and low-speed expansion port 1414. The low-speed expansion port, which may include various communication ports (e.g., USB, Bluetooth, Ethernet, or wireless Ethernet) may be coupled to one or more input/output devices, such as a keyboard, a pointing device, a scanner, an optical reader, a fluorescent signal detector, or a networking device such as a switch or router, e.g., through a network adapter.
The computing device 1400 may be implemented in a number of different forms, as shown in FIG. 4. For example, it may be implemented as a standard server 1420, or multiple times in a group of such servers. It may also be implemented as part of a rack server system 1424. In addition, it may be implemented in a personal computer such as a laptop computer 1422. In some cases, components from computing device 1400 may be combined with other components in a mobile device (not shown), such as device 1450. Each of such devices may contain one or more of computing device 1400, 1450, and an entire system may be made up of multiple computing devices 1400, 1450 communicating with each other.
Computing device 1450 includes a processor 1452, memory 1464, an input/output device such as a display 1454, a communication interface 1466, and a transceiver 1468, among other components (e.g., a scanner, an optical reader, a fluorescent signal detector). The device 1450 may also be provided with a storage device, such as a microdrive or other device, to provide additional storage. Each of the components 1450, 1452, 1464, 1454, 1466, and 1468, are interconnected using various buses, and several of the components may be mounted on a common motherboard or in other manners as appropriate.
The processor 1452 can execute instructions within the computing device 1450, including instructions stored in the memory 1464. The processor may be implemented as a chipset of chips that include separate and multiple analog and digital processors. The processor may provide, for example, for coordination of the other components of the device 1450, such as control of user interfaces, applications run by device 1450, and wireless communication by device 1450.
Processor 1452 may communicate with a user through control interface 1458 and display interface 1456 coupled to a display 1454. The display 1454 may be, for example, a TFT LCD (Thin-Film-Transistor Liquid Crystal Display) or an OLED (Organic Light Emitting Diode) display, or other appropriate display technology. The display interface 1456 may comprise appropriate circuitry for driving the display 1454 to present graphical and other information to a user. The control interface 1458 may receive commands from a user and convert them for submission to the processor 1452. In addition, an external interface 1462 may be provide in communication with processor 1452, so as to enable near area communication of device 1450 with other devices. External interface 1462 may provide, for example, for wired communication in some implementations, or for wireless communication in other implementations, and multiple interfaces may also be used.
The memory 1464 stores information within the computing device 1450. The memory 1464 can be implemented as one or more of a computer-readable medium or media, a volatile memory unit or units, or a non-volatile memory unit or units. Expansion memory 1474 may also be provided and connected to device 1450 through expansion interface 1472, which may include, for example, a SIMM (Single In Line Memory Module) card interface. Such expansion memory 1474 may provide extra storage space for device 1450, or may also store applications or other information for device 1450. For example, expansion memory 1474 may include instructions to carry out or supplement the processes described herein, and may include secure information also. Thus, for example, expansion memory 1474 may be provide as a security module for device 1450, and may be programmed with instructions that permit secure use of device 1450. In addition, secure applications may be provided via the SIMM cards, along with additional information, such as placing identifying information on the SIMM card in a non-hackable manner.
The memory may include, for example, flash memory and/or NVRAM memory, as discussed below. In one implementation, a computer program product is tangibly embodied in an information carrier. The computer program product contains instructions that, when executed, perform one or more methods, such as those described herein. The information carrier is a computer- or machine-readable medium, such as the memory 1464, expansion memory 1474, memory on processor 1452, or a propagated signal that may be received, for example, over transceiver 1468 or external interface 1462.
Device 1450 may communicate wirelessly through communication interface 1466, which may include digital signal processing circuitry where necessary. Communication interface 1466 may provide for communications under various modes or protocols, such as GSM voice calls, SMS, EMS, or MMS messaging, CDMA, TDMA, PDC, WCDMA, CDMA2000, or GPRS, among others. Such communication may occur, for example, through radio-frequency transceiver 1468. In addition, short-range communication may occur, such as using a Bluetooth, WiFi, or other such transceiver (not shown). In addition, GPS (Global Positioning System) receiver module 1470 may provide additional navigation- and location-related wireless data to device 1450, which may be used as appropriate by applications running on device 1450.
Device 1450 may also communicate audibly using audio codec 1460, which may receive spoken information from a user and convert it to usable digital information. Audio codec 1460 may likewise generate audible sound for a user, such as through a speaker, e.g., in a handset of device 1450. Such sound may include sound from voice telephone calls, may include recorded sound (e.g., voice messages, music files, etc.) and may also include sound generated by applications operating on device 1450.
The computing device 1450 may be implemented in a number of different forms, as shown in FIG. 4. For example, it may be implemented as a cellular telephone 1480. It may also be implemented as part of a smartphone 1482, personal digital assistant, or other similar mobile device.
Various implementations of the systems and techniques described herein can be realized in digital electronic circuitry, integrated circuitry, specially designed ASICs (application specific integrated circuits), computer hardware, firmware, software, and/or combinations thereof. These various implementations can include implementation in one or more computer programs that are executable and/or interpretable on a programmable system including at least one programmable processor, which may be special or general purpose, coupled to receive data and instructions from, and to transmit data and instructions to, a storage system, at least one input device, and at least one output device.
These computer programs (also known as programs, software, software applications or code) include machine instructions for a programmable processor, and can be implemented in a high-level procedural and/or object-oriented programming language, and/or in assembly/machine language. As used herein, the terms “machine-readable medium” and “computer-readable medium” refer to any computer program product, apparatus and/or device (e.g., magnetic discs, optical disks, memory, and Programmable Logic Devices (PLDs)) used to provide machine instructions and/or data to a programmable processor, including a machine-readable medium that receives machine instructions as a machine-readable signal. The term “machine-readable signal” refers to any signal used to provide machine instructions and/or data to a programmable processor.
To provide for interaction with a user, the systems and techniques described herein can be implemented on a computer having a display device (e.g., a CRT (cathode ray tube) or LCD (liquid crystal display) monitor) for displaying information to the user and a keyboard and a pointing device (e.g., a mouse or a trackball) by which the user can provide input to the computer. Other kinds of devices can be used to provide for interaction with a user as well; for example, feedback provided to the user can be any form of sensory feedback (e.g., visual feedback, auditory feedback, or tactile feedback); and input from the user can be received in any form, including acoustic, speech, or tactile input.
The systems and techniques described herein can be implemented in a computing system that includes a back end component (e.g., as a data server), or that includes a middleware component (e.g., an application server), or that includes a front end component (e.g., a client computer having a graphical user interface or a Web browser through which a user can interact with an implementation of the systems and techniques described herein), or any combination of such back end, middleware, or front end components. The components of the system can be interconnected by any form or medium of digital data communication (e.g., a communication network).
Examples of communication networks include a local area network (“LAN”), a wide area network (“WAN”), and the Internet.
The computing system can include clients and servers. A client and server are generally remote from each other and typically interact through a communication network. The relationship of client and server arises by virtue of computer programs running on the respective computers and having a client-server relationship to each other.
The invention will be further described in the following examples, which do not limit the scope of the invention described in the claims.
EXAMPLES
Example 1—Marker Genes that Discriminate Between Benign and Malignant Tissue
Marker genes were ordered by their ability to differentiate benign from malignant tissue (Table A). This was based on the analysis of 73 benign and 53 malignant tissues, and the hypothesis that changes in expression of fibronectin-associated gene networks are indicative of malignant cell behavior. Values of the test statistic were for the Wilcoxon rank sum test. The values of the test statistic for a Winsorized two-sample test (trimmed outliers were replaced with actual values) and for the chi-square test for the zero vs. >zero versions of each variable were included. The top 5 discriminatory genes based on each statistical test were highlighted in bold.
| TABLE A | |
| Test statistic value |
| Wilcoxon rank | Winsorized two- | ||
| gene | sum test | sample t-test | Chi- square test |
| FN1 | −10.2312 | −8.04081 | 106.714 |
| SPP1 | −9.0279 | −4.9374 | 86.774 |
| COL4A1 | −8.8807 | −7.27171 | 83.711 |
| TNC | −8.7511 | −8.31049 | 75.549 |
| ITGA3 | −8.6008 | −5.86334 | 79.788 |
| LOXL3 | −8.1978 | −6.75327 | 75.144 |
| AGRN | −8.1243 | −7.91238 | 62.611 |
| VCAN | −8.0812 | −6.24088 | 67.388 |
| PLOD3 | −8.0384 | −6.89248 | 62.691 |
| ITGB1 | −8.0021 | −7.38143 | 59.973 |
| PTK2 | −7.5279 | −7.19889 | 54.446 |
| CTGF | −7.4997 | −5.581 | 57.79 |
| PLOD1 | −7.332 | −7.36126 | 44.87 |
| LAMC1 | −7.2425 | −6.1057 | 54.233 |
| THBS1 | −7.2425 | −5.60331 | 54.233 |
| LOXL2 | −7.2241 | −6.33208 | 55.909 |
| IL6 | −7.1777 | −6.41883 | 56.966 |
| LOXL1 | −7.1279 | −6.34431 | 52.878 |
| IL8 | −7.1194 | −5.76042 | 57.296 |
| CYR61 | −6.741 | −6.97388 | 43.866 |
| ITGAV | −6.5947 | −6.27571 | 47.021 |
| YAP | −6.4848 | −6.36431 | 42.417 |
| BGN | −6.3419 | −6.01066 | 25.387 |
| LAMB1 | −6.3293 | −5.68826 | 37.061 |
| ITGB3 | −6.3142 | −5.13158 | 40.835 |
| CXCL1 | −6.1077 | −5.66564 | 40.137 |
| THBS2 | −6.0427 | −5.02003 | 37.413 |
| COL18A1 | −6.0379 | −4.9125 | 41.339 |
| SPARC | −6.0272 | −6.39324 | 38.098 |
| TP53 | −6.0182 | −6.18554 | 34.945 |
| PLOD2 | −5.9082 | −3.50272 | 47.576 |
| CCL2 | −5.8844 | −5.38758 | 30.69 |
| FBLN2 | −5.5848 | −4.59826 | 31.913 |
| LAMA1 | −5.4876 | −4.2817 | 31.071 |
| THBS4 | −5.3971 | −3.88786 | 35.27 |
| COL1A1 | −5.325 | −4.37617 | 34.693 |
| ITGA5 | −4.9847 | −3.56695 | 25.243 |
| TAZ | −4.036 | −3.26011 | 18.313 |
| POSTN | −3.8054 | −2.78378 | 19.813 |
| LOX | −3.728 | −2.8677 | 17.157 |
| CSRC | −3.7078 | −3.71759 | 13.983 |
| LAMA3 | −3.5805 | −2.99652 | 13.391 |
| CDKN1A | −3.5766 | −3.20447 | 17.228 |
| CDKN2A | −3.5491 | −2.90903 | 15.938 |
| ITGA2 | −3.4083 | −2.72495 | 11.766 |
| LAMC2 | −3.4083 | −2.53784 | 11.766 |
| PCOLCE2 | −3.3469 | −3.53676 | 14.449 |
| LOXL4 | −3.2079 | −2.76128 | 10.943 |
| PCOLCE | −2.2172 | −1.13805 | 7.993 |
| LAMB3 | −1.2822 | 0.89459 | 7.028 |
| CSF2 | 2.175 | 1.93095 | 4.522 |
Example 2—Marker Panel Revision after Statistical Analysis
The candidate gene list from Example 1 was modified to include other FN1 network genes as well as four housekeeping genes (ACTB, RPLP0, RPL8, and B2M), two keratinocyte markers (K10 and K14) to assess keratinocyte contamination, and four melanocyte markers (MITF, TYR, MLANA and PMEL) to assess melanocyte content in the skin sections. Genes from Example 1 with low discriminatory value and a more distant neighborhood to FN1 were excluded from the test setup (LAMC1, LOXL2, CYR61, YAP, BGN, LAMB1, THBS2, COL18A1, SPARC, TP53, PLOD2, CCL2, FBLN2, LAMA1, THBS4, COL1A1, TAZ, POSTN, LOX, CSRC, LAMA3, CDKN1A, CDKN2A, LAMC2, PCOLCE2, LOXL4, PCOLCE, LAMB3, and CSF2). Instead, the discriminatory ability of other FN1 network genes was determined (PLAT, CSK, GDF15, FARP1, ARPC1B, NES, NTRK3, SNX17, L1CAM, and CD44). The following results were based on the analysis of 26 benign nevi and 52 primary cutaneous melanomas with documented subsequent metastasis or skin lesions of melanoma metastasis (Table B). The top 5 genes were highlighted.
| TABLE B | |
| Test Statistic value |
| Wilcoxon | Winsorized | ||
| gene | rank sum test | two-sample t-test | Chi-square test |
| COL4A1 | −5.85975 | −5.42545 | 46.3273 |
| FN1 | −5.50862 | −3.63639 | 35.1951 |
| PLAT | −4.82670 | −3.13568 | 25.7234 |
| IL8 | −4.61443 | −4.41668 | 28.6000 |
| SPP1 | −4.60153 | −3.08137 | 23.0816 |
| PLOD3 | −4.37001 | −3.91553 | 18.8036 |
| TNC | −4.26431 | −3.14128 | 19.5000 |
| CXCL1 | −4.24452 | −3.76681 | 20.6471 |
| CSK | −4.15178 | −2.96444 | 18.3962 |
| GDF15 | −4.01364 | −2.99752 | 13.7083 |
| ITGB3 | −3.92608 | −2.80068 | 16.3091 |
| CCL2 | −3.61870 | −3.45423 | 17.5176 |
| VCAN | −3.46906 | −2.26781 | 12.5593 |
| ITGB1 | −3.40897 | −3.63399 | 5.0221 |
| PLOD1 | −3.40380 | −3.20309 | 9.2625 |
| CTGF | −3.11725 | −2.20507 | 10.0645 |
| THBS1 | −3.11721 | −2.01257 | 10.0645 |
| ITGA3 | −3.04915 | −2.65398 | 7.5341 |
| FARP1 | −2.99724 | −2.28024 | 9.2857 |
| AGRN | −2.92104 | −3.30679 | 1.8838 |
| IL6 | −2.85960 | −3.05600 | 10.6257 |
| LOXL3 | −2.84999 | −2.70498 | 5.1096 |
| LOXL1 | −2.69957 | −2.11477 | 8.1250 |
| ARPC1B | −2.57571 | −2.82320 | All but 1 value > 0 |
| NES | −2.45264 | −2.70056 | 2.4375 |
| PTK2 | −2.22328 | −2.26180 | 4.4057 |
| ITGA2 | −2.08353 | −1.50078 | 4.4571 |
| ITGA5 | −1.93478 | −1.39663 | 3.8451 |
| ITGAV | −1.29341 | −0.81964 | 3.5615 |
| NTRK3 | −1.22485 | 75 of the 78 values are = 0 |
| MITF | 0.58305 | 0.73916 | 0.4274 |
| SNX17 | 0.74754 | 0.90733 | 0.0785 |
| L1CAM | 1.61125 | 0.27151 | 2.1081 |
| MLANA | 2.96258 | 2.92548 | All values > 0 |
| CD44 | 5.23089 | 7.17590 | All but 1 value > 0 |
Based on the results of Example 1 and above, FN1 was identified as a component of the melanoma phenotype that is at the core of a gene network that discriminates between benign and malignant melanocytic skin lesions (FIG. 7). The modeling was based on the STRING 9.0 database (string-db.org).
The list of all 71 genes tested is provided in Table 1.
| TABLE 1 |
| List of genes used to discriminate benign skin tissue lesions from |
| malignant skin tissue lesions. |
| Gene Name | GenBank ® Accession No. | GenBank ® GI No. |
| FN1 | NM_212482 | 47132556 |
| NM_002026 | 47132558 | |
| NM_212474 | 47132548 | |
| NM_212476 | 47132552 | |
| NM_212478 | 47132554 | |
| NM_054034 | 47132546 | |
| SPP1 | NM_001040058 | 91206461 |
| NM_001040060 | 91598938 | |
| NM_000582 | 38146097 | |
| COL4A1 | NM_001845 | 148536824 |
| TNC | NM_002160 | 340745336 |
| ITGA3 | NM_005501 | 171846264 |
| NM_002204 | 171846266 | |
| LOXL3 | NM_032603 | 22095373 |
| AGRN | NM_198576 | 344179122 |
| VCAN | NM_004385 | 255918074 |
| NM_001164098 | 255918078 | |
| NM_001164097 | 255918076 | |
| PLOD3 | NM_001084 | 62739167 |
| ITGB1 | NM_002211 | 182519230 |
| NM_133376 | 182507162 | |
| NM_033668 | 182507160 | |
| PTK2 | NM_001199649 | 313851043 |
| NM_005607 | 313851042 | |
| NM_153831 | 313851041 | |
| CTGF | NM_001901 | 98986335 |
| PLOD1 | NM_000302 | 324710986 |
| LAMC1 | NM_002293 | 145309325 |
| THBS1 | NM_003246 | 40317625 |
| LOXL2 | NM_002318 | 67782347 |
| IL6 | NM_000600 | 224831235 |
| LOXL1 | NM_005576 | 67782345 |
| IL8 | NM_000584 | 324073503 |
| CYR61 | NM_001554 | 197313774 |
| ITGAV | NM_001144999 | 223468594 |
| NM_001145000 | 223468596 | |
| NM_002210 | 223468593 | |
| YAP | NM_001130145 | 303523503 |
| NM_001195045 | 303523626 | |
| NM_006106 | 303523510 | |
| NM_001195044 | 303523609 | |
| BGN | NM_001711 | 268607602 |
| LAMB1 | NM_002291 | 167614503 |
| ITGB3 | NM_000212 | 47078291 |
| CXCL1 | NM_001511 | 373432598 |
| THBS2 | NM_003247 | 40317627 |
| COL18A1 | NM_030582 | 110611234 |
| NM_130445 | 110611232 | |
| SPARC | NM_003118 | 365777426 |
| TP53 | NM_000546 | 371502114 |
| NM_001126112 | 371502115 | |
| NM_001126114 | 371502117 | |
| NM_001126113 | 371502116 | |
| PLOD2 | NM_182943 | 62739164 |
| NM_000935 | 62739165 | |
| CCL2 | NM_002982 | 56119169 |
| FBLN2 | NM_001998 | 51873054 |
| NM_001004019 | 51873052 | |
| NM_001165035 | 259013546 | |
| LAMA1 | NM_005559 | 329112585 |
| THBS4 | NM_003248 | 291167798 |
| COL1A1 | NM_000088 | 110349771 |
| ITGA5 | NM_002205 | 56237028 |
| TAZ | NM_000116 | 195232764 |
| NM_181311 | 195232766 | |
| NM_181312 | 195232765 | |
| NM_181313 | 195232767 | |
| POSTN | NM_001135934 | 209862910 |
| NM_006475 | 209862906 | |
| NM_001135935 | 209863010 | |
| LOX | NM_001178102 | 296010939 |
| NM_002317 | 296010938 | |
| CSRC | NM_005417 | 38202215 |
| NM_198291 | 38202216 | |
| LAMA3 | NM_198129 | 38045909 |
| NM_001127717 | 189217424 | |
| CDKN1A | NM_000389 | 310832422 |
| NM_001220777 | 334085239 | |
| NM_078467 | 310832423 | |
| NM_001220778 | 334085241 | |
| CDKN2A | NM_000077 | 300863097 |
| NM_058195 | 300863095 | |
| NM_001195132 | 304376271 | |
| ITGA2 | NM_002203 | 116295257 |
| LAMC2 | NM_005562 | 157419137 |
| NM_018891 | 157419139 | |
| PCOLCE2 | NM_013363 | 296317252 |
| LOXL4 | NM_032211 | 67782348 |
| PCOLCE | NM_002593 | 157653328 |
| LAMB3 | NM_000228 | 62868214 |
| NM_001017402 | 62868216 | |
| NM_001127641 | 189083718 | |
| CSF2 | NM_000758 | 371502128 |
| ACTB | NM_001101 | 168480144 |
| RPLP0 | NM_053275 | 49087137 |
| NM_001002 | 49087144 | |
| RPL8 | NM_000973 | 72377361 |
| NM_033301 | 15431305 | |
| B2M | NM_004048 | 37704380 |
| K10 | NM_000421 | 195972865 |
| K14 | NM_000526 | 197313720 |
| MITF | NM_198158 | 296841082 |
| NM_198177 | 296841080 | |
| NM_006722 | 296841079 | |
| NM_198159 | 296841078 | |
| NM_000248 | 296841081 | |
| NM_001184967 | 296841084 | |
| NM_198178 | 296923803 | |
| TYR | NM_000372 | 113722118 |
| MLANA | NM_005511 | 5031912 |
| PMEL | NM_001200054 | 318037594 |
| NM_001200053 | 318037592 | |
| NM_006928 | 318068057 | |
| NES | NM_006617 | 38176299 |
| L1CAM | NM_024003 | 221316758 |
| NM_001143963 | 221316759 | |
| NM_000425 | 221316755 | |
| GDF15 | NM_004864 | 153792494 |
| ARPC1B | NM_005720 | 325197176 |
| FARP1 | NM_005766 | 48928036 |
| NM_001001715 | 159032536 | |
| NTRK3 | NM_001007156 | 340745351 |
| NM_001012338 | 340745349 | |
| NM_001243101 | 340745352 | |
| NM_002530 | 340745350 | |
| CSK | NM_001127190 | 187475372 |
| NM_004383 | 187475371 | |
| CD44 | NM_001001391 | 48255940 |
| NM_001001392 | 48255942 | |
| NM_001202556 | 321400139 | |
| NM_001001389 | 48255936 | |
| NM_000610 | 48255934 | |
| NM_001001390 | 48255938 | |
| NM_001202555 | 321400137 | |
| NM_001202557 | 321400141 | |
| SNX17 | NM_014748 | 388596703 |
| PLAT | NM_000930 | 132626665 |
| NM_033011 | 132626641 | |
Gene expression of target genes was assessed by SYBR/EVA-Green based RT-PCR. All tested genes were accompanied by a standard curve for quantification of absolute copy number per a defined number of housekeeping genes. mRNA extraction from paraffin-embedded biospecimen was performed using an extraction protocol (Qiagen RNA FFPE extraction kit) and an extraction robot (Qiacube from Qiagen). mRNA was transcribed into cDNA using a commercially available kit (iScript kit from BioRad), and Fluidigm technology was used for PCR cycling.
The primer design was performed using web-based open access software. The primers were HPLC purified to minimize background and were optimized for formalin-fixed, paraffin-embedded (FFPE) tissue (i.e., highly degraded tissue). The primers were designed to detect a maximum number of gene transcripts and were designed to be cDNA specific (i.e., not affected by genomic DNA contamination of the total, tissue-derived cDNA). The housekeeping genes, keratin genes, melanocyte-specific genes, and selected high interest genes were detected using four separate and individually designed primer pairs. The primer pairs are set forth in Table 2.
| TABLE 2 |
| Primer sets for indicated genes. |
| Gene Name | Forward primer | Reverse primer |
| ACTB | 5′-GCCAACCGCGAGAAGATG-3′; | 5′-GGCTGGGGTGTTGAAGGT-3′; |
| SEQ ID NO: 1 | SEQ ID NO: 2 | |
| 5′-CGCGAGAAGATGACCCAGAT-3′; | 5′-GGGGTGTTGAAGGTCTCAAA-3′; | |
| SEQ ID NO: 3 | SEQ ID NO: 4 | |
| 5′-TGACCCAGATCATGTTTGAGA-3′; | 5′-GTACATGGCTGGGGTGTTG-3′; | |
| SEQ ID NO: 5 | SEQ ID NO: 6 | |
| 5′-CTGAACCCCAAGGCCAAC-3′; | 5′-TGATCTGGGTCATCTTCTCG-3′; | |
| SEQ ID NO: 7 | SEQ ID NO: 8 | |
| RPLP0 | 5′-AACTCTGCATTCTCGCTTCC-3′; | 5′-GCAGACAGACACTGGCAACA-3′; |
| SEQ ID NO: 9 | SEQ ID NO: 10 | |
| 5′-GCACCATTGAAATCCTGAGTG-3′; | 5′-GCTCCCACTTTGTCTCCAGT-3′; | |
| SEQ ID NO: 11 | SEQ ID NO: 12 | |
| 5′-TCACAGAGGAAACTCTGCATTC-3′; | 5′-GGACACCCTCCAGGAAGC-3′; | |
| SEQ ID NO: 13 | SEQ ID NO: 14 | |
| 5′-ATCTCCAGGGGCACCATT-3′; | 5′-AGCTGCACATCACTCAGGATT-3′; | |
| SEQ ID NO: 15 | SEQ ID NO: 16 | |
| RPL8 | 5′-ACTGCTGGCCACGAGTACG-3′; | 5′-ATGCTCCACAGGATTCATGG-3′; |
| SEQ ID NO: 17 | SEQ ID NO: 18 | |
| 5′-ACAGAGCTGTGGTTGGTGTG-3′; | 5′-TTGTCAATTCGGCCACCT-3′; | |
| SEQ ID NO: 19 | SEQ ID NO: 20 | |
| 5′-TATCTCCTCAGCCAACAGAGC-3′; | 5′-AGCCACCACACCAACCAC-3′; | |
| SEQ ID NO: 21 | SEQ ID NO: 22 | |
| 5′-GTGTGGCCATGAATCCTGT-3′; | 5′-CCACCTCCAAAAGGATGCTC-3′; | |
| SEQ ID NO: 23 | SEQ ID NO: 24 | |
| B2M | 5′-TCTCTCTTTCTGGCCTGGAG-3′; | 5′-GAATCTTTGGAGTACGCTGGA-3′; |
| SEQ ID NO: 25 | SEQ ID NO: 26 | |
| 5′-TGGAGGCTATCCAGCGTACT-3′; | 5′-CGTGAGTAAACCTGAATCTTTGG-3′; | |
| SEQ ID NO: 27 | SEQ ID NO: 28 | |
| 5′-CCAGCGTACTCCAAAGATTCA-3′; | 5′-TCTCTGCTGGATGACGTGAG-3′; | |
| SEQ ID NO: 29 | SEQ ID NO: 30 | |
| 5′-GGCTATCCAGCGTACTCCAA-3′; | 5′-GCTGGATGACGTGAGTAAACC-3′; | |
| SEQ ID NO: 31 | SEQ ID NO: 32 | |
| KRT14 | 5′-ACCATTGAGGACCTGAGGAA-3′; | 5′-GTCCACTGTGGCTGTGAGAA-3′; |
| SEQ ID NO: 33 | SEQ ID NO: 34 | |
| 5′-CATTGAGGACCTGAGGAACA-3′; | 5′-AATCTGCAGAAGGACATTGG-3′; | |
| SEQ ID NO: 35 | SEQ ID NO: 36 | |
| 5′-GATGACTTCCGCACCAAGTA-3′; | 5′-CGCAGGTTCAACTCTGTCTC-3′; | |
| SEQ ID NO: 37 | SEQ ID NO: 38 | |
| 5′-TCCGCACCAAGTATGAGACA-3′; | 5′-ACTCATGCGCAGGTTCAACT-3′; | |
| SEQ ID NO: 39 | SEQ ID NO: 40 | |
| KRT10 | 5′-GAGCCTCGTGACTACAGCAA-3′; | 5′-GCAGGATGTTGGCATTATCAGT-3′; |
| SEQ ID NO: 41 | SEQ ID NO: 42 | |
| 5′-AAAACCATCGATGACCTTAAAAA-3′; | 5′-GATCTGAAGCAGGATGTTGG-3′; | |
| SEQ ID NO: 43 | SEQ ID NO: 44 | |
| MITF | 5′-TTCCCAAGTCAAATGATCCAG-3′; | 5′-AAGATGGTTCCCTTGTTCCA-3′; |
| SEQ ID NO: 45 | SEQ ID NO: 46 | |
| 5′-CGGCATTTGTTGCTCAGAAT-3′; | 5′-GAGCCTGCATTTCAAGTTCC-3′; | |
| SEQ ID NO: 47 | SEQ ID NO: 48 | |
| TYR | 5′-TTCCTTCTTCACCATGCATTT-3′; | 5′-GGAGCCACTGCTCAAAAATA-3′; |
| SEQ ID NO: 49 | SEQ ID NO: 50 | |
| 5′-TCCAAAGATCTGGGCTATGA-3′; | 5′-TTGAAAAGAGTCTGGGTCTGAA-3′; | |
| SEQ ID NO: 51 | SEQ ID NO: 52 | |
| MLANA | 5′-GAGAAAAACTGTGAACCTGTGG-3′; | 5′-ATAAGCAGGTGGAGCATTGG-3′; |
| SEQ ID NO: 53 | SEQ ID NO: 54 | |
| 5′-GAAGACGAAATGGATACAGAGC-3′; | 5′-GTGCCAACATGAAGACTTTTATC-3′; | |
| SEQ ID NO: 55 | SEQ ID NO: 56 | |
| PMEL | 5′-GTGGTCAGCACCCAGCTTAT-3′; | 5′-CCAAGGCCTGCTTCTTGAC-3′; |
| SEQ ID NO: 57 | SEQ ID NO: 58 | |
| 5′-GCTGTGGTCCTTGCATCTCT-3′; | 5′-GCTTCATAAGTCTGCGCCTA-3′; | |
| SEQ ID NO: 59 | SEQ ID NO: 60 | |
| FN1 | 5′-CTCCTGCACATGCTTTGGA-3′; | 5′-AGGTCTGCGGCAGTTGTC-3′; |
| SEQ ID NO: 61 | SEQ ID NO: 62 | |
| 5′-AGGCTTTGGAAGTGGTCATT-3′; | 5′-CCATTGTCATGGCACCATCT-3′; | |
| SEQ ID NO: 63 | SEQ ID NO: 64 | |
| 5′-GAAGTGGTCATTTCAGATGTGATT-3′; | 5′-CCATTGTCATGGCACCATCT-3′; | |
| SEQ ID NO: 65 | SEQ ID NO: 66 | |
| 5′-TGGTCATTTCAGATGTGATTCAT-3′; | 5′-CATTGTCATGGCACCATCTA-3′; | |
| SEQ ID NO: 67 | SEQ ID NO: 68 | |
| SPP1 | 5′-GTTTCGCAGACCTGACATCC-3′; | 5′-TCCTCGTCTGTAGCATCAGG-3′; |
| SEQ ID NO: 69 | SEQ ID NO: 70 | |
| 5′-CCTGACATCCAGTACCCTGA-3′; | 5′-TGAGGTGATGTCCTCGTCTG-3′; | |
| SEQ ID NO: 71 | SEQ ID NO: 72 | |
| 5′-GAATCTCCTAGCCCCACAGA-3′; | 5′-GGTTTCTTCAGAGGACACAGC-3′; | |
| SEQ ID NO: 73 | SEQ ID NO: 74 | |
| 5′-CCCATCTCAGAAGCAGAATCTC-3′; | 5′-ACAGCATTCTGTGGGGCTA-3′; | |
| SEQ ID NO: 75 | SEQ ID NO: 76 | |
| COL4A1 | 5′-GGAAAACCAGGACCCAGAG-3′; | 5′-CTTTTTCCCCTTTGTCACCA-3′; |
| SEQ ID NO: 77 | SEQ ID NO: 78 | |
| 5′-AGAAAGGTGAACCCGGAAAA-3′; | 5′-GGTTTGCCTCTGGGTCCT-3′; | |
| SEQ ID NO: 79 | SEQ ID NO: 80 | |
| 5′-GAGAAAAGGGCCAAAAAGGT-3′; | 5′-CATCCCCTGAAATCCAGGTT-3′; | |
| SEQ ID NO: 81 | SEQ ID NO: 82 | |
| 5′-AAAGGGCCAAAAAGGTGAAC-3′; | 5′-CCTGGCATCCCCTGAAAT-3′; | |
| SEQ ID NO: 83 | SEQ ID NO: 84 | |
| TNC | 5′-GTGTCAACCTGATGGGGAGA-3′; | 5′-GTTAACGCCCTGACTGTGGT-3′; |
| SEQ ID NO: 85 | SEQ ID NO: 86 | |
| 5′-GGTACAGTGGGACAGCAGGT-3′; | 5′-GATCTGCCATTGTGGTAGGC-3′; | |
| SEQ ID NO: 87 | SEQ ID NO: 88 | |
| 5′-AACCACAGTCAGGGCGTTA-3′; | 5′-GTTCGTGGCCCTTCCAGT-3′; | |
| SEQ ID NO: 89 | SEQ ID NO: 90 | |
| 5′-AAGCTGAAGGTGGAGGGGTA-3′; | 5′-GAGTCACCTGCTGTCCCACT-3′; | |
| SEQ ID NO: 91 | SEQ ID NO: 92 | |
| ITGA3 | 5′-TATTCCTCCGAACCAGCATC-3′; | 5′-CACCAGCTCCGAGTCAATGT-3′; |
| SEQ ID NO: 93 | SEQ ID NO: 94 | |
| 5′-CCACCATCAACATGGAGAAC-3′; | 5′-AGTCAATGTCCACAGAGAACCA-3′; | |
| SEQ ID NO: 95 | SEQ ID NO: 96 | |
| LOXL3 | 5′-CAACTGCCACATTGGTGATG-3′; | 5′-AAACCTCCTGTTGGCCTCTT-3′; |
| SEQ ID NO: 97 | SEQ ID NO: 98 | |
| 5′-TGACATCACGGATGTGAAGC-3′; | 5′-GGGTTGATGACAACCTGGAG-3′; | |
| SEQ ID NO: 99 | SEQ ID NO: 100 | |
| AGRN | 5′-TGTGACCGAGAGCGAGAAG-3′; | 5′-CAGGCTCAGTTCAAAGTGGTT-3′; |
| SEQ ID NO: 101 | SEQ ID NO: 102 | |
| 5′-CGGACCTTTGTCGAGTACCT-3′; | 5′-GTTGCTCTGCAGTGCCTTCT-3′; | |
| SEQ ID NO: 103 | SEQ ID NO: 104 | |
| VCAN | 5′-GACTTCCGTTGGACTGATGG-3′; | 5′-TGGTTGGGTCTCCAATTCTC-3′; |
| SEQ ID NO: 105 | SEQ ID NO: 106 | |
| 5′-ACGTGCAAGAAAGGAACAGT-3′; | 5′-TCCAAAGGTCTTGGCATTTT-3′; | |
| SEQ ID NO: 107 | SEQ ID NO: 108 | |
| PLOD3 | 5′-GCAGAGATGGAGCACTACGG-3′; | 5′-CAGCCTTGAATCCTCATGC-3′; |
| SEQ ID NO: 109 | SEQ ID NO: 110 | |
| 5′-GGAAGGAATCGTGGAGCAG-3′; | 5′-CAGCAGTGGGAACCAGTACA-3′; | |
| SEQ ID NO: 111 | SEQ ID NO: 112 | |
| ITGB1 | 5′-CTGATGAATGAAATGAGGAGGA-3′; | 5′-CACAAATGAGCCAAATCCAA-3′; |
| SEQ ID NO: 113 | SEQ ID NO: 114 | |
| 5′-CAGTTTGCTGTGTGTTTGCTC-3′; | 5′-CATGATTTGGCATTTGCTTTT-3′; | |
| SEQ ID NO: 115 | SEQ ID NO: 116 | |
| PTK2 | 5′-GCCCCACCAGAGGAGTATGT-3′; | 5′-AAGCCGACTTCCTTCACCA-3′; |
| SEQ ID NO: 117 | SEQ ID NO: 118 | |
| 5′-GAGACCATTCCCCTCCTACC-3′; | 5′-GCTTCTGTGCCATCTCAATCT-3′; | |
| SEQ ID NO: 119 | SEQ ID NO: 120 | |
| CTGF | 5′-CGAAGCTGACCTGGAAGAGA-3′; | 5′-TGGGAGTACGGATGCACTTT-3′; |
| SEQ ID NO: 121 | SEQ ID NO: 122 | |
| 5′-GTGTGCACCGCCAAAGAT-3′; | 5′-CGTACCACCGAAGATGCAG-3′; | |
| SEQ ID NO: 123 | SEQ ID NO: 124 | |
| PLOD1 | 5′-CTACCCCGGCTACTACACCA-3′; | 5′-GACAAAGGCCAGGTCAAACT-3′; |
| SEQ ID NO: 125 | SEQ ID NO: 126 | |
| 5′-AGTCGGGGTGGATTACGAG-3′; | 5′-ACAGTTGTAGCGCAGGAACC-3′; | |
| SEQ ID NO: 127 | SEQ ID NO: 128 | |
| LAMC1 | 5′-ATGATGATGGCAGGGATGG-3′; | 5′-GCATTGATCTCGGCTTCTTG-3′; |
| SEQ ID NO: 129 | SEQ ID NO: 130 | |
| THBS1 | 5′-CTGTGGCACACAGGAAACAC-3′; | 5′-ACGAGGGTCATGCCACAG-3′; |
| SEQ ID NO: 131 | SEQ ID NO: 132 | |
| 5′-GCCAAAGACGGGTTTCATTA-3′; | 5′-GCCATGATTTTCTTCCCTTC-3′; | |
| SEQ ID NO: 133 | SEQ ID NO: 134 | |
| LOXL2 | 5′-CTCCTCCTACGGCAAGGGA-3′; | 5′-TGGAGATTGTCTAACCAGATGGG-3′; |
| SEQ ID NO: 135 | SEQ ID NO: 136 | |
| 5′-CTCCTACGGCAAGGGAGAAG-3′; | 5′-TTGCCAGTACAGTGGAGATTG-3′; | |
| SEQ ID NO: 137 | SEQ ID NO: 138 | |
| IL6 | 5′-CCAGAGCTGTCAGATGAGT-3′; | 5′-TGCATCTAGATTCTTTGCCTTTT-3′; |
| SEQ ID NO: 139 | SEQ ID NO: 140 | |
| LOXL1 | 5′-AGGGCACAGCAGACTTCCT-3′; | 5′-TCGTCCATGCTGTGGTAATG-3′; |
| SEQ ID NO: 141 | SEQ ID NO: 142 | |
| 5′-GCATGCACCTCTCATACCC-3′; | 5′-CGCATTGTAGGTGTCATAGCA-3′; | |
| SEQ ID NO: 143 | SEQ ID NO: 144 | |
| IL8 | 5′-CTTGGCAGCCTTCCTGATT-3′; | 5′-GCAAAACTGCACCTTCACAC-3′; |
| SEQ ID NO: 145 | SEQ ID NO: 146 | |
| CYR61 | 5′-CGCTCTGAAGGGGATCTG-3′; | 5′-ACAGGGTCTGCCCTCTGACT-3′; |
| SEQ ID NO: 147 | SEQ ID NO: 148 | |
| 5′-GAGCTCAGTCAGAGGGCAGA-3′; | 5′-AACTTTCCCCGTTTTGGTAGA-3′; | |
| SEQ ID NO: 149 | SEQ ID NO: 150 | |
| ITGAV | 5′-GACCTTGGAAACCCAATGAA-3′; | 5′-TCCATCTCTGACTGCTGGTG-3′; |
| SEQ ID NO: 147 | SEQ ID NO: 148 | |
| 5′-GGTGGTATGTGACCTTGGAAA-3′; | 5′-GCACACTGAAACGAAGACCA-3′; | |
| SEQ ID NO: 149 | SEQ ID NO: 150 | |
| YAP | 5′-TGAACAGTGTGGATGAGATGG-3′; | 5′-GCAGGGTGCTTTGGTTGATA-3′; |
| SEQ ID NO: 151 | SEQ ID NO: 152 | |
| BGN | 5′-AAGGGTCTCCAGCACCTCTAC-3′; | 5′-AAGGCCTTCTCATGGATCTT-3′; |
| SEQ ID NO: 153 | SEQ ID NO: 154 | |
| 5′-GAGCTCCGCAAGGATGACT-3′; | 5′-AGGACGAGGGCGTAGAGGT-3′; | |
| SEQ ID NO: 155 | SEQ ID NO: 156 | |
| LAMB1 | 5′-CATTCAAGGAACCCAGAACC-3′; | 5′-GCGTTGAACAAGGTTTCCTC-3′; |
| SEQ ID NO: 157 | SEQ ID NO: 158 | |
| ITBG3 | 5′-AAGAGCCAGAGTGTCCCAAG-3′; | 5′-ACTGAGAGCAGGACCACCA-3′; |
| SEQ ID NO: 159 | SEQ ID NO: 160 | |
| 5′-CTTCTCCTGTGTCCGCTACAA-3′; | 5′-CATGGCCTGAGCACATCTC-3′; | |
| SEQ ID NO: 161 | SEQ ID NO: 162 | |
| 5′-TGCCTGCACCTTTAAGAAAGA-3′; | 5′-CCGGTCAAACTTCTTACACTCC-3′; | |
| SEQ ID NO: 163 | SEQ ID NO: 164 | |
| 5′-AAGGGGGAGATGTGCTCAG-3′; | 5′-CAGTCCCCACAGCTGCAC-3′; | |
| SEQ ID NO: 165 | SEQ ID NO: 166 | |
| CXCL1 | 5′-AAACCGAAGTCATAGCCACAC-3′; | 5′-AAGCTTTCCGCCCATTCTT-3′; |
| SEQ ID NO: 167 | SEQ ID NO: 168 | |
| THBS2 | 5′-AGGCCCAAGACTGGCTACAT-3′; | 5′-CTGCCATGACCTGTTTTCCT-3′; |
| SEQ ID NO: 169 | SEQ ID NO: 170 | |
| 5′-GGCAGGTGCGAACCTTATG-3′; | 5′-CCTTCCAGCCAATGTTCCT-3′; | |
| SEQ ID NO: 171 | SEQ ID NO: 172 | |
| COL18A1 | 5′-GATCGCTGAGCTGAAGGTG-3′; | 5′-CGGATGCCCCATCTGAGT-3′; |
| SEQ ID NO: 173 | SEQ ID NO: 174 | |
| SPARC | 5′-CCCATTGGCGAGTTTGAGAAG-3′; | 5′-AGGAAGAGTCGAAGGTCTTGTT-3′; |
| SEQ ID NO: 175 | SEQ ID NO: 176 | |
| 5′-GGAAGAAACTGTGGCAGAGG-3′; | 5′-GGACAGGATTAGCTCCCACA-3′; | |
| SEQ ID NO: 177 | SEQ ID NO: 178 | |
| TP53 | 5′-ACAACGTTCTGTCCCCCTTG-3′; | 5′-GGGGACAGCATCAAATCATC-3′; |
| SEQ ID NO: 179 | SEQ ID NO: 180 | |
| PLOD2 | 5′-TGGATGCAGATGTTGTTTTGA-3′; | 5′-CACAGCTTTCCATGACGAGTT-3′; |
| SEQ ID NO: 181 | SEQ ID NO: 182 | |
| 5′-TTGATTGAACAAAACAGAAAGATCA-3′; | 5′-TGACGAGTTACAAGAGGAGCAA-3′; | |
| SEQ ID NO: 183 | SEQ ID NO: 184 | |
| CCL2 | 5′-CTGCTCATAGCAGCCACCTT-3′; | 5′-AGGTGACTGGGGCATTGATT-3′; |
| SEQ ID NO: 185 | SEQ ID NO: 186 | |
| FBLN2 | 5′-ACGTGGAGGAGGACACAGAC-3′; | 5′-GGAGCCTTCAGGGCTACTTC-3′; |
| SEQ ID NO: 187 | SEQ ID NO: 188 | |
| LAMA1 | 5′-AGCACTGCCAAAGTGGATG-3′; | 5′-TTGTTGACATGGAACAAGACC-3′; |
| SEQ ID NO: 189 | SEQ ID NO: 190 | |
| THBS4 | 5′-GTGGGCTACATCAGGGTACG-3′; | 5′-CAGAGTCAGCCACCAACTCA-3′; |
| SEQ ID NO: 191 | SEQ ID NO: 192 | |
| 5′-CATCATCTGGTCCAACCTCA-3′; | 5′-GTCCTCAGGGATGGTGTCAT-3′; | |
| SEQ ID NO: 193 | SEQ ID NO: 194 | |
| COL1A1 | 5′-TGACCTCAAGATGTGCCACT-3′; | 5′-TGGTTGGGGTCAATCCAGTA-3′; |
| SEQ ID NO: 195 | SEQ ID NO: 196 | |
| 5′-GATGGATTCCAGTTCGAGTATG-3′; | 5′-ATCAGGCGCAGGAAGGTC-3′; | |
| SEQ ID NO: 197 | SEQ ID NO: 198 | |
| ITGA5 | 5′-CCCAAAAAGAGCGTCAGGT-3′; | 5′-TTGTTGACATGGAACAAGACC-3′; |
| SEQ ID NO: 199 | SEQ ID NO: 200 | |
| TAZ | 5′-CTTCCTAACAGTCCGCCCTA-3′; | 5′-CCCGATCAGCACAGTGATTT-3′; |
| SEQ ID NO: 201 | SEQ ID NO: 202 | |
| POSTN | 5′-CTGCTTCAGGGAGACACACC-3′; | 5′-TGGCTTGCAACTTCCTCAC-3′; |
| SEQ ID NO: 203 | SEQ ID NO: 204 | |
| 5′-AGGAAGTTGCAAGCCAACAA-3′; | 5′-CGACCTTCCCTTAATCGTCTT-3′; | |
| SEQ ID NO: 205 | SEQ ID NO: 206 | |
| LOX | 5′-GCGGAGGAAAACTGTCTGG-3′; | 5′-AAATCTGAGCAGCACCCTGT-3′; |
| SEQ ID NO: 207 | SEQ ID NO: 208 | |
| 5′-ATATTCCTGGGAATGGCACA-3′; | 5′-CCATACTGTGGTAATGTTGATGA-3′; | |
| SEQ ID NO: 209 | SEQ ID NO: 210 | |
| CSRC | 5′-TGTCAACAACACAGAGGGAGA-3′; | 5′-CACGTAGTTGCTGGGGATGT-3′; |
| SEQ ID NO: 211 | SEQ ID NO: 212 | |
| 5′-TGGCAAGATCACCAGACGG-3′; | 5′-GGCACCTTTCGTGGTCTCAC-3′; | |
| SEQ ID NO: 213 | SEQ ID NO: 214 | |
| LAMA3 | 5′-CATGTCGTCTTGGCTCACTC-3′; | 5′-AAATTCTGGCCCCAACAATAC-3′; |
| SEQ ID NO: 215 | SEQ ID NO: 216 | |
| CDKN1A | 5′-CATGTCGTCTTGGCTCACTC-3′; | 5′-AAATTCTGGCCCCAACAATAC-3′; |
| SEQ ID NO: 217 | SEQ ID NO: 218 | |
| CDKN2A | 5′-AGGAGCCAGCGTCTAGGG-3′; | 5′-CTGCCCATCATCATGACCT-3′; |
| SEQ ID NO: 219 | SEQ ID NO: 220 | |
| 5′-AACGCACCGAATAGTTACGG-3′; | 5′-CATCATCATGACCTGGATCG-3′; | |
| SEQ ID NO: 221 | SEQ ID NO: 222 | |
| ITGA2 | 5′-CACTGTTACGATTCCCCTGA-3′; | 5′-CGGCTTTCTCATCAGGTTTC-3′; |
| SEQ ID NO: 223 | SEQ ID NO: 224 | |
| LAMC2 | 5′-ATTAGACGGCCTCCTGCATC-3′; | 5′-AGACCAGCCCCTCTTCATCT-3′; |
| SEQ ID NO: 225 | SEQ ID NO: 226 | |
| PCOLCE2 | 5′-TACTTGGAAAATCACAGTTCCCG-3′; | 5′-TGAATCGGAAATTGAGAACGACT-3′; |
| SEQ ID NO: 225 | SEQ ID NO: 226 | |
| LOXL4 | 5′-GGCCCCGGGAATTATATCT-3′; | 5′-CCACTTCATAGTGGGGGTTC-3′; |
| SEQ ID NO: 227 | SEQ ID NO: 228 | |
| 5′-CTGCACAACTGCCACACAG-3′; | 5′-GTTCTGCATTGGCTGGGTAT-3′; | |
| SEQ ID NO: 229 | SEQ ID NO: 230 | |
| PCOLCE | 5′-CGTGGCAAGTGAGGGGTTC-3′; | 5′-CGAAGACTCGGAATGAGAGGG-3′; |
| SEQ ID NO: 231 | SEQ ID NO: 232 | |
| 5′-GAGGCTTCCTGCTCTGGT-3′; | 5′-CGCAAAATTGGTGCTCAGT-3′; | |
| SEQ ID NO: 233 | SEQ ID NO: 234 | |
| LAMB3 | 5′-GTCCGGGACTTCCTAACAGA-3′; | 5′-GCTGACCTCCTGGATAGTGTG-3′; |
| SEQ ID NO: 235 | SEQ ID NO: 236 | |
| PMEL | 5′-GTGGTCAGCACCCAGCTTAT-3′; | 5′-CCAAGGCCTGCTTCTTGAC-3′; |
| SEQ ID NO: 237 | SEQ ID NO: 238 | |
| 5′-GCTGTGGTCCTTGCATCTCT-3′; | 5′-GCTTCATAAGTCTGCGCCTA-3′; | |
| SEQ ID NO: 239 | SEQ ID NO: 240 | |
| NES | 5′-CTTCCCTCAGCTTTCAGGAC-3′; | 5′-TCTGGGGTCCTAGGGAATTG-3′; |
| SEQ ID NO: 241 | SEQ ID NO: 242 | |
| 5′-ACCTCAAGATGTCCCTCAGC-3′; | 5′-CAGGAGGGTCCTGTACGTG-3′; | |
| SEQ ID NO: 243 | SEQ ID NO: 244 | |
| L1CAM | 5′-GAGACCTTCGGCGAGTCACAG-3′; | 5′-AAAGGCCTTCTCCTCGTTGT-3′; |
| SEQ ID NO: 245 | SEQ ID NO: 246 | |
| 5′-GGCGGCAAATACTCAGTGAA-3′; | 5′-CCTGGGTGTCCTCCTTATCC-3′; | |
| SEQ ID NO: 247 | SEQ ID NO: 248 | |
| GDF15 | 5′-CGGATACTCACGCCAGAAGT-3′; | 5′-AGAGATACGCAGGTGCAGGT-3′; |
| SEQ ID NO: 249 | SEQ ID NO: 250 | |
| 5′-AAGATTCGAACACCGACCTC-3′; | 5′-GCACTTCTGGCGTGAGTATC-3′; | |
| SEQ ID NO: 251 | SEQ ID NO: 252 | |
| ARPC1B | 5′-CACGCCTGGAACAAGGAC-3′; | 5′-ATGCACCTCATGGTTGTTGG-3′; |
| SEQ ID NO: 253 | SEQ ID NO: 254 | |
| 5′-CAGGTGACAGGCATCGACT-3′; | 5′-CGCAGGTCACAATACGGTTA-3′; | |
| SEQ ID NO: 255 | SEQ ID NO: 256 | |
| FARP1 | 5′-TGAGGCCCTGAGAGAGAAGA-3′; | 5′-ATTCCGAAACTCCACACGTC-3′; |
| SEQ ID NO: 257 | SEQ ID NO: 258 | |
| 5′-TCAAGGAAATTGAGCAACGA-3′; | 5′-TCTGATTTGGGCATTTGAGC-3′; | |
| SEQ ID NO: 259 | SEQ ID NO: 260 | |
| NTRK3 | 5′-TATGGTCGACGGTCCAAAT-3′; | 5′-TCCTCACCACTGATGACAGC-3′; |
| SEQ ID NO: 261 | SEQ ID NO: 262 | |
| 5′-CACTGTGACCCACAAACCAG-3′; | 5′-GCAAGTCCAACTGCTATGGA-3′; | |
| SEQ ID NO: 263 | SEQ ID NO: 264 | |
| CSK | 5′-TGAGGCCCTGAGAGAGAAGA-3′; | 5′-ATTCCGAAACTCCACACGTC-3′; |
| SEQ ID NO: 265 | SEQ ID NO: 266 | |
| 5′-TCTACTCCTTTGGGCGAGTG-3′; | 5′-CGTCCTTCAGGGGAATTCTT-3′; | |
| SEQ ID NO: 267 | SEQ ID NO: 268 | |
| CD44 | 5′-TAAGGACACCCCAAATTCCA-3′; | 5′-GCCAAGATGATCAGCCATTC-3′; |
| SEQ ID NO: 269 | SEQ ID NO: 270 | |
| 5′-GCAGTCAACAGTCGAAGAAGG-3′; | 5′-AGCTTTTTCTTCTGCCCACA-3′; | |
| SEQ ID NO: 271 | SEQ ID NO: 272 | |
| SNX17 | 5′-AGCCAGCAAGCAGTGAAGTC-3′; | 5′-TCAGGTGACTCAAGCAGTGG-3′; |
| SEQ ID NO: 273 | SEQ ID NO: 274 | |
| 5′-CCGGGAGTCTATGGTCAAAC-3′; | 5′-CACGGCACTCAGCTTACTTG-3′; | |
| SEQ ID NO: 275 | SEQ ID NO: 276 | |
| PLAT | 5′-TGGAGCAGTCTTCGTTTCG-3′; | 5′-CTGGCTCCTCTTCTGAATCG-3′; |
| SEQ ID NO: 277 | SEQ ID NO: 278 | |
| 5′-GCCCGATTCAGAAGAGGAG-3′; | 5′-TCATCTCTGCAGATCACTTGG-3′; | |
| SEQ ID NO: 279 | SEQ ID NO: 280 | |
The following was performed to generate a standard curve for the target of each primer pair. The standard was generated with a defined number of amplicons per volume for each primer pair. In particular, a standard (S7) was designed to contain about 5 million copies of amplicon-containing cDNA in a bacterial expression vector backbone (pJET1.2 obtained from Fermentas) per one microliter volume for each primer pair. From this, six 1:10 dilutions were generated such that seven standards S1 to S7 were obtained ranging from 5 to 5 million copies of amplicon. To obtain fragments of cDNA, total RNA was extracted from the human HaCaT, A431, and A375 cell lines, and the RNA was reverse transcribed into cDNA. Cell line-derived cDNA was used as a template to amplify fragments of cDNA that contained the desired amplicons for the real time-PCR primer pairs. A list of primers used to generate the desired cDNA fragments is listed in Table 3.
| TABLE 3 |
| Primer sets for generating cDNA fragments of the indicated genes. |
| Gene Name | Forward primer | Reverse primer |
| FN1 | 5′-CCAGCAGAGGCATAAGGTTC-3′; | 5′-AGTAGTGCCTTCGGGACTGG-3′; |
| SEQ ID NO: 281 | SEQ ID NO: 282 | |
| SPP1 | 5′-AGGCTGATTCTGGAAGTTCTGAGG-3′; | 5′-AATCTGGACTGCTTGTGGCTG-3′; |
| SEQ ID NO: 283 | SEQ ID NO: 284 | |
| COL4A1 | 5′-GTTGGGCCTCCAGGATTTA-3′; | 5′-GCCTGGTAGTCCTGGGAAAC-3′; |
| SEQ ID NO: 285 | SEQ ID NO: 286 | |
| TNC | 5′-TGGATGGATTGTGTTCCTGA-3′; | 5′-GCCTGCCTTCAAGATTTCTG-3′; |
| SEQ ID NO: 287 | SEQ ID NO: 288 | |
| ITGA3 | 5′-CTGAGACTGTGCTGACCTGTG-3′; | 5′-CTCTTCATCTCCGCCTTCTG-3′; |
| SEQ ID NO: 289 | SEQ ID NO: 290 | |
| LOXL3 | 5′-GAGACCGCCTACATCGAAGA-3′; | 5′-GGTAGCGTTCAAACCTCCTG-3′; |
| SEQ ID NO: 291 | SEQ ID NO: 292 | |
| AGRN | 5′-ACACCGTCCTCAACCTGAAG-3′; | 5′-AATGGCCAGTGCCACATAGT-3′; |
| SEQ ID NO: 293 | SEQ ID NO: 294 | |
| VCAN | 5′-GGTGCACTTTGTGAGCAAGA-3′; | 5′-TTGGTATGCAGATGGGTTCA-3′; |
| SEQ ID NO: 295 | SEQ ID NO: 296 | |
| PLOD3 | 5′-AGCTGTGGTCCAACTTCTGG-3′; | 5′-GTGTGGTAACCGGGAAACAG-3′; |
| SEQ ID NO: 297 | SEQ ID NO: 298 | |
| ITGB1 | 5′-TTCAGTTTGCTGTGTGTTTGC-3′; | 5′-CCACCTTCTGGAGAATCCAA-3′; |
| SEQ ID NO: 299 | SEQ ID NO: 300 | |
| PTK2 | 5′-GGCAGTATTGACAGGGAGGA-3′; | 5′-TACTCTTGCTGGAGGCTGGT-3′; |
| SEQ ID NO: 301 | SEQ ID NO: 302 | |
| CTGF | 5′-GCCTATTCTGTCACTTCGGCTC-3′; | 5′-GCAGGCACAGGTCTTGATGAAC-3′; |
| SEQ ID NO: 303 | SEQ ID NO: 304 | |
| PLOD1 | 5′-GACCTCTGGGAGGTGTTCAG-3′; | 5′-TTAGGGATCGACGAAGGAGA-3′; |
| SEQ ID NO: 305 | SEQ ID NO: 306 | |
| LAMC1 | 5′-ATTCCTGCCATCAACCAGAC-3′; | 5′-CCTGCTTCTTGGCTTCATTC-3′; |
| SEQ ID NO: 307 | SEQ ID NO: 308 | |
| THBS1 | 5′-CAAAGGGACATCCCAAAATG-3′; | 5′-GAGTCAGCCATGATTTTCTTCC-3′; |
| SEQ ID NO: 309 | SEQ ID NO: 310 | |
| LOXL2 | 5′-TACCCCGAGTACTTCCAGCA-3′; | 5′-GATCTGCTTCCAGGTCTTGC-3′; |
| SEQ ID NO: 311 | SEQ ID NO: 312 | |
| IL6 | 5′-CACACAGACAGCCACTCACC-3′; | 5′-CAGGGGTGGTTATTGCATCT-3′; |
| SEQ ID NO: 313 | SEQ ID NO: 314 | |
| LOXL1 | 5′-CAGACCCCAACTATGTGCAA-3′; | 5′-CGCATTGTAGGTGTCATAGCA-3′; |
| SEQ ID NO: 315 | SEQ ID NO: 316 | |
| IL8 | 5′-CTCTCTTGGCAGCCTTCCT-3′; | 5′-TGAATTCTCAGCCCTCTTCAA-3′; |
| SEQ ID NO: 317 | SEQ ID NO: 318 | |
| CYR61 | 5′-TCGCCTTAGTCGTCACCCTT-3′; | 5′-TGTTTCTCGTCAACTCCACCTCG-3′; |
| SEQ ID NO: 319 | SEQ ID NO: 320 | |
| ITGAV | 5′-CTGATTTCATCGGGGTTGTC-3′; | 5′-TGCCTTGCTGAATGAACTTG-3′; |
| SEQ ID NO: 321 | SEQ ID NO: 322 | |
| YAP | 5′-CCAGTGAAACAGCCACCAC-3′; | 5′-CTCCTTCCAGTGTTCCAAGG-3′; |
| SEQ ID NO: 323 | SEQ ID NO: 324 | |
| BGN | 5′-GGACTCTGTCACACCCACCT-3′; | 5′-CAGGGTCTCAGGGAGGTCTT-3′; |
| SEQ ID NO: 325 | SEQ ID NO: 326 | |
| LAMB1 | 5′-TGCCAGAGCTGAGATGTTGTT-3′; | 5′-TGTAGCATTTCGGCTTTCCT-3′; |
| SEQ ID NO: 327 | SEQ ID NO: 328 | |
| ITGB3 | 5′-GGCAAGTACTGCGAGTGTGA-3′; | 5′-ATTCTTTTCGGTCGTGGATG-3′; |
| SEQ ID NO: 329 | SEQ ID NO: 330 | |
| CXCL1 | 5′-CACTGCTGCTCCTGCTCCT-3′; | 5′-TGTTCAGCATCTTTTCGATGA-3′; |
| SEQ ID NO: 331 | SEQ ID NO: 332 | |
| THBS2 | 5′-TGACAATGACAACATCCCAGA-3′; | 5′-TGAGTCTGCCATGACCTGTT-3′; |
| SEQ ID NO: 333 | SEQ ID NO: 334 | |
| COL18A1 | 5′-CCCTGCTCTACACAGAACCAG-3′; | 5′-ACACCTGGCTCCCCTTTCT-3′; |
| SEQ ID NO: 335 | SEQ ID NO: 336 | |
| SPARC | 5′-GCCTGGATCTTCTTTCTCCTTTGC-3′; | 5′-CATCCAGGGCGATGTACTTGTC-3′; |
| SEQ ID NO: 337 | SEQ ID NO: 338 | |
| TP53 | 5′-CCCCCTCTGAGTCAGGAAAC-3′; | 5′-TCATGTGCTGTGACTGCTTG-3′; |
| SEQ ID NO: 339 | SEQ ID NO: 340 | |
| PLOD2 | 5′-TGGACCCACCAAGATTCTCCTG-3′; | 5′-GACCACAGCTTTCCATGACGAG-3′; |
| SEQ ID NO: 341 | SEQ ID NO: 342 | |
| CCL2 | 5′-TCTGTGCCTGCTGCTCATAG-3′; | 5′-GAGTTTGGGTTTGCTTGTCC-3′; |
| SEQ ID NO: 343 | SEQ ID NO: 344 | |
| FBLN2 | 5′-CGAGAAGTGCCCAGGAAG-3′; | 5′-AGTGAGAAGCCAGGAAAGCA-3′; |
| SEQ ID NO: 345 | SEQ ID NO: 346 | |
| LAMA1 | 5′-TGGAAATATCACCCACAGCA-3′; | 5′-AGGCATTTTTGCTTCACACC-3′; |
| SEQ ID NO: 347 | SEQ ID NO: 348 | |
| THBS4 | 5′-GCTCCAGCTTCTACGTGGTC-3′; | 5′-TTAATTATCGAAGCGGTCGAA-3′; |
| SEQ ID NO: 349 | SEQ ID NO: 350 | |
| COL1A1 | 5′-AGCCAGCAGATCGAGAACAT-3′; | 5′-CCTTCTTGAGGTTGCCAGTC-3′; |
| SEQ ID NO: 351 | SEQ ID NO: 352 | |
| ITGA5 | 5′-CACCAATCACCCCATTAACC-3′; | 5′-GCTTGAGCTGAGCTTTTTCC-3′; |
| SEQ ID NO: 353 | SEQ ID NO: 354 | |
| TAZ | 5′-CCAGGTGCTGGAAAAAGAAG-3′; | 5′-GAGCTGCTCTGCCTGAGTCT-3′; |
| SEQ ID NO: 355 | SEQ ID NO: 356 | |
| POSTN | 5′-GCAGACACACCTGTTGGAAA-3′; | 5′-GAACGACCTTCCCTTAATCG-3′; |
| SEQ ID NO: 357 | SEQ ID NO: 358 | |
| LOX | 5′-CCTACTACATCCAGGCGTCCAC-3′; | 5′-ATGCAAATCGCCTGTGGTAGC-3′; |
| SEQ ID NO: 359 | SEQ ID NO: 360 | |
| CSRC | 5′-CTGTTCGGAGGCTTCAACTC-3′; | 5′-AGGGATCTCCCAGGCATC-3′; |
| SEQ ID NO: 361 | SEQ ID NO: 362 | |
| LAMA3 | 5′-TACCTGGGATCACCTCCATC-3′; | 5′-ACAGGGATCCTCAGTGTCGT-3′; |
| SEQ ID NO: 363 | SEQ ID NO: 364 | |
| CDKN1A | 5′-CGGGATGAGTTGGGAGGAG-3′; | 5′-TTAGGGCTTCCTCTTGGAGA-3′; |
| SEQ ID NO: 365 | SEQ ID NO: 366 | |
| CDKN2A-004 | 5′-ATGGTGCGCAGGTTCTTG-3′; | 5′-ACCAGCGTGTCCAGGAAG-3′; |
| 2A-201 | SEQ ID NO: 367 | SEQ ID NO: 368 |
| CDKN2A-001 | 5′-GAGCAGCATGGAGCCTTC-3′; | 5′-GCATGGTTACTGCCTCTGGT-3′; |
| 2A-202 | SEQ ID NO: 369 | SEQ ID NO: 370 |
| ITGA2 | 5′-CAAACAGACAAGGCTGGTGA-3′; | 5′-TCAATCTCATCTGGATTTTTGG-3′; |
| SEQ ID NO: 371 | SEQ ID NO: 372 | |
| LAMC2 | 5′-CTGCAGGTGGACAACAGAAA-3′; | 5′-CATCAGCCAGAATCCCATCT-3′; |
| SEQ ID NO: 373 | SEQ ID NO: 374 | |
| PCOLCE2 | 5′-GTCCCCAGAGAGACCTGTTT-3′; | 5′-AGACACAATTGGCGCAGGT-3′; |
| SEQ ID NO: 375 | SEQ ID NO: 376 | |
| LOXL4 | 5′-AAGACTGGACGCGATAGCTG-3′; | 5′-GGTTGTTCCTGAGACGCTGT-3′; |
| SEQ ID NO: 377 | SEQ ID NO: 378 | |
| PCOLCE | 5′-TACACCAGACCCGTGTTCCT-3′; | 5′-TCCAGGTCAAACTTCTCGAAGG-3′; |
| SEQ ID NO: 379 | SEQ ID NO: 380 | |
| LAMB3 | 5′-CTTCAATGCCCAGCTCCA-3′; | 5′-TTCCCAACCACATCTTCCAC-3′; |
| SEQ ID NO: 381 | SEQ ID NO: 382 | |
| CSF2 | 5′-CTGCTGCTCTTGGGCACT-3′; | 5′-CAGCAGTCAAAGGGGATGAC-3′; |
| SEQ ID NO: 383 | SEQ ID NO: 384 | |
| ACTB | 5′-AGGATTCCTATGTGGGCGACG-3′; | 5′-TCAGGCAGCTCGTAGCTCTTC-3′; |
| SEQ ID NO: 385 | SEQ ID NO: 386 | |
| RPLP0 | 5′-GGAATGTGGGCTTTGTGTTCACC-3′; | 5′-AGGCCAGGACTCGTTTGTACC-3′; |
| SEQ ID NO: 387 | SEQ ID NO: 388 | |
| RLP8 | 5′-ACATCAAGGGCATCGTCAAGG-3′; | 5′-TCTCTTTCTCCTGCACAGTCTTGG-3′; |
| SEQ ID NO: 389 | SEQ ID NO: 390 | |
| B2M | 5′-TGCTCGCGCTACTCTCTCTTTC-3′; | 5′-TCACATGGTTCACACGGCAG-3′; |
| SEQ ID NO: 391 | SEQ ID NO: 392 | |
| K10 | 5′-TGGCCTTCTCTCTGGAAATG-3′; | 5′-TCATTTCCTCCTCGTGGTTC-3′; |
| SEQ ID NO: 393 | SEQ ID NO: 394 | |
| K14 | 5′-AGGTGACCATGCAGAACCTC-3′; | 5′-CCTCGTGGTTCTTCTTCAGG-3′; |
| SEQ ID NO: 395 | SEQ ID NO: 396 | |
| MITF | 5′-GAAATCTTGGGCTTGATGGA-3′; | 5′-CCGAGGTTGTTGTTGAAGGT-3′; |
| SEQ ID NO: 397 | SEQ ID NO: 398 | |
| TYR | 5′-CCATGGATAAAGCTGCCAAT-3′; | 5′-GACACAGCAAGCTCACAAGC-3′; |
| SEQ ID NO: 399 | SEQ ID NO: 400 | |
| MLANA | 5′-CACTCTTACACCACGGCTGA-3′; | 5′-CATAAGCAGGTGGAGCATTG-3′; |
| SEQ ID NO: 401 | SEQ ID NO: 402 | |
| PMEL | 5′-TTGTCCAGGGTATTGAAAGTGC-3′; | 5′-GACAAGAGCAGAAGATGCGGG-3′; |
| SEQ ID NO: 403 | SEQ ID NO: 404 | |
| NES | 5′-GCGTTGGAACAGAGGTTGGAG-3′; | 5′-CAGGTGTCTCAAGGGTAGCAGG-3′; |
| SEQ ID NO: 405 | SEQ ID NO: 406 | |
| L1CAM | 5′-CTTCCCTTTCGCCACAGTATG-3′; | 5′-CCTCCTTCTCCTTCTTGCCACT-3′; |
| SEQ ID NO: 407 | SEQ ID NO: 408 | |
| GDF15 | 5′-AATGGCTCTCAGATGCTCCTGG-3′; | 5′-GATTCTGCCAGCAGTTGGTCC-3′; |
| SEQ ID NO: 409 | SEQ ID NO: 410 | |
| ARPC1B | 5′-ACCACAGCTTCCTGGTGGAG-3′; | 5′-GAGCGGATGGGCTTCTTGATG-3′; |
| SEQ ID NO: 411 | SEQ ID NO: 412 | |
| FARP1 | 5′-AACGTGACCTTGTCTCCCAAC-3′; | 5′-GCATGACATCGCCGATTCTT-3′; |
| SEQ ID NO: 413 | SEQ ID NO: 414 | |
| NTRK3 | 5′-TTCAACAAGCCCACCCACTAC-3′; | 5′-GTTCTCAATGACAGGGATGCG-3′; |
| SEQ ID NO: 415 | SEQ ID NO: 416 | |
| CSK | 5′-CATGGAATACCTGGAGGGCAAC-3′; | 5′-CAGGTGCCAGCAGTTCTTCAT-3′; |
| SEQ ID NO: 417 | SEQ ID NO: 418 | |
| CD44 | 5′-TCTCAGAGCTTCTCTACATCAC-3′; | 5′-CTGACGACTCCTTGTTCACCA-3′; |
| SEQ ID NO: 419 | SEQ ID NO: 420 | |
| SNX17 | 5′-TCACCTCCTCTGTACCATTGC-3′; | 5′-CTCATCTCCAATGCCCTCGA-3′; |
| SEQ ID NO: 421 | SEQ ID NO: 422 | |
| PLAT | 5′-TGCAATGAAGAGAGGGCTCTG-3′; | 5′-CGTGGCCCTGGTATCTATTTCA-3′; |
| SEQ ID NO: 432 | SEQ ID NO: 424 | |
The PCR reactions were performed using a high-fidelity polymerase (product name: “Phusion,” obtained from New England Biolabs). PCR amplification products were checked for correct size and subsequently gel purified using the Qiagen Gel Extraction kit. Purified PCR fragments were subcloned into the bacterial expression vector pJET1.2 using a commercially available kit (Fermentas). The subcloned fragments were subsequently checked by restriction digest and DNA sequencing. Bacterial clones harboring the pJET1.2 expression vector with the correct PCR insert (containing the desired amplicon for real time PCR primer pairs) were frozen and stored at −80° C. This was done to regenerate the same real time PCR standards over time.
Bacteria harboring the pJET1.2 expression vector with PCR inserts were cultured to generate sufficient amounts of vector. A small aliquot of the total retrieved expression vector with insert was linearized using the PvuI-HF restriction enzyme (from New England Biolabs). The digest was then purified using the Qiagen PCR purification kit. Linearized cDNA was diluted to a concentration of 20 ng/μL. One μL of each of a total of 71 linearized cDNA fragments (each at a 20 ng/μL concentration) were mixed and brought to a final volume of 1 mL to obtain standard S7.
Standard S7 was then diluted six times at a 1:10 ratio to obtained standards S1 to S6. Dilution was performed using ultrapure water obtained from Promega (Cat. No. P1193).
The following was performed to generate cDNA from FFPE samples. FFPE blocks were cut at 20 μm sections using a standard Leica microtome. For large pieces of tissue, 2×20 μm full sections were used for RNA retrieval. For smaller tissues, up to 5×20 μm sections were combined for RNA retrieval. RNA extraction was performed using the Qiagen RNA FFPE retrieval kit and a Qiagen QiaCube extraction robot. 0.5 to 1 μg of RNA with a 260/280 ratio of greater than 1.8 were transcribed into cDNA using the BioRad iScript cDNA Synthesis kit. All biospecimens were annotated with clinical data from Mayo Clinic databases. H&E stained sections were obtained for each block analyzed and digitalized using a high-resolution slide scanner.
Fluidigm RT-PCR was performed using a 96×96 format for high throughput analysis (i.e., 96 cDNAs were analyzed for 96 markers; 9216 data points). The primer pairs and cDNAs were prepared in a 96 well format. Standard curves were calculated for each primer pair. Copy numbers per 100,000 housekeeping genes were calculated for each primer pair and averaged per gene. This was initially done for cDNAs derived from FFPE-embedded skin. To correct for epidermal cell-derived cross-contamination, background signal per one copy of K14 (a basal keratinocyte marker) was calculated from FFPE-embedded normal skin samples for each primer pair and averaged. Experimental samples were then normalized first to 100,000 housekeeping genes and then background-corrected for epidermal cross-contamination based on K14 copy number. In particular, the keratinocyte correction factor used for each gene is set forth in Table E under the column titled “AVG per copy K14.”
The study design (Example 1) involved a comparison of the expression profile of “true” benign pigmented skin lesions (nevi, n=73) with “true” malignant melanomas of the skin. The latter comprised i) primary skin melanomas that were documented to metastasize, either to regional lymph nodes, to other areas of skin (in-transit), or to other organs; and ii) in-transit or comparison of nevi to in-transit melanoma metastases (n=54).
Tables C and D summarize the comparisons of the gene expressions between the 73 benign and 54 metastatic. Table A compares the ranked values using the Wilcoxon rank sum test, and Table E compares the dichotomized values (zero vs. >0) using the chi-square test.
A recursive partitioning approach was used to identify cut-points for the genes that would discriminate between these two groups. After partitioning the data at a cut-point of 45 for FN1, no further additional splits in the data based on the other genes were identified by this method.
Using a cutoff of 45 for FN1, the sensitivity was 92.6%, and the specificity was 98.6%. These results are provided in Tables 4 and 5 along with the next possible cutoff for FN1 at 124.
| TABLE 4 | ||||
| Frequency | ||||
| Percent | ||||
| Row Pct | ||||
| Col Pct | Malignant | Benign | Total | |
| FN1 < 45 | 4 | 72 | 76 | |
| 3.15 | 56.69 | 59.84 | ||
| 5.26 | 94.74 | |||
| 7.41 | 98.63 | |||
| FN1 ≥ 45 | 50 | 1 | 51 | |
| 39.37 | 0.79 | 40.16 | ||
| 98.04 | 1.96 | |||
| 92.59 | 1.37 | |||
| Total | 54 | 73 | 127 | |
| 42.52 | 57.48 | 100.00 | ||
| TABLE 5 | ||||
| Frequency | ||||
| Percent | ||||
| Row Pct | ||||
| Col Pct | Malignant | Benign | Total | |
| FN1 < 124 | 8 | 73 | 81 | |
| 6.30 | 57.48 | 63.78 | ||
| 9.88 | 90.12 | |||
| 14.81 | 100.00 | |||
| FN1 ≥ 124 | 46 | 0 | 46 | |
| 36.22 | 0.00 | 36.22 | ||
| 100.00 | 0.00 | |||
| 85.19 | 0.00 | |||
| Total | 54 | 73 | 127 | |
| 42.52 | 57.48 | 100.00 | ||
The ability to further discriminate between the groups was assessed by considering SPP1 or ITGB3 in addition to FN1.
Benign Vs. Malignant—Option 1 Using FN1 and SPP1 (FIG. 5)
The results are set forth in Table 6.
| TABLE 6 | |||
| RULE for FIG. 5 | Malignant | Benign | |
| FN1 < 45 and SPP1 = 0 | 2 | 72 | |
| FN1 ≥ 45 | 52 | 1 | |
| or | |||
| (FN1 < 45 and SPP1 > 0) | |||
| Total | 54 | 73 | |
Benign Vs. Malignant—Option 2 Using FN1 and ITGB3 (FIG. 6)
The results are set forth in Table 7.
| TABLE 7 | |||
| RULE for FIG. 6 | Malignant | Benign | |
| FN1 < 45 and ITGB3 = 0 | 3 | 72 | |
| FN1 ≥ 45 | 51 | 1 | |
| or | |||
| (FN1 < 45 and ITGB3 > 0) | |||
| Total | 54 | 73 | |
If all three genes are included, the rule was as follows:
-
- FN1<45 and SPP1=0 and ITGB3=0 denotes a negative test
- vs.
- all other combinations denotes a positive test.
- FN1<45 and SPP1=0 and ITGB3=0 denotes a negative test
This rule resulted in a specificity of 72/73 (98.6%), and a sensitivity of 53/54 (98.2%) (Table 8). Compared to a rule using FN1 alone, the specificity stayed the same but the sensitivity increased from 92.6% to 98.2% using this new rule.
| TABLE 8 | |||||
| FN1 | SPP1 | ITGB3 | malignant | Frequency | |
| <45 | Zero | Zero | No | 72 | |
| <45 | Zero | Zero | Yes | 1 | False Neg |
| ID MM150 | |||||
| (case added from | |||||
| the Breslow file) | |||||
| ≥45 | Zero | Zero | No | 1 | False Pos |
| ID N29 | |||||
| ≥45 | Zero | Zero | Yes | 9 | |
| ≥45 | Zero | >0 | Yes | 1 | |
| ≥45 | >0 | Zero | Yes | 18 | |
| ≥45 | >0 | >0 | Yes | 22 | |
| <45 | Zero | >0 | Yes | 1 | |
| <45 | >0 | Zero | Yes | 2 | |
The rule was evaluated using 25 additional malignant patients who did not have mets (from the “Breslow” file). For 19 of these 25 patients, the rule was “negative” (Table 9).
| TABLE 9 | ||||
| FN1 | SPP1 | ITGB3 | Frequency | |
| <45 | Zero | Zero | 19 | |
| <45 | >0 | Zero | 1 | |
| ≥45 | Zero | Zero | 2 | |
| ≥45 | >0 | Zero | 3 | |
| <45 | 1 | |||
The rule also was evaluated using 33 thin melanomas (Table 10). For 25 of these 33 patients, the rule was “negative.”
| TABLE 10 | ||||
| FN1 | SPP1 | ITGB3 | Frequency | |
| <45 | Zero | Zero | 25 | |
| <45 | Zero | >0 | 1 | |
| ≥45 | Zero | Zero | 5 | |
| ≥45 | >0 | Zero | 2 | |
| TABLE C |
| Comparison of gene expression between benign and malignant |
| Benign (N = 73) | Malignant (N = 54) | p value | |
| CXCL1_AVG_NORM | <0.0001 | ||
| N | 73 | 54 | |
| Mean (SD) | 4.8 (18.4) | 20.0 (26.1) | |
| Median | 0.0 | 10.3 | |
| Q1, Q3 | 0.0, 0.0 | 0.3, 31.1 | |
| Range | (0.0-141.7) | (0.0-120.4) | |
| CSF2_AVG_NORM | 0.0482 | ||
| N | 73 | 54 | |
| Mean (SD) | 10.5 (44.1) | 4.3 (8.4) | |
| Median | 2.5 | 1.0 | |
| Q1, Q3 | 0.6, 7.0 | 0.0, 4.0 | |
| Range | (0.0-375.0) | (0.0-41.0) | |
| CCL2_AVG_NORM | <0.0001 | ||
| N | 73 | 54 | |
| Mean (SD) | 37.0 (99.4) | 244.2 (360.9) | |
| Median | 0.0 | 112.8 | |
| Q1, Q3 | 0.0, 9.1 | 7.2, 342.2 | |
| Range | (0.0-572.0) | (0.0-1777.1) | |
| IL8_AVG_NORM | <0.0001 | ||
| N | 73 | 54 | |
| Mean (SD) | 125.5 (671.3) | 53.2 (160.8) | |
| Median | 0.0 | 13.0 | |
| Q1, Q3 | 0.0, 0.0 | 2.1, 52.5 | |
| Range | (0.0-5058.7) | (0.0-1171.7) | |
| IL6_AVG_NORM | <0.0001 | ||
| N | 73 | 54 | |
| Mean (SD) | 9.9 (69.1) | 21.6 (35.0) | |
| Median | 0.0 | 8.8 | |
| Q1, Q3 | 0.0, 0.0 | 0.3, 25.2 | |
| Range | (0.0-589.1) | (0.0-152.3) | |
| ITGA5_AVG_NORM | <0.0001 | ||
| N | 73 | 54 | |
| Mean (SD) | 0.0 (0.0) | 9.8 (26.8) | |
| Median | 0.0 | 0.0 | |
| Q1, Q3 | 0.0, 0.0 | 0.0, 7.0 | |
| Range | (0.0-0.0) | (0.0-168.0) | |
| ITGA3_AVG_NORM | <0.0001 | ||
| N | 73 | 54 | |
| Mean (SD) | 3.2 (27.5) | 168.2 (313.4) | |
| Median | 0.0 | 50.2 | |
| Q1, Q3 | 0.0, 0.0 | 2.0, 160.5 | |
| Range | (0.0-235.4) | (0.0-1506.0) | |
| ITGA2_AVG_NORM | 0.0007 | ||
| N | 73 | 54 | |
| Mean (SD) | 0.0 (0.0) | 2.6 (10.0) | |
| Median | 0.0 | 0.0 | |
| Q1, Q3 | 0.0, 0.0 | 0.0, 0.0 | |
| Range | (0.0-0.0) | (0.0-69.7) | |
| ITGAV_AVG_NORM | <0.0001 | ||
| N | 73 | 54 | |
| Mean (SD) | 3.3 (23.9) | 22.0 (32.9) | |
| Median | 0.0 | 8.0 | |
| Q1, Q3 | 0.0, 0.0 | 0.0, 31.0 | |
| Range | (0.0-199.9) | (0.0-176.8) | |
| ITGB3_AVG_NORM | <0.0001 | ||
| N | 73 | 54 | |
| Mean (SD) | 0.0 (0.0) | 43.6 (90.3) | |
| Median | 0.0 | 0.0 | |
| Q1, Q3 | 0.0, 0.0 | 0.0, 52.5 | |
| Range | (0.0-0.0) | (0.0-495.3) | |
| ITGB1_AVG_NORM | <0.0001 | ||
| N | 73 | 54 | |
| Mean (SD) | 29.9 (95.1) | 616.2 (742.2) | |
| Median | 0.0 | 400.2 | |
| Q1, Q3 | 0.0, 0.0 | 84.7, 869.0 | |
| Range | (0.0-487.9) | (0.0-3877.9) | |
| FN1_AVG_NORM | <0.0001 | ||
| N | 73 | 54 | |
| Mean (SD) | 2.9 (15.6) | 1570.9 (1949.8) | |
| Median | 0.0 | 898.4 | |
| Q1, Q3 | 0.0, 0.0 | 299.5, 2186.1 | |
| Range | (0.0-123.2) | (0.0-11073.5) | |
| THBS1_AVG_NORM | <0.0001 | ||
| N | 73 | 54 | |
| Mean (SD) | 0.0 (0.0) | 85.1 (136.1) | |
| Median | 0.0 | 16.8 | |
| Q1, Q3 | 0.0, 0.0 | 0.0, 153.8 | |
| Range | (0.0-0.0) | (0.0-786.2) | |
| THBS2_AVG_NORM | <0.0001 | ||
| N | 73 | 54 | |
| Mean (SD) | 25.9 (113.4) | 280.0 (513.5) | |
| Median | 0.0 | 44.1 | |
| Q1, Q3 | 0.0, 0.0 | 0.0, 340.1 | |
| Range | (0.0-729.2) | (0.0-3030.5) | |
| THBS4_AVG_NORM | <0.0001 | ||
| N | 73 | 54 | |
| Mean (SD) | 38.5 (151.2) | 228.2 (663.7) | |
| Median | 0.0 | 22.5 | |
| Q1, Q3 | 0.0, 0.0 | 0.0, 97.9 | |
| Range | (0.0-1130.3) | (0.0-3977.7) | |
| VCAN_AVG_NORM | <0.0001 | ||
| N | 73 | 54 | |
| Mean (SD) | 3.0 (21.7) | 202.4 (262.8) | |
| Median | 0.0 | 103.4 | |
| Q1, Q3 | 0.0, 0.0 | 0.0, 283.5 | |
| Range | (0.0-181.3) | (0.0-1113.2) | |
| BGAN_AVG_NORM | <0.0001 | ||
| N | 73 | 54 | |
| Mean (SD) | 69.3 (121.0) | 422.4 (573.1) | |
| Median | 0.0 | 248.5 | |
| Q1, Q3 | 0.0, 97.9 | 113.5, 462.9 | |
| Range | (0.0-496.3) | (0.0-3348.1) | |
| SPP1_AVG_NORM | <0.0001 | ||
| N | 73 | 54 | |
| Mean (SD) | 0.0 (0.0) | 1490.2 (3397.4) | |
| Median | 0.0 | 338.1 | |
| Q1, Q3 | 0.0, 0.0 | 4.9, 1577.7 | |
| Range | (0.0-0.0) | (0.0-22427.0) | |
| TNC_AVG_NORM | <0.0001 | ||
| N | 73 | 54 | |
| Mean (SD) | 66.4 (240.1) | 800.1 (808.7) | |
| Median | 0.0 | 495.8 | |
| Q1, Q3 | 0.0, 0.0 | 174.5, 1322.9 | |
| Range | (0.0-1393.3) | (0.0-3162.2) | |
| SPARC_AVG_NORM | <0.0001 | ||
| N | 73 | 54 | |
| Mean (SD) | 843.7 (2222.8) | 3208.4 (3182.6) | |
| Median | 0.0 | 2895.8 | |
| Q1, Q3 | 0.0, 0.0 | 407.2, 5216.3 | |
| Range | (0.0-11175.6) | (0.0-13631.9) | |
| AGRN_AVG_NORM | <0.0001 | ||
| N | 73 | 54 | |
| Mean (SD) | 4.7 (18.1) | 51.2 (53.8) | |
| Median | 0.0 | 42.1 | |
| Q1, Q3 | 0.0, 0.0 | 10.7, 69.7 | |
| Range | (0.0-121.7) | (0.0-242.0) | |
| CTGF_AVG_NORM | <0.0001 | ||
| N | 73 | 54 | |
| Mean (SD) | 0.4 (3.6) | 90.9 (231.6) | |
| Median | 0.0 | 22.1 | |
| Q1, Q3 | 0.0, 0.0 | 0.0, 125.9 | |
| Range | (0.0-30.6) | (0.0-1631.4) | |
| CYR61_AVG_NORM | <0.0001 | ||
| N | 73 | 54 | |
| Mean (SD) | 4.8 (13.0) | 27.2 (39.2) | |
| Median | 0.0 | 18.7 | |
| Q1, Q3 | 0.0, 0.0 | 4.9, 32.2 | |
| Range | (0.0-70.4) | (0.0-267.2) | |
| LAMA3_AVG_NORM | 0.0004 | ||
| N | 73 | 54 | |
| Mean (SD) | 1.1 (9.0) | 1.2 (2.9) | |
| Median | 0.0 | 0.0 | |
| Q1, Q3 | 0.0, 0.0 | 0.0, 0.0 | |
| Range | (0.0-76.8) | (0.0-11.3) | |
| LAMC1_AVG_NORM | <0.0001 | ||
| N | 73 | 54 | |
| Mean (SD) | 0.0 (0.0) | 70.6 (159.4) | |
| Median | 0.0 | 28.4 | |
| Q1, Q3 | 0.0, 0.0 | 0.0, 99.3 | |
| Range | (0.0-0.0) | (0.0-1136.2) | |
| LAMB1_AVG_NORM | <0.0001 | ||
| N | 73 | 54 | |
| Mean (SD) | 9.2 (38.4) | 221.1 (354.3) | |
| Median | 0.0 | 73.1 | |
| Q1, Q3 | 0.0, 0.0 | 0.0, 339.8 | |
| Range | (0.0-248.8) | (0.0-1877.6) | |
| LAMA1_AVG_NORM | <0.0001 | ||
| N | 73 | 54 | |
| Mean (SD) | 5.7 (14.5) | 65.4 (149.0) | |
| Median | <0.0 | 10.6 | |
| Q1, Q3 | 0.0, 0.0 | 0.0, 49.0 | |
| Range | (0.0-76.5) | (0.0-754.3) | |
| LAMC2_AVG_NORM | 0.0003 | ||
| N | 73 | 54 | |
| Mean (SD) | 0.0 (0.0) | 4.0 (15.3) | |
| Median | 0.0 | 0.0 | |
| Q1, Q3 | 0.0, 0.0 | 0.0, 0.0 | |
| Range | (0.0-0.0) | (0.0-91.1) | |
| LAMB3_AVG_NORM | 0.1473 | ||
| N | 73 | 54 | |
| Mean (SD) | 33.5 (60.3) | 32.2 (54.5) | |
| Median | 0.0 | 12.1 | |
| Q1, Q3 | 0.0, 44.6 | 0.0, 37.0 | |
| Range | (0.0-323.9) | (0.0-246.0) | |
| COL1A1_AVG_NORM | <0.0001 | ||
| N | 73 | 54 | |
| Mean (SD) | 1534.4 (4365.3) | 4191.6 (5865.9) | |
| Median | 0.0 | 1704.4 | |
| Q1, Q3 | 0.0, 0.0 | 0.0, 6850.9 | |
| Range | (0.0-22510.2) | (0.0-31867.0) | |
| COL4A1_AVG_NORM | <0.0001 | ||
| N | 73 | 54 | |
| Mean (SD) | 0.0 (0.0) | 211.8 (344.1) | |
| Median | 0.0 | 118.4 | |
| Q1, Q3 | 0.0, 0.0 | 2.3, 261.2 | |
| Range | (0.0-0.0) | (0.0-1774.4) | |
| COL18A1_AVG_NORM | <0.0001 | ||
| N | 73 | 54 | |
| Mean (SD) | 94.2 (783.4) | 22.8 (38.8) | |
| Median | 0.0 | 4.1 | |
| Q1, Q3 | 0.0, 0.0 | 0.0, 34.4 | |
| Range | (0.0-6695.7) | (0.0-208.8) | |
| LOX_AVG_NORM | 0.0003 | ||
| N | 73 | 54 | |
| Mean (SD) | 37.7 (132.8) | 65.0 (113.9) | |
| Median | 0.0 | 3.5 | |
| Q1, Q3 | 0.0, 0.0 | 0.0, 58.0 | |
| Range | (0.0-991.2) | (0.0-443.3) | |
| LOXL1_AVG_NORM | <0.0001 | ||
| N | 73 | 54 | |
| Mean (SD) | 0.8 (7.1) | 39.6 (60.3) | |
| Median | 0.0 | 18.5 | |
| Q1, Q3 | 0.0, 0.0 | 0.0, 65.0 | |
| Range | (0.0-60.4) | (0.0-349.0) | |
| LOXL2_AVG_NORM | <0.0001 | ||
| N | 73 | 54 | |
| Mean (SD) | 43.3 (356.8) | 68.5 (129.9) | |
| Median | 0.0 | 22.1 | |
| Q1, Q3 | 0.0, 0.0 | 0.0, 89.1 | |
| Range | (0.0-3048.4) | (0.0-821.4) | |
| LOXL3_AVG_NORM | <0.0001 | ||
| N | 73 | 54 | |
| Mean (SD) | 2.2 (12.3) | 28.4 (71.1) | |
| Median | 0.0 | 9.2 | |
| Q1, Q3 | 0.0, 0.0 | 2.5, 29.4 | |
| Range | (0.0-89.7) | (0.0-507.5) | |
| LOXL4_AVG_NORM | 0.0010 | ||
| N | 73 | 54 | |
| Mean (SD) | 33.8 (91.0) | 129.1 (300.4) | |
| Median | 0.0 | 9.1 | |
| Q1, Q3 | 0.0, 10.2 | 0.0, 67.0 | |
| Range | (0.0-529.2) | (0.0-1230.0) | |
| PLOD1_AVG_NORM | <0.0001 | ||
| N | 73 | 54 | |
| Mean (SD) | 33.7 (116.5) | 420.3 (532.2) | |
| Median | 0.0 | 242.3 | |
| Q1, Q3 | 0.0, 0.0 | 90.2, 659.3 | |
| Range | (0.0-878.2) | (0.0-3336.8) | |
| PLOD2_AVG_NORM | <0.0001 | ||
| N | 73 | 54 | |
| Mean (SD) | 44.5 (151.7) | 314.8 (1284.4) | |
| Median | 0.0 | 53.7 | |
| Q1, Q3 | 0.0, 0.0 | 2.3, 103.3 | |
| Range | (0.0-1124.0) | (0.0-9110.5) | |
| PLOD3_AVG_NORM | <0.0001 | ||
| N | 73 | 54 | |
| Mean (SD) | 2.7 (11.9) | 68.0 (81.2) | |
| Median | 0.0 | 38.3 | |
| Q1, Q3 | 0.0, 0.0 | 4.2, 101.9 | |
| Range | (0.0-87.4) | (0.0-330.2) | |
| PCOLCE2_AVG_NORM | 0.0010 | ||
| N | 73 | 54 | |
| Mean (SD) | 7.7 (25.8) | 6.4 (14.9) | |
| Median | 0.0 | 0.0 | |
| Q1, Q3 | 0.0, 0.0 | 0.0, 3.1 | |
| Range | (0.0-104.8) | (0.0-68.4) | |
| PCOLCE_AVG_NORM | 0.0232 | ||
| N | 73 | 54 | |
| Mean (SD) | 92.1 (159.7) | 170.4 (339.4) | |
| Median | 0.0 | 40.9 | |
| Q1, Q3 | 0.0, 122.2 | 0.0, 175.1 | |
| Range | (0.0-699.2) | (0.0-1945.2) | |
| PTK2_AVG_NORM | <0.0001 | ||
| N | 73 | 54 | |
| Mean (SD) | 2.8 (14.4) | 76.6 (81.8) | |
| Median | 0.0 | 70.0 | |
| Q1, Q3 | 0.0, 0.0 | 0.0, 127.7 | |
| Range | (0.0-116.5) | (0.0-323.3) | |
| CSRC_AVG_NORM | 0.0001 | ||
| N | 73 | 54 | |
| Mean (SD) | 19.0 (40.9) | 45.1 (65.9) | |
| Median | 0.3 | 19.6 | |
| Q1, Q3 | 0.0, 24.8 | 4.2, 46.6 | |
| Range | (0.0-266.6) | (0.0-290.2) | |
| CDKN1A_AVG_NORM | 0.0005 | ||
| N | 73 | 54 | |
| Mean (SD) | 78.5 (150.9) | 181.0 (271.7) | |
| Median | 0.0 | 84.2 | |
| Q1, Q3 | 0.0, 118.9 | 0.0, 253.3 | |
| Range | (0.0-788.2) | (0.0-1083.2) | |
| CDKN2A_AVG_NORM | 0.0002 | ||
| N | 73 | 54 | |
| Mean (SD) | 6.1 (19.6) | 9.7 (25.8) | |
| Median | 0.0 | 1.0 | |
| Q1, Q3 | 0.0, 0.0 | 0.0, 6.9 | |
| Range | (0.0-113.2) | (0.0-175.1) | |
| TP53_AVG_NORM | <0.0001 | ||
| N | 73 | 54 | |
| Mean (SD) | 40.6 (98.6) | 231.2 (289.8) | |
| Median | 0.0 | 166.9 | |
| Q1, Q3 | 0.0, 0.0 | 0.0, 359.9 | |
| Range | (0.0-410.8) | (0.0-1722.4) | |
| YAP_AVG_NORM | <0.0001 | ||
| N | 73 | 54 | |
| Mean (SD) | 7.8 (36.6) | 112.4 (161.4) | |
| Median | 0.0 | 63.1 | |
| Q1, Q3 | 0.0, 0.0 | 0.0, 173.5 | |
| Range | (0.0-246.3) | (0.0-769.0) | |
| TAZ_AVG_NORM | <0.0001 | ||
| N | 73 | 54 | |
| Mean (SD) | 12.2 (27.9) | 32.8 (44.3) | |
| Median | 0.0 | 15.0 | |
| Q1, Q3 | 0.0, 0.7 | 0.0, 49.0 | |
| Range | (0.0-122.7) | (0.0-186.4) | |
| MITF_AVG_NORM | <0.0001 | ||
| N | 73 | 54 | |
| Mean (SD) | 251.0 (399.5) | 569.8 (494.8) | |
| Median | 45.5 | 467.3 | |
| Q1, Q3 | 0.0, 331.5 | 184.9, 777.8 | |
| Range | (0.0-2143.3) | (0.0-2200.0) | |
| MLANA_AVG_NORM | 0.1823 | ||
| N | 73 | 54 | |
| Mean (SD) | 3596.0 (3671.3) | 4865.4 (4966.1) | |
| Median | 2446.8 | 2803.5 | |
| Q1, Q3 | 950.9, 5019.4 | 1210.7, 6773.0 | |
| Range | (14.0-17180.3) | (62.8-19672.1) | |
| TYR_AVG_NORM | 0.0040 | ||
| N | 73 | 54 | |
| Mean (SD) | 349.7 (301.8) | 839.8 (996.3) | |
| Median | 254.3 | 515.1 | |
| Q1, Q3 | 119.5, 527.5 | 161.0, 1244.9 | |
| Range | (0.0-1169.8) | (2.0-5500.0) | |
| POSTN_AVG_NORM | 0.0001 | ||
| N | 73 | 54 | |
| Mean (SD) | 1138.7 (2155.7) | 1933.9 (2318.1) | |
| Median | 191.6 | 1252.0 | |
| Q1, Q3 | 0.0, 1449.9 | 397.4, 2457.4 | |
| Range | (0.0-11078.1) | (0.0-11193.2) | |
| FBLN2_AVG_NORM | <0.0001 | ||
| N | 73 | 54 | |
| Mean (SD) | 2.1 (17.3) | 26.5 (42.2) | |
| Median | 0.0 | 0.0 | |
| Q1, Q3 | 0.0, 0.0 | 0.0, 48.8 | |
| Range | (0.0-148.2) | (0.0-150.9) | |
| TABLE D |
| Comparison of gene expression between benign and malignant |
| Benign | Malignant | ||
| (N = 73) | (N = 54) | p value | |
| CXCL1_AVG_NORM01 | <0.0001 | ||||
| Zero | 58 | (79.5%) | 12 | (22.2%) | |
| >0 | 15 | (20.5%) | 42 | (77.8%) | |
| CSF2_AVG_NORM01 | 0.0398 | ||||
| Zero | 15 | (20.5%) | 20 | (37.0%) | |
| >0 | 58 | (79.5%) | 34 | (63.0%) | |
| CCL2_AVG_NORM01 | <0.0001 | ||||
| Zero | 53 | (72.6%) | 12 | (22.2%) | |
| >0 | 20 | (27.4%) | 42 | (77.8%) | |
| IL8_AVG_NORM01 | <0.0001 | ||||
| Zero | 63 | (86.3%) | 10 | (18.5%) | |
| >0 | 10 | (13.7%) | 44 | (81.5%) | |
| IL6_AVG_NORM01 | <0.0001 | ||||
| Zero | 65 | (89.0%) | 13 | (24.1%) | |
| >0 | 8 | (11.0%) | 41 | (75.9%) | |
| ITGA5_AVG_NORM01 | <0.0001 | ||||
| Zero | 73 | (100.0%) | 38 | (70.4%) | |
| >0 | 0 | (0.0%) | 16 | (29.6%) | |
| ITGA3_AVG_NORM01 | <0.0001 | ||||
| Zero | 72 | (98.6%) | 13 | (24.1%) | |
| >0 | 1 | (1.4%) | 41 | (75.9%) | |
| ITGA2_AVG_NORM01 | 0.0007 | ||||
| Zero | 73 | (100.0%) | 46 | (85.2%) | |
| >0 | 0 | (0.0%) | 8 | (14.8%) | |
| ITGAV_AVG_NORM01 | <0.0001 | ||||
| Zero | 71 | (97.3%) | 24 | (44.4%) | |
| >0 | 2 | (2.7%) | 30 | (55.6%) | |
| ITGB3_AVG_NORM01 | <0.0001 | ||||
| Zero | 73 | (100.0%) | 30 | (55.6%) | |
| >0 | 0 | (0.0%) | 24 | (44.4%) | |
| ITGB1_AVG_NORM01 | <0.0001 | ||||
| Zero | 64 | (87.7%) | 11 | (20.4%) | |
| >0 | 9 | (12.3%) | 43 | (79.6%) | |
| FN1_AVG_NORM01 | <0.0001 | ||||
| Zero | 69 | (94.5%) | 2 | (3.7%) | |
| >0 | 4 | (5.5%) | 52 | (96.3%) | |
| THBS1_AVG_NORM01 | <0.0001 | ||||
| Zero | 73 | (100.0%) | 24 | (44.4%) | |
| >0 | 0 | (0.0%) | 30 | (55.6%) | |
| THBS2_AVG_NORM01 | <0.0001 | ||||
| Zero | 67 | (91.8%) | 23 | (42.6%) | |
| >0 | 6 | (8.2%) | 31 | (57.4%) | |
| THBS4_AVG_NORM01 | <0.0001 | ||||
| Zero | 58 | (79.5%) | 15 | (27.8%) | |
| >0 | 15 | (20.5%) | 39 | (72.2%) | |
| VCAN_AVG_NORM01 | <0.0001 | ||||
| Zero | 71 | (97.3%) | 16 | (29.6%) | |
| >0 | 2 | (2.7%) | 38 | (70.4%) | |
| BGAN_AVG_NORM01 | <0.0001 | ||||
| Zero | 42 | (57.5%) | 7 | (13.0%) | |
| >0 | 31 | (42.5%) | 47 | (87.0%) | |
| SPP1_AVG_NORM01 | <0.0001 | ||||
| Zero | 73 | (100.0%) | 12 | (22.2%) | |
| >0 | 0 | (0.0%) | 42 | (77.8%) | |
| TNC_AVG_NORM01 | <0.0001 | ||||
| Zero | 60 | (82.2%) | 3 | (5.6%) | |
| >0 | 13 | (17.8%) | 51 | (94.4%) | |
| SPARC_AVG_NORM01 | <0.0001 | ||||
| Zero | 57 | (78.1%) | 13 | (24.1%) | |
| >0 | 16 | (21.9%) | 41 | (75.9%) | |
| AGRN_AVG_NORM01 | <0.0001 | ||||
| Zero | 59 | (80.8%) | 5 | (9.3%) | |
| >0 | 14 | (19.2%) | 49 | (90.7%) | |
| CTGF_AVG_NORM01 | <0.0001 | ||||
| Zero | 72 | (98.6%) | 21 | (38.9%) | |
| >0 | 1 | (1.4%) | 33 | (61.1%) | |
| CYR61_AVG_NORM01 | <0.0001 | ||||
| Zero | 56 | (76.7%) | 9 | (16.7%) | |
| >0 | 17 | (23.3%) | 45 | (83.3%) | |
| LAMA3_AVG_NORM01 | 0.0003 | ||||
| Zero | 72 | (98.6%) | 43 | (79.6%) | |
| >0 | 1 | (1.4%) | 11 | (20.4%) | |
| LAMC1_AVG_NORM01 | <0.0001 | ||||
| Zero | 73 | (100.0%) | 24 | (44.4%) | |
| >0 | 0 | (0.0%) | 30 | (55.6%) | |
| LAMB1_AVG_NORM01 | <0.0001 | ||||
| Zero | 66 | (90.4%) | 22 | (40.7%) | |
| >0 | 7 | (9.6%) | 32 | (59.3%) | |
| LAMA1_AVG_NORM01 | <0.0001 | ||||
| Zero | 57 | (78.1%) | 16 | (29.6%) | |
| >0 | 16 | (21.9%) | 38 | (70.4%) | |
| LAMC2_AVG_NORM01 | 0.0003 | ||||
| Zero | 73 | (100.0%) | 45 | (83.3%) | |
| >0 | 0 | (0.0%) | 9 | (16.7%) | |
| LAMB3_AVG_NORM01 | 0.0061 | ||||
| Zero | 45 | (61.6%) | 20 | (37.0%) | |
| >0 | 28 | (38.4%) | 34 | (63.0%) | |
| COL1A1_AVG_NORM01 | <0.0001 | ||||
| Zero | 60 | (82.2%) | 17 | (31.5%) | |
| >0 | 13 | (17.8%) | 37 | (68.5%) | |
| COL4A1_AVG_NORM01 | <0.0001 | ||||
| Zero | 73 | (100.0%) | 13 | (24.1%) | |
| >0 | 0 | (0.0%) | 41 | (75.9%) | |
| COL18A1_AVG_NORM01 | <0.0001 | ||||
| Zero | 64 | (87.7%) | 18 | (33.3%) | |
| >0 | 9 | (12.3%) | 36 | (66.7%) | |
| LOX_AVG_NORM01 | <0.0001 | ||||
| Zero | 60 | (82.2%) | 26 | (48.1%) | |
| >0 | 13 | (17.8%) | 28 | (51.9%) | |
| LOXL1_AVG_NORM01 | <0.0001 | ||||
| Zero | 72 | (98.6%) | 23 | (42.6%) | |
| >0 | 1 | (1.4%) | 31 | (57.4%) | |
| LOXL2_AVG_NORM01 | <0.0001 | ||||
| Zero | 70 | (95.9%) | 19 | (35.2%) | |
| >0 | 3 | (4.1%) | 35 | (64.8%) | |
| LOXL3_AVG_NORM01 | <0.0001 | ||||
| Zero | 69 | (94.5%) | 10 | (18.5%) | |
| >0 | 4 | (5.5%) | 44 | (81.5%) | |
| LOXL4_AVG_NORM01 | 0.0006 | ||||
| Zero | 53 | (72.6%) | 23 | (42.6%) | |
| >0 | 20 | (27.4%) | 31 | (57.4%) | |
| PLOD1_AVG_NORM01 | <0.0001 | ||||
| Zero | 59 | (80.8%) | 12 | (22.2%) | |
| >0 | 14 | (19.2%) | 42 | (77.8%) | |
| PLOD2_AVG_NORM01 | <0.0001 | ||||
| Zero | 59 | (80.8%) | 10 | (18.5%) | |
| >0 | 14 | (19.2%) | 44 | (81.5%) | |
| PLOD3_AVG_NORM01 | <0.0001 | ||||
| Zero | 66 | (90.4%) | 11 | (20.4%) | |
| >0 | 7 | (9.6%) | 43 | (79.6%) | |
| PCOLCE2_AVG_NORM01 | 0.0002 | ||||
| Zero | 66 | (90.4%) | 34 | (63.0%) | |
| >0 | 7 | (9.6%) | 20 | (37.0%) | |
| PCOLCE_AVG_NORM01 | 0.0036 | ||||
| Zero | 42 | (57.5%) | 17 | (31.5%) | |
| >0 | 31 | (42.5%) | 37 | (68.5%) | |
| PTK2_AVG_NORM01 | <0.0001 | ||||
| Zero | 67 | (91.8%) | 16 | (29.6%) | |
| >0 | 6 | (8.2%) | 38 | (70.4%) | |
| CSRC_AVG_NORM01 | 0.0001 | ||||
| Zero | 36 | (49.3%) | 9 | (16.7%) | |
| >0 | 37 | (50.7%) | 45 | (83.3%) | |
| CDKN1A_AVG_NORM01 | 0.0001 | ||||
| Zero | 48 | (65.8%) | 16 | (29.6%) | |
| >0 | 25 | (34.2%) | 38 | (70.4%) | |
| CDKN2A_AVG_NORM01 | <0.0001 | ||||
| Zero | 57 | (78.1%) | 23 | (42.6%) | |
| >0 | 16 | (21.9%) | 31 | (57.4%) | |
| TP53_AVG_NORM01 | <0.0001 | ||||
| Zero | 59 | (80.8%) | 16 | (29.6%) | |
| >0 | 14 | (19.2%) | 38 | (70.4%) | |
| YAP_AVG_NORM01 | <0.0001 | ||||
| Zero | 68 | (93.2%) | 22 | (40.7%) | |
| >0 | 5 | (6.8%) | 32 | (59.3%) | |
| TAZ_AVG_NORM01 | <0.0001 | ||||
| Zero | 54 | (74.0%) | 19 | (35.2%) | |
| >0 | 19 | (26.0%) | 35 | (64.8%) | |
| MITF_AVG_NORM01 | <0.0001 | ||||
| Zero | 26 | (35.6%) | 2 | (3.7%) | |
| >0 | 47 | (64.4%) | 52 | (96.3%) | |
| MLANA_AVG_NORM01 | |||||
| >0 | 73 | (100.0%) | 54 | (100.0%) | |
| TYR_AVG_NORM01 | 0.2202 | ||||
| Zero | 2 | (2.7%) | 0 | (0.0%) | |
| >0 | 71 | (97.3%) | 54 | (100.0%) | |
| POSTN_AVG_NORM01 | <0.0001 | ||||
| Zero | 32 | (43.8%) | 4 | (7.4%) | |
| >0 | 41 | (56.2%) | 50 | (92.6%) | |
| FBLN2_AVG_NORM01 | <0.0001 | ||||
| Zero | 71 | (97.3%) | 31 | (57.4%) | |
| >0 | 2 | (2.7%) | 23 | (42.6%) | |
| TABLE E | |||||||
| MM79_CN | MM80_CN | MM81_CN | MM82_CN | AVG | |||
| AVG | AVG | AVG | AVG | per | |||
| per copy | per copy | per copy | per copy | copy | |||
| K14 | K14 | K14 | K14 | K14 | STDEV | % STDEV | |
| KRT14_AVG_NORM | 1 | 1 | 1 | 1 | 1 | 0.000 | |
| KRT10_AVG_NORM | 2.209 | 2.229 | 2.92 | 3.015 | 2.593 | 0.434 | 17% |
| MITF_AVG_NORM | 0.021 | 0.018 | 0.016 | 0.015 | 0.018 | 0.003 | 15% |
| MLANA_AVG_NORM | 0.021 | 0.018 | 0.016 | 0.015 | 0.018 | 0.003 | 15% |
| TYR_AVG_NORM | 0.004 | 0.002 | 0.002 | 0.001 | 0.002 | 0.001 | 56% |
| PMEL_AVG_NORM | 0.025 | 0.027 | 0.03 | 0.018 | 0.025 | 0.005 | 20% |
| FN1_AVG_NORM | 0.077 | 0.065 | 0.035 | 0.042 | 0.055 | 0.020 | 36% |
| SPARC_AVG_NORM | 1.294 | 1.143 | 0.568 | 1.707 | 1.178 | 0.471 | 40% |
| AGRN_AVG_NORM | 0.004 | 0.006 | 0.003 | 0.002 | 0.004 | 0.002 | 46% |
| THBS1_AVG_NORM | 0.064 | 0.015 | 0.018 | 0.005 | 0.026 | 0.026 | 103% |
| THBS2_AVG_NORM | 0.366 | 0.061 | 0.104 | 0.057 | 0.147 | 0.148 | 100% |
| THBS4_AVG_NORM | 0.018 | 0.006 | 0.005 | 0.001 | 0.008 | 0.007 | 98% |
| VCAN_AVG_NORM | 0.095 | 0.034 | 0.04 | 0.027 | 0.049 | 0.031 | 64% |
| BGAN_AVG_NORM | 0.015 | 0.027 | 0.014 | 0.015 | 0.018 | 0.006 | 35% |
| COL1A1_AVG_NORM | 1.695 | 3.44 | 0.689 | 6.695 | 3.130 | 2.635 | 84% |
| COL4A1_AVG_NORM | 0.069 | 0.026 | 0.03 | 0.016 | 0.035 | 0.023 | 66% |
| COL4A2_AVG_NORM | 0.115 | 0.042 | 0.041 | 0.004 | 0.051 | 0.046 | 92% |
| COL18A1_AVG_NORM | 0.015 | 0.009 | 0.005 | 0.002 | 0.008 | 0.006 | 73% |
| CTGF_AVG_NORM | 0.012 | 0.008 | 0.016 | 0.004 | 0.010 | 0.005 | 52% |
| LOX_AVG_NORM | 0.029 | 0.021 | 0.028 | 0.021 | 0.025 | 0.004 | 18% |
| LOXL1_AVG_NORM | 0.015 | 0.009 | 0.016 | 0.015 | 0.014 | 0.003 | 23% |
| LOXL2_AVG_NORM | 0.016 | 0.011 | 0.008 | 0.006 | 0.010 | 0.004 | 42% |
| LOXL3_AVG_NORM | 0.003 | 0.002 | 0.002 | 0.001 | 0.002 | 0.001 | 41% |
| LOXL4_AVG_NORM | 0.02 | 0.004 | 0.003 | 0.001 | 0.007 | 0.009 | 125% |
| PLOD2_AVG_NORM | 0.018 | 0.014 | 0.007 | 0.001 | 0.010 | 0.008 | 75% |
| PLOD1_AVG_NORM | 0.069 | 0.053 | 0.026 | 0.017 | 0.041 | 0.024 | 58% |
| SPP1_AVG_NORM | 0.092 | 0.002 | 0.007 | 0 | 0.025 | 0.045 | 177% |
| TNC_AVG_NORM | 0.025 | 0.02 | 0.027 | 0.013 | 0.021 | 0.006 | 29% |
| PCOLCE2_AVG_NORM | 0.011 | 0.001 | 0.006 | 0 | 0.005 | 0.005 | 113% |
| PCOLCE_AVG_NORM | 0.028 | 0.049 | 0.032 | 0.04 | 0.037 | 0.009 | 25% |
| PLOD3_AVG_NORM | 0.03 | 0.006 | 0.007 | 0.002 | 0.011 | 0.013 | 113% |
| ITGB3_AVG_NORM | 0.03 | 0.006 | 0.007 | 0.002 | 0.011 | 0.013 | 113% |
| ITGB1_AVG_NORM | 0.164 | 0.054 | 0.074 | 0.038 | 0.083 | 0.056 | 68% |
| FBLN2_AVG_NORM | 0.049 | 0.022 | 0.02 | 0.016 | 0.027 | 0.015 | 56% |
| CYR61_AVG_NORM | 0.006 | 0.002 | 0.003 | 0 | 0.003 | 0.003 | 91% |
| ITGA5_AVG_NORM | 0.011 | 0.005 | 0.007 | 0.003 | 0.007 | 0.003 | 53% |
| ITGA3_AVG_NORM | 0.016 | 0.008 | 0.006 | 0.008 | 0.010 | 0.004 | 47% |
| ITGA2_AVG_NORM | 0.08 | 0.034 | 0.019 | 0.084 | 0.054 | 0.033 | 60% |
| ITGAV_AVG_NORM | 0.013 | 0.005 | 0.003 | 0.003 | 0.006 | 0.005 | 79% |
| CSRC_AVG_NORM | 0.006 | 0.003 | 0.005 | 0.001 | 0.004 | 0.002 | 59% |
| PTK2_AVG_NORM | 0.035 | 0.02 | 0.011 | 0.009 | 0.019 | 0.012 | 63% |
| POSTN_AVG_NORM | 0.077 | 0.092 | 0.117 | 0.193 | 0.120 | 0.052 | 43% |
| YAP_AVG_NORM | 0.079 | 0.029 | 0.033 | 0.031 | 0.043 | 0.024 | 56% |
| CXCL1_AVG_NORM | 0.002 | 0 | 0 | 0 | 0.001 | 0.001 | 200% |
| CSF2_AVG_NORM | 0.002 | 0 | 0 | 0 | 0.001 | 0.001 | 200% |
| CCL2_AVG_NORM | 0.039 | 0.018 | 0.013 | 0.008 | 0.020 | 0.014 | 70% |
| IL8_AVG_NORM | 0.003 | 0 | 0.001 | 0 | 0.001 | 0.001 | 141% |
| IL6_AVG_NORM | 0.001 | 0 | 0 | 0 | 0.000 | 0.001 | 200% |
| LAMA3_AVG_NORM | 0.038 | 0.012 | 0.021 | 0.011 | 0.021 | 0.013 | 61% |
| TP53_AVG_NORM | 0.08 | 0.04 | 0.039 | 0.052 | 0.053 | 0.019 | 36% |
| CDKN1A_AVG_NORM | 0.057 | 0.029 | 0.037 | 0.014 | 0.034 | 0.018 | 52% |
| CDKN2A_AVG_NORM | 0.003 | 0.001 | 0.001 | 0 | 0.001 | 0.001 | 101% |
| TAZ_AVG_NORM | 0.026 | 0.008 | 0.008 | 0.003 | 0.011 | 0.010 | 90% |
| LAMC1_AVG_NORM | 0.062 | 0.013 | 0.016 | 0.008 | 0.025 | 0.025 | 101% |
| LAMB1_AVG_NORM | 0.046 | 0.019 | 0.026 | 0.008 | 0.025 | 0.016 | 65% |
| LAMA1_AVG_NORM | 0.007 | 0 | 0.001 | 0 | 0.002 | 0.003 | 168% |
| LAMC2_AVG_NORM | 0.034 | 0.009 | 0.012 | 0.016 | 0.018 | 0.011 | 63% |
| LAMB3_AVG_NORM | 0.042 | 0.016 | 0.026 | 0.017 | 0.025 | 0.012 | 48% |
| PLAT_AVG_NORM | 0.032 | 0.02 | 0.034 | 0.04 | 0.032 | 0.001 | 27% |
| CSK_AVG_NORM | 0.027 | 0.034 | 0.021 | 0.041 | 0.031 | 0.001 | 28% |
| GDF15_AVG_NORM | 0.029 | 0.019 | 0.033 | 0.019 | 0.025 | 0.001 | 28% |
| FARP1_AVG_NORM | 0.019 | 0.029 | 0.022 | 0.031 | 0.025 | 0.001 | 22% |
| ARPC1B_AVG_NORM | 0.015 | 0.03 | 0.042 | 0.018 | 0.026 | 0.012 | 47% |
| NES_AVG_NORM | 0.114 | 0.125 | 0.112 | 0.084 | 0.109 | 0.017 | 16% |
| NTRK3_AVG_NORM | 0.021 | 0.025 | 0.022 | 0.033 | 0.025 | 0.001 | 25% |
| SNX17_AVG_NORM | 0.112 | 0.099 | 0.089 | 0.123 | 0.106 | 0.015 | 14% |
| L1CAM_AVG_NORM | 0.017 | 0.04 | 0.01 | 0.024 | 0.023 | 0.013 | 56% |
| CD44_AVG_NORM | 0.112 | 0.089 | 0.09 | 0.123 | 0.104 | 0.017 | 16% |
The results provided herein demonstrate the development of a method for determining absolute levels (copy numbers) of genes of interest (e.g., FN-associated genes) from paraffin-embedded tissue by generating a highly defined internal standard that can be regenerated indefinitely. This standardization approach can allow for the comparison of results from independent experiments and thus, allows for extensive validation. The RT-PCR not only produced strong signals from highly degraded RNA due to FFPE embedding, but also was amendable to high-throughput analysis and was highly cost effective. While the methods provided herein were validated for melanoma, these methods are likely applicable to other human cancers. The results provided herein also demonstrate the discrimination between benign and malignant pigmented lesions based on multiple markers.
Other Embodiments
It is to be understood that while the invention has been described in conjunction with the detailed description thereof, the foregoing description is intended to illustrate and not limit the scope of the invention, which is defined by the scope of the appended claims. Other aspects, advantages, and modifications are within the scope of the following claims.
Claims
What is claimed is:1. A kit for identifying a malignant skin lesion, wherein the kit comprises:
(a) primer pairs for determining, within a test sample, the expression level of the marker genes PLAT, ITGB3, and IL8 to obtain a measured expression level of the marker gene for the test sample, and
(b) a control nucleic acid for each of the primer pairs, wherein each control nucleic acid comprises a target nucleic acid for one of the primer pairs, wherein each of the control nucleic acids is cDNA specific for cDNA and not genomic DNA.
2. The kit of claim 1, wherein the kit further comprises:
(c) a primer pair for determining, within a test sample, the expression level of the marker gene GDF15, to obtain a measured expression level of the marker gene for the test sample, and
(d) a control nucleic acid for the primer pairs, wherein the control nucleic acid comprises a target nucleic acid for the primer pairs, and wherein the control nucleic acid is cDNA specific for cDNA and not genomic DNA.
3. The kit of claim 1, wherein the kit further comprises a primer pair for determining, within the test sample, the expression level of a keratinocyte marker gene to obtain a measured expression level of the keratinocyte marker gene for the test sample.
4. The kit of claim 3, wherein the keratinocyte marker gene is K14.
5. A method for identifying a malignant skin lesion, wherein the method comprises:
(a) determining, within a test sample, the expression level of a marker gene selected from the group consisting of PLAT, SPP1, TNC, ITGB3, COL4A1, CD44, CSK, THBS1, CTGF, VCAN, FARP1, GDF15, ITGB1, PTK2, PLOD3, ITGA3, IL8, CDKN2A, and CXCL1 to obtain a measured expression level of the marker gene for the test sample,
(b) determining, within the test sample, the expression level of a keratinocyte marker gene to obtain a measured expression level of the keratinocyte marker gene for the test sample,
(c) removing, from the measured expression level of the marker gene for the test sample, a level of expression attributable to keratinocytes present in the test sample using the measured expression level of the keratinocyte marker gene for the test sample and a keratinocyte correction factor to obtain a corrected value of marker gene expression for the test sample, and
(d) identifying the test sample as containing a malignant skin lesion based, at least in part, on the corrected value of marker gene expression for the test sample.
6. A kit for identifying a malignant skin lesion, wherein the kit comprises:
(a) a primer pair for determining, within a test sample, the expression level of a marker gene selected from the group consisting of PLAT, SPP1, TNC, ITGB3, COL4A1, CD44, CSK, THBS1, CTGF, VCAN, FARP1, GDF 15, ITGB 1, PTK2, PLOD3, ITGA3, IL8, CDKN2A, and CXCL1 to obtain a measured expression level of the marker gene for the test sample, and
(b) a primer pair for determining, within the test sample, the expression level of a keratinocyte marker gene to obtain a measured expression level of the keratinocyte marker gene for the test sample.
Images & Drawings included:
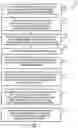


Sources:
- United States Patent and Trademark Office - verify current appl. status at the USPTO↗
Similar patent applications:
Recent applications in this class:
- » 20250290156 2025-09-18
EVALUATING OVARIAN CANCER CHEMOTHERAPY RESPONSE USING GENE EXPRESSION DATA AND MACHINE LEARNING - » 20250290155 2025-09-18
CLINICAL WORKFLOW FOR TREATMENT OF BREAST CANCER - » 20250290154 2025-09-18
PREDICTIVE MARKERS FOR IMMUNOTHERAPY - » 20250290153 2025-09-18
METHODS OF DIAGNOSING, DETERMINING THE PROGRESSION OF, AND TREATING A PROSTATE CANCER - » 20250290152 2025-09-18
GENETIC TRIO OF BRAF AND TERT MUTATIONS AND RS2853669TT IN PAPILLARY THYROID CANCER AGGRESSIVENESS - » 20250290151 2025-09-18
Differentially-Methylated Regions of the Genome Useful as Markers of Embryo-Adult Transitions - » 20250290150 2025-09-18
METHODS AND SYSTEMS FOR CHARACTERIZATION, DIAGNOSIS, AND TREATMENT OF CANCER - » 20250290149 2025-09-18
SYSTEMS AND METHODS FOR ENRICHING CELL-FREE MICROBIAL NUCLEIC ACID MOLECULES - » 20250290148 2025-09-18
DIFFERENTIAL ALTERNATIVE SPLICING IN RELAPSED AND REFRACTORY DIFFUSE LARGE-B CELL LYMPHOMA PATIENTS RECEIVING CAR-T THERAPY - » 20250290147 2025-09-18
PROSTATE CANCER MARKERS
Recent applications for this Assignee:
- » 20250284950 2025-09-11
SYSTEM, METHOD, AND APPARATUS FOR IDENTIFYING CONGENITAL LONG QT SYNDROME IN A SUBJECT - » 20250278610 2025-09-04
APPARATUS AND METHOD FOR TRAINING AN ARTIFICIAL INTELLIGENCE-SUPPORTED DIAGNOSTIC ASSESSMENT TOOL - » 20250258158 2025-08-14
BIOMARKERS FOR DETECTION AND TREATMENT ASSESSMENT OF INFECTIOUS DISEASES AND DISORDERS - » 20250251110 2025-08-07
ILLUMINATION ASSEMBLY INCLUDING A MICROLENS ARRAY - » 20250241676 2025-07-31
MEDICAL APPARATUS GUIDANCE SYSTEMS AND METHODS - » 20250229052 2025-07-17
MULTIMODAL PAIN MANAGEMENT SYSTEMS AND METHODS - » 20250197517 2025-06-19
TRAILshort ANTIBODY AND METHODS OF USE - » 20250171547 2025-05-29
EPHA3 DIRECTED CAR-T CELLS FOR TREATMENT OF TUMORS - » 20250170067 2025-05-29
Carrier-Binding Agent Compositions and Methods of Making and Using the Same - » 20250170054 2025-05-29
APPLICATIONS AND IMAGING OF SHEAR-THINNING BIOMATERIAL