Method of adjusting and controlling the receiver power adaptation according to the transmission environment in eNodeB LTE system
US20200099409A1
2020-03-26
16/579,029
2019-09-23
✅ Patent granted
US 10,911,083 B2
2021-02-02
-
-
Syed Ali
PatentTM.US
2039-09-23
Abstract:
A power control and correction method capable of adapting to each type of transmission environment, addressing interference problems of user devices in the network, and ensuring good signal quality for signal decoding. The method adjusts and controls the receiver power adaptation according to the transmission environment in the eNodeB LTE system.
Inventors:
- TRUNG TIEN NGUYEN 3 🇻🇳 Ha Noi City, Vietnam
- THI XUAN HOA HO 2 🇻🇳 Ha Noi City, Vietnam
- XUAN HAO LUONG 3 🇻🇳 Ha Noi City, Vietnam
- TRUONG GIANG LE 4 🇻🇳 Ha Noi City, Vietnam
- TUAN DUC VU 3 🇻🇳 Ha Noi City, Vietnam
- Truong Giang Le 2 🇻🇳 Ha Noi, Vietnam
- Trung Tien Nguyen 1 🇻🇳 Ha Noi, Vietnam
- Thi Xuan Hoa Ho 1 🇻🇳 Ha Noi, Vietnam
- Xuan Hao Luong 1 🇻🇳 Ha Noi, Vietnam
- Tuan Duc Vu 1 🇻🇳 Ha Noi, Vietnam
Assignee:
- VIETTEL GROUP 128 🇻🇳 Ha Noi City, Vietnam
- VIETTEL GROUP 44 🇻🇳 Ha Noi, Vietnam
Applicant:
Interested in similar patents?
Get notified when new applications in this technology area are published.
Classification:
H04B1/1027 » CPC main
Details of transmission systems, not covered by a single one of groups - ; Details of transmission systems not characterised by the medium used for transmission; Receivers; Means associated with receiver for limiting or suppressing noise or interference assessing signal quality or detecting noise/interference for the received signal
H04W72/0413 » CPC further
Local resource management, e.g. wireless traffic scheduling or selection or allocation of wireless resources; Wireless resource allocation involving control information exchange between nodes in uplink direction of a wireless link, i.e. towards network
H04B17/318 » CPC further
Monitoring; Testing of propagation channels; Measuring or estimating channel quality parameters Received signal strength
H04B1/123 » CPC further
Details of transmission systems, not covered by a single one of groups - ; Details of transmission systems not characterised by the medium used for transmission; Receivers; Means associated with receiver for limiting or suppressing noise or interference; Neutralising, balancing, or compensation arrangements using adaptive balancing or compensation means
H04W72/04 IPC
Local resource management, e.g. wireless traffic scheduling or selection or allocation of wireless resources Wireless resource allocation
H04W72/082 » CPC further
Local resource management, e.g. wireless traffic scheduling or selection or allocation of wireless resources; Wireless resource allocation based on quality criteria where an allocation plan is defined using the level of interference
H04B1/10 IPC
Details of transmission systems, not covered by a single one of groups - ; Details of transmission systems not characterised by the medium used for transmission; Receivers Means associated with receiver for limiting or suppressing noise or interference
H04W72/08 IPC
Local resource management, e.g. wireless traffic scheduling or selection or allocation of wireless resources; Wireless resource allocation based on quality criteria where an allocation plan is defined
H04B1/12 IPC
Details of transmission systems, not covered by a single one of groups - ; Details of transmission systems not characterised by the medium used for transmission; Receivers; Means associated with receiver for limiting or suppressing noise or interference Neutralising, balancing, or compensation arrangements
H04B17/336 » CPC further
Monitoring; Testing of propagation channels; Measuring or estimating channel quality parameters Signal-to-interference ratio [SIR] or carrier-to-interference ratio [CIR]
Description
TECHNICAL FIELD
The invention deals with a way to adjust and control the power of the receiver side, which can adapt to many transmission environments of the eNodeB system to optimize and increase the system processing performance.
TECHNICAL STATUS OF THE INVENTION
In general telecommunication systems and eNodeB systems in particular, the control of receiver equipment has an important role and directly affects the quality and throughput of the entire network. Furthermore, Long Term Evolution (LTE) uses wide spectrum in a network cell, so it is easily affected by interference between network cell components and neighboring cells. Currently, all devices in the network are initially initialized to the same capacity with different types of terrain, environment, which leads to the ability of the control to not be able to kept up. At the same time, the noise in the network cell will be large because the devices are transmitting a huge power or the quality of the reception signal is bad, which affects the decoding of the reception signal. Thus, adaptive control and noise reduction in network cells play an important role in system quality and performance.
Currently, there are some solutions of equipment manufacturers such as NOKIA, ERRICSON, HUAWEI to also use power control method based on the quality report of the received side. This method is described as follows: setting a unique initialization parameter for Open-loop control of P0 and alpha values, from this value combined with the path loss estimate value transmission by user equipment (User Equipment—UE) reports to eNodeB via PL (Path-Loss), which in turn calculates the remaining power that this UE can deliver to increase or decrease the capacity according to each data cycle. After that, the power control will switch to closed control (Close-loop) according to the standards of the 3rd Generation Partnership Project (3GPP).
Recently, NOKIA added a method to measure the total data power of the data through the Received Signal Strength Indication (RSSI) to increase the reliability of controlling each UE data for the part. Close-loop control, reducing errors when increasing or decreasing the expected capacity with actual capacity.
However, the above solutions have some disadvantages:
-
- The above solutions have the same initial capacity initialization problem with different types of terrain and environment, which leads to the ability of the control that cannot be timely responded to. Although there is an offset of closed-loop control, it is not possible to achieve power balance as well as optimal performance for each type of network deployment environment.
- In addition, the initialization of the initialization will cause the interference effect in large network cells (cells) because the devices all generate large capacity or poor signal quality, which affects the results of the decoding. The receiver effect, because the initialization process cannot get a closed tuning intervention according to 3GPP's proposed standards.
TECHNICAL NATURE OF THE INVENTION
Therefore, the purpose of the present invention is to create a new power control and correction method capable of adapting to each type of transmission environment, addressing interference problems of user devices in the network and ensuring good signal quality for signal decoding.
In order to achieve the above-mentioned purpose, the present invention provides a method for adjusting and controlling the receiver power adaptation according to the transmission environment in the eNodeB LTE system, including:
- a) Set up initialization parameters and input data collection system including the following steps:
- ai) initializes the system setup with the number of input antennas and corresponding bandwidth,
- aii) set initialization parameters for non-closed (Open-Loop) P0 and alpha power control values; where P0 is the absolute initial capacity for the uplink user data channel (Physical Uplink Shared Channel—PUSCH), alpha is the relative value of the power of the user device (User Equipment—UE) with the current location when accessing,
- aiii) Measure and obtain statistics the input parameter set including: Signal per Interference and Noise Ratio (SINR), Received Signal Strength Indication (RSSI), relative position the predetermined device (Timing Advance—TA) and noise (Noise plus Interference—NI) according to the N pattern cycle through the collection software—real-time calculation,
- b) Standardization, data assessment and classification of typical environments include the following steps:
- bi) calculate the average real SINR value of N samples collected in step aiii) by the following formula:
SINR_sample_i=(P0+alpha*PL+delta_pusch+f_i)*2−NI+153
In which:
-
-
- SINR_sample_i is the average real SINR value of the sample i;
- delta_pusch is the data channel coefficient of the uplink user, the value assigned is 0;
- f_i is the sample i of the offset update index, the value assigned to 0;
- NI is interference index and standard noise;
- P0 and alpha are described above;
- bii) standardize the collected data according to the input parameter set;
- biii) compare the post-standardized value at the bii step) with the setting value of the environment to separate each type of typical environment by using a percentage assessment method against the input N sample, in there:
- if the percentage of the RSSI value is less than 40% samples, then the RSSI state check flag is equal to 1, at which time the typical environment type 1 is differentiated;
- if the percentage of NI value is bigger than 10% samples, the NI state check flag is equal to 1, at which time the typical environment type 2 is differentiated;
- if the percentage of TA value is bigger than 10% samples, the TA status flag is equal to 1, at which time the typical environment type 3 is differentiated;
- if the percentage of SINR value is bigger than 15% and decoding wrong data (Ratio_SINR_low_fail>15%), the SINR flag is equal to 1, at which time the typical environment type 4 is differentiated;
-
- c) calculate, adjust and apply environmental adaptive control over time including the following steps:
- ci) perform the environmental mapping defined in step biii) with the reference table of reference quality value of the signal according to each type of data modulation,
- cii) calculate the delta_sinr difference between the SINRs obtained in step ci) and the ball step),
- ciii) compare the calculated value in step cii) with the sampling rate repeated by bandwidth according to the following formula:
t_rep = ⌊ 10 * ( log 10 nRB ) t_sam ⌋
In which:
-
-
- t_rep is the filtering index that determines the difference with maximum standard for each bandwidth;
- t_sam is the compatibility ratio corresponding to each bandwidth; and
- nRB is the maximum number of physical resources corresponding to each bandwidth;
- civ) the final decision will follow the following principle:
- if the delta_sinr value calculated in step cii) is greater than the value t_rep calculated in step ciii) then perform the value update and decide to adjust the coefficient P0 and alpha by repeating the set of parameters P0 and alpha until when the state of the delta_sinr value is less than the value of t_rep;
- in case this state is not reached, the exception option that satisfies the condition of the SINR value calculated in the ball step) is between 128 and 135, and the current value of P0 and alpha is stored, if outside this range, increase P0 value by 2 units;
- if the delta_sinr value calculated in step cii) is less than the value t_rep calculated in step ciii), update the current value of P0 and alpha.
-
According to the method of the present invention, the collection and standardization, data evaluation and classification of specific environments and comparisons determine how to update the value of P0 and alpha as the key points for adjustment and control adaptive transmission capacity according to eNodeB transmission environment.
BRIEF DESCRIPTION OF DRAWINGS
The purposes, aspects, signs and advantages of the above invention will become clear and understood more easily by referring to the following description in conjunction with the accompanying drawings, in which:
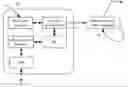
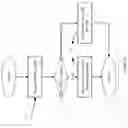
FIG. 1 is a block diagram that describes the overall setup of a UE user device synchronization system with the original tape processing system (Baseband Card—BBU/remote radio unit (Remote Radio Unit—RRU) apply the method of the invention.
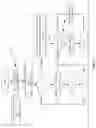
FIG. 2 is a block diagram view that describes the processing data flow between the physical layer processor and the collection software—real-time computing.
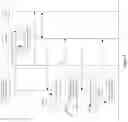
FIG. 3 is a block diagram drawing depicting the main components of a software collection—real-time calculation.
FIG. 4 is a diagram of a block diagram describing the algorithm and processing flow of an environmental response adjustment method.
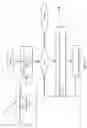
FIG. 5 is a diagram of a block diagram describing the algorithm of standardizing noise data and interference (Noise plus Interference—NI) and data computation method for NI.
FIG. 6 is a diagram of a block diagram describing the algorithm to standardize the Received Signal Strength Indication (RSSI) and the method of calculating data differentiation for RSSI.
FIG. 7 is a block diagram of the model describing the device's standardization of relative position data (Timing Advance—TA) and the method of calculating data differentiation for TA.
FIG. 8 is a block diagram that describes the algorithm of standardizing the signal quality ratio data on the noise interference SINR (Signal per Interference and Noise Ratio—SINR) and the method of calculating data differentiation for SINR.
FIG. 9 is a data flow diagram showing the communication between the collected software—real-time computing, UE, CTC/BBC and RRU user devices.
FIG. 10 is a block diagram drawing of a typical environmental decision algorithm and reference table for each environment.
FIG. 11 is a diagram of a block diagram describing the algorithm for calculating the value of each SINR sample before putting it into reference.
FIG. 12 is a block diagram depicting the algorithm and decides to update the P0 and alpha values for the environment-adjusted system.
FIG. 13 is a block diagram drawing of an algorithm that updates the P0 and alpha values for exceptions.
FIG. 14 is a drawing depicting how to set up the system and apply the invention in the eNodeB lab of VIETTEL.
DETAILED DESCRIPTION OF THE INVENTION
In the system optimization of eNodeB system, the control of power of the receiver line plays an important role, to achieve the optimal control, it is necessary to overcome the disadvantages of the current and capable power control method. ability to adjust according to each type of transmission environment.
FIG. 1 shows an overview of a complete system that meets the requirements of adapting and controlling the power of the adaptive power factor according to the transmission environment in the eNodeB system. In this system, the baseband unit (BBU) block consists of three baseband processing circuits (Baseband Card—BBC) connected to the RRU block through the common transmission interface standard (Common Public). Radio Interface (CPRI), and a block of control traffic cards (Control Transport Card—CTC) that provide clock synchronization from a global positioning satellite source (Global Position Satellite—GPS) or synchronous source 1588. In addition, some initial configuration information of the system was updated from CTC to BBC. In this model, user equipment (UE) will perform high-frequency radio signal exchange for each RRU antenna. The data after going through the RRU will be lowered in frequency and converted to analog, digital data obtained will be sent to the BBC block via CPRI protocol. Real-time data acquisition and calculation software will decode data and estimate channel estimates for each message transfer between physical layer controller and environment access control layer processor (Medium Access Control—MAC) with UE. The information collected in this software will then analyze the exchange environment between the UE and eNodeB groups, thereby applying the calibration method to suit each environmental group in controlling the power of the receiver line. Thereby increasing the ability to decode successfully, reducing interference between devices within the coverage of eNodeB, saving UE's power and reducing energy consumption during use. At the same time, overcome the disadvantages of using only an initial value of power for all working environments, and then proceed with closed cyclic control with maximum jump every increase or decrease. UE output is 3 dB leading to low response.
FIG. 2 describes in detail the operation of the original tape processing unit on the BBC including the physical layer processor and the MAC layer processor combined with the collection software—real-time computing. The steps are as follows:
-
- Step 1: Perform data exchange between UE and eNodeB after lowering frequency and converting to digital form through CPRI block.
- Step 2: The physical layer processing unit will take data on the CPRI data storage area to decode and transfer the result after decoding via IPC (Inter-process Communication) block to the shared access memory.
- Step 3: On this shared access device, the MAC layer processor will retrieve decode information and send scheduling information to the physical layer processor.
- Step 4: Receive data after decoding and access by real-time collecting-calculating software.
- Step 5: Implement the standardization method, evaluate and isolate the transmission medium on this software.
- Step 6: Send the final updated results to the control configuration as detailed in FIG. 12 and FIG. 13.
FIG. 9 is a flowchart detailing the controller's communication processing sequence—calculating throughput, signal generators, CTC/BBC and RRU during the entire real-time closed real-time execution process processing. The order of the processing flow is numbered accordingly as an example of the invention's implementation method.
FIGS. 3 and 4 describe in detail the main processing unit and the operation of the acquisition software—real-time computation and use of the results to make adjustments and controls tailored to each individual environment, the steps are as follows:
-
- Step 1: Initialize P0 and alpha power control values for the system
- Step 2: Perform statistical measurement of n samples through software collecting—calculating real-time. Information includes blocks as follows:
- NI value and distribution statistic: statistics about the value and distribution of noise and noise.
- RSSI value and distribution statistics: statistics about the value and distribution of the signal strength index.
- the set of statistical values assesses the transmission rate failure due to poor signal quality: statistics on values and SINR distribution provided that decoding fails.
- Ministry of statistics of value and assessment of transmission rate with change of data location of users: statistics on TA value and distribution.
- Step 3: Standardize data and classify typical environment types. Summary of data normalization assessment and decision on typical environment type
- Differentiate environment 1 with reference point SINR value 1.
- Dividing environment 2 with reference point SINR value 2.
- Dividing environment 3 with reference point SINR value 3.
- Differentiate environment 4 with reference point SINR value 4.
- Summarize and produce SINR target with corresponding environment.
- Step 4: Calculate the average real SINR value of n samples.
- Step 5: Calculate the reference SINR value corresponding to the typical environment.
- Step 6: Find the difference index between real SINR and reference SINR.
- Step 7: Perform a full scan of valid P0 and alpha values.
- Step 8: Decide the value of P0 and alpha corresponding to correction conditions.
- Step 9: Update the P0 and alpha values for the system.
FIG. 5 describes in detail the standardized collection algorithm and evaluation of NI value of eNodeB system, the steps are as follows:
-
- Step 1: Initialize the loop value i=0, count variables count=0 along with the number of samples is a given N.
- Step 2: Storing the NI value of N samples through the NI information storage bulletin part of the NI statistics and distribution, NI Collection unit of dBm symbol (NI_dBm).
- Step 3: Implement standardization of data according to the algorithm unit according to the following formula
NI=(NI_dBm+136)*2
-
- Step 4: Perform index iteration from i to N,
- If i<N is correct, continue checking the condition
- If the value NI>55 is correct:
- Then increase the count by 1 unit then increase the variable I by 1 unit
- If NI value <55 is wrong:
- Then increase the count I variable to 1 unit.
- The loop cycle in case of still meeting the condition code i<N.
- If the value NI>55 is correct:
- Where i<N is wrong
- End the iteration process, switch to scaling according to the sample method, in which the number of countable samples NI>55 is the count value and N the survey sample. The formula converted as follows:
- If i<N is correct, continue checking the condition
- Step 4: Perform index iteration from i to N,
Ratio_NI _high = ( Count * 100 ) N
-
-
-
- where Ratio_NI_high represents a high NI with a value greater than 55.
-
- Step 5: Store the calculation value of Ratio_NI_high above and conduct the check
-
- In case Ratio_NI_high>10% is true:
- Then update NI check flag status to 1.
- In case Ratio_NI_high>10% is false:
- Then update the state of the NI test flag by 0.
- Store this state on the clipboard to serve the environment decomposition shown in FIG. 10. Then finish the program.
- In case Ratio_NI_high>10% is true:
-
-
FIG. 6 shows a detailed description of the algorithm for standardizing and evaluating the RSSI value of the eNodeB system, the steps are as follows:
-
- Step 1: Initialize the loop value i=0, count variables count=0 along with the number of samples is a given N.
- Step 2: Store the RSSI value of N samples through the RSSI information store of the set of value statistics and RSSI distribution, the value collector RSSI unit of dBm symbol (RSSI_dBm).
- Step 3: Standardize data according to algorithm unit by the following formula:
RSSI=(RSSI dBm+136)*2
-
- Step 4: Perform index iteration from i to N,
- If i<N is correct, continue checking the condition
- If the value of RSSI<45 is correct:
- Then increase the count variable to 1 unit then increase the variable i to 1 unit
- If the value of RSSI>45 is wrong:
- Then increase the count variable i to 1 unit.
- The loop cycle in case of still meeting the condition code i<N.
- If the value of RSSI<45 is correct:
- Where i<N is wrong
- The end of the iteration process ends, converting to a percentage conversion by the percentage method, in which the number of countable samples RSSI <45 is the count and N sample of the survey. The formula converted as follows:
- If i<N is correct, continue checking the condition
- Step 4: Perform index iteration from i to N,
Ratio_RSSI _low = ( Count * 100 ) N
-
-
-
- In where Ratio_NI_high represents the low RSSI with a value less than 45.
-
- Step 5: Store the Ratio_RSSI_low calculation value above and proceed with the test
-
- The case of Ratio_RSSI_low<40% is true:
- Then update the status check flag for RSSI by 1.
- The case of Ratio_RSSI_low<40% is wrong:
- Then update the status of the RSSI check flag by 0.
- Store this state on the clipboard to serve the environment decomposition shown in FIG. 10. Then finish the program.
- The case of Ratio_RSSI_low<40% is true:
-
-
FIG. 7 describes in detail the standardized algorithm for collecting and evaluating the TA value of the eNodeB system, the steps are as follows:
-
- Step 1: Initialize i=0 loop value, count=0 along with a given number of N samples.
- Step 2: Store the TA value of N samples through the TA information section of the Ministry of Statistics and evaluate the transmission rate with the change of the location of data users,
- Step 3: Implement standardization of data by algorithm unit for TA.
- Step 4: Repeat the index from i to N,
- In case i<N is true, continue checking the condition
- If the value (TA<28) or (TA>33) is correct:
- Then increase the count variable to 1 unit then increase the variable i to 1 unit
- If the value (TA<28) or (TA>33) is wrong:
- Then increase the count variable i to 1 unit.
- The loop cycle in case of still meeting the condition code i<N.
- If the value (TA<28) or (TA>33) is correct:
- Where i<N is false:
- End the iteration process, switch to the ratio conversion according to the sample method, in which the number of samples counted TA satisfies the above condition is the value of count and N survey samples. The formula converted as follows:
- In case i<N is true, continue checking the condition
Ratio_TA _moving = ( Count * 100 ) N
-
-
-
- where Ratio_TA_moving represents the ratio of TA whose values are outside the range of 28 to 33.
-
- Step 5: Save the Ratio_TA_moving calculation above and proceed to check
-
- Case Ratio_TA_moving>10% is true:
- Then update the status of TA check flag by 1.
- Case Ratio_TA_moving>10% is wrong:
- Then update the status of TA check flag by 0.
- Store this state on the clipboard to serve the environment decomposition shown in FIG. 10. Then finish the program.
- Case Ratio_TA_moving>10% is true:
-
-
FIG. 8 describes in detail the algorithm for standardizing and evaluating the SINR value of the eNodeB system, the steps are as follows:
-
- Step 1: Initialize the loop value i=0, count variables count=0 along with the number of samples is a given N.
- Step 2: Storing the SINR value of N samples through the Ministry of Statistics SINR information store information value assessing the transmission rate failure due to poor signal quality, unit SINR value collection dB (SINR_dB)
- Step 3: Standardize data in algorithm units for SINR by the following formula:
SINR=(SINR_dB+128)*2
-
- Step 4: Perform index iteration from i to N,
- If i<N is correct, continue checking the condition
- If the SINR<118 value and the packet decoding result is wrong:
- Then increase the count variable to 1 unit then increase the variable i to 1 unit.
- If the SINR<118 value and the packet decoding result is wrong:
- Then increase the count variable i to 1 unit.
- The loop cycle in case of still meeting the condition code i<N.
- If the SINR<118 value and the packet decoding result is wrong:
- Where i<N is wrong
- Then at the end of the iteration process, convert to proportional conversion by the method of sample percentage, in which the number of samples counted by SINR that satisfies the above condition is the values of count and N samples. The formula converted as follows:
- If i<N is correct, continue checking the condition
- Step 4: Perform index iteration from i to N,
Ratio_SINR _low _fail = ( Count * 100 ) N
-
-
-
- where Ratio_SINR_low_fail represents the SINR ratio with a value lower than 118 and decodes the information is wrong.
-
- Step 5: Store the calculation value Ratio_SINR_low_fail above and proceed with the test
-
- Case Ratio_SINR_low_fail>15% is true:
- Then update the state of the SINR check flag by 1.
- Case Ratio_SINR_low_fail>15% is wrong:
- Then update the status of the check flag with SINR 0.
- Store this state on the clipboard to serve the environment decomposition shown in FIG. 10. Then finish the program.
- Case Ratio_SINR_low_fail>15% is true:
-
-
FIG. 10 shows a detailed description of the flow of environmental differentiation after synthesis as described in FIG. 3 and details in FIG. 5,6,7,8. The steps are as follows:
-
- Step 1: Initialize the evaluation of the environment, select a unique environmental status.
- Step 2: Check scanning conditions:
- Where the RSSI check flag is equal to 1:
- Then update the level of environmental format characteristic type 1.
- Update the reference table 1 for the SINR value referenced by the following array:
- Where the RSSI check flag is equal to 1:
[120 122 124 126 128 129 131 133 135 137 138 141 142 144 146 148 149 151 155 156 161 155 156 159 161 162 165 165 173];
-
-
-
- where each value corresponds to the level of MCS (Modulation and Coding Scheme) modulation from 0 to 28.
- If the test flag NI is 1 is true:
- Then update the level 2 characteristic format differentiation.
- Update the reference table 2 for the SINR value referenced by the following array:
-
-
[121 123 126 127 130 131 132 133 134 137 138 141 142 144 146 147 151 153 157 161 162 160 162 164 165 166 168 169 174];
-
-
-
- where each value corresponds to the MCS modulation level from 0 to 28 respectively.
- Where the TA check flag is 1 is true:
- Update the level of characteristic type 3 classification.
- Update the reference table 3 for the SINR value referenced by the following array:
-
-
[120 121 122 123 127 128 130 131 131 135 137 138 142 144 144 145 148 148 150 151 155 158 160 162 165 165 168 168 172];
-
-
-
- where each value corresponds to the MCS modulation level from 0 to 28 respectively.
- If the check flag SINR equals 1 is true:
- Update the level of typical environment format differentiation type 4.
- Update the reference table 4 for the SINR value referenced by the following array:
-
-
[126 128 130 132 134 135 136 138 140 141 144 145 146 148 151 153 156 158 163 165 168 163 165 168 171 174 177 181 189];
-
-
-
- where each value corresponds to the MCS modulation level from 0 to 28 respectively.
-
- Step 3: Select the exception described in detail in FIG. 13 as follows:
-
P0=P0+2
-
-
-
- Then finish the program.
-
- Step 4: Update the output reference table for the system.
-
FIG. 12 shows a detailed description of the quantitative algorithm and mapping from the differentiated environment as a detailed result in FIGS. 3 and 4, and shows the appropriate treatment and correction, real steps show as follows:
-
- Step 1: Calculate the SINR_sample for the detailed results from FIG. 11. The calculation method is described in detail as follows
- Initializing the scan value PL ranges from 60 to 150, the value delta_pusch=0, f_i=0, N=10, the counter i=0,
- Initialize value P0=−80; alpha value=0.8; NI value=35.
- Perform the loop under condition i<N, if it is done, calculate the formula according to the formula
- Step 1: Calculate the SINR_sample for the detailed results from FIG. 11. The calculation method is described in detail as follows
SINR_sample_i=(P0+alpha*PL+delta_pusch+f_i)*2−NI+153
Inside:
-
-
-
-
- SINR_sample_i is the average true SINR value of the sample i,
- delta_pusch is the data channel coefficient that users route up, the value assigned to 0,
- f_i is the sample i of the offset update index, the value assigned to 0,
- NI is the standard interference and noise index,
- P0 and alpha have been described above.
- Increase the counting variable to 1 unit
-
- If the condition i<N is false, the program ends.
- Simultaneously obtain the SINR target with the corresponding environment described in detail in FIG. 10.
-
- Step 2: perform the calculation of delta_sinr value according to the formula delta_sinr=|SINR_target−SINR_sample|
- Bandwidth mapping into t_rep repeater division described in detail in FIG. 3 with a reference table of the reference value of the signal according to each type of data modulation,
- Comparing with the calculated value compared with the ratio of looping repeating pattern to bandwidth with the formula:
-
t_rep = ⌊ 10 * ( log 10 nRB ) t_sam ⌋
Inside:
-
-
-
-
- t_rep is the filter index that determines the difference to the maximum standard for each bandwidth,
- t_sam is the corresponding scaling factor for each bandwidth,
- nRB is the maximum number of physical resources corresponding to each bandwidth.
- details the value of t_sam and nRB according to the bandwidth shown in the table below:
-
-
-
| Bandwidth | Bandwidth | Bandwidth | Bandwidth | Bandwidth | Bandwidth |
| 20 MHz | 15 MHz | 10 MHz | 5 MHz | 3 MHz | 1.4 MHz |
| t_sam = 6 | t_sam = 6 | t_sam = 5 | t_sam = 4 | t_sam = 3 | t_sam = 2 |
| nRB = 100 | nRB = 75 | nRB = 50 | nRB = 25 | nRB = 15 | nRB = 6 |
-
- Step 3: Perform condition tests
- In case of condition i<N is true:
-
- Then perform the condition check Delta_sinr>t_rep case is true:
- Then update the value and decide to adjust the coefficient P0 and alpha
- Increase the counter value to 1 unit
- Repeat the set of parameters P0 and alpha until the status of delta_sinr is smaller than the value of t_rep,
- Delta delta_sinr>t_rep case is wrong
- Proceed to storing the current P0 and alpha values and ending the program
-
- If case i<N is wrong
- Carry out the selection of exceptions with the algorithm described in detail in FIG. 13.
- In case of condition i<N is true:
- Step 3: Perform condition tests
EXAMPLE OF THE INVENTION
In fact, the system established by the method of invention has been applied in laboratories and deployed in reality.
FIG. 14 shows the actual installation of the system in the electronic laboratory of the eNodeB project, the sequence of establishing and applying the invention method is described as follows. Actual system setup includes CTC/BBC setup in which real-time software collection and calculation software is implemented by author using C/Python language in Linux environment; then apply the set of system parameter sets as shown in Table 1; CTC/BBC connected to antenna system RRU 2 to receive 2 transmissions via CPRI interface; Setting up iPhone phones is a user device; UE data exchanged with RRU is converted to digital data to CTC/BBC, then the software collecting—calculating real time will collect input data and normalize data by the algorithm described in detail. In the above figures, the output is capable of differentiating each type of environment and adjusting its compatibility with each environment. Finally, perform the controls to adjust the magnetic power control value in accordance with the test environment of P0_PUSCH=−101 and alpha=1.0; continue to order from CTC to BBC. The results after optimization are reflected by the network quality parameters as shown in Table 2 and the Key Performance Indicator (KPI) as shown in Table 3.
| TABLE 1 |
| System parameter set |
| Parameters | Configured Parameters |
| Common | bandwidth: 10 MHz |
| parameters | ratio t_sam: 5 |
| number of Resouce Block (nRB): 50 | |
| number of system antenna: 2. | |
| Serving Cell Identity (Cell_ID): 0 | |
| Flag of Hopping (Hopping_mode): 0 | |
| Circular Shift in DMRS (csDMRS): 0 | |
| Delta Shift for PUSCH (deltaShift): 0 | |
| repetitive prefix mode: normal | |
| Control | Initial Power of PUSCH channel (P0_PUSCH): −80 dB |
| parameters of | Power control factor (Alpha): 0.8 |
| opening loop | |
| Control | Accumulation = 1 |
| parameters of | target_SINR and path_loss respectively on PUSCH |
| close loop | <path_loss> 0 → 90 <target_SINR>168 |
| <path_loss> 91 → 100 <target_SINR>160 | |
| <path_loss> 101 → 110 <target_SINR>150 | |
| <path_loss> 111 → 120 <target_SINR>140 | |
| <path_loss> 121 → 130 <target_SINR>130 | |
| <path_loss> 130 → 255 <target_SINR>128 | |
| Coefficients increase capacity at the levels respectively: | |
| TPC_0, TPC_1, TPC_2, TPC_3. | |
| TPC_0: −255->−12 | |
| TPC_1: −11->−5 | |
| TPC_2: −4->0 | |
| TPC_3: 1->255 | |
| TABLE 2 |
| Some parameters evaluate the network quality |
| status | status | ||
| before | after | ||
| Statistical indicators | applying | applying | |
| for network quality | the patent | the patent | comments |
| The proportional | 15.36% | 7.02% | After applying the |
| distribution of the | invention method, the | ||
| large noise area (NI >= | noise ratio at high | ||
| 55) is equivalent | noise areas decreases | ||
| to >= −108.5 dBm | by 8.28%. | ||
| The proportional | 11.56% | 4.84% | After applying the |
| distribution of | invention method, the | ||
| uplink decoding due to | wrong decoding ratio | ||
| poor signal quality | due to poor signal | ||
| quality decreased by | |||
| 6.72%. | |||
| Proportional | 32.00% | 45.24% | After the application |
| distribution | of the Patent Method, | ||
| of regions with | the UE transmit power | ||
| average receiver | has decreased by | ||
| signal strength | 7.24% | ||
| (RSSI <= 45) | |||
| equivalent <= −113.5 | |||
| dBm | |||
| The proportional | 85.37% | 91.87% | The random-access rate |
| distribution | of success increased by | ||
| of successful random | 6.5% after the invention | ||
| access | method was applied | ||
| Proportional | 21.83% | 16.5% | The rate of faulty |
| distribution | blocks is reduced by | ||
| of upstream error | 5.33% after applying the | ||
| (UL BLER) | invention method | ||
| Power reserve | 11 dB | 17 dB | The UE power reserve |
| has increased by about 6 | |||
| dB, which helps UE | |||
| save transmit power and | |||
| reduce noise in the | |||
| system | |||
| TABLE 3 |
| KPI quality parameters of the system |
| KPI before the invention | KPI after the invention | |
| method is applied | method is applied |
| RASR | RRC SR | CSSR | RASR | RRC SR | CSSR | |
| Time | (%) | (%) | (%) | (%) | (%) | (%) |
| Feb. 6, | 61.12 | 98.41 | 98.19 | 72.83 | 99.54 | 99.14 |
| 2018 | ||||||
| Jan. 6, | 64.36 | 99.03 | 98.80 | 70.10 | 99.52 | 99.27 |
| 2018 | ||||||
| Where: | ||||||
| RASR: Random Access Success Rate - The success rate of random-access procedure | ||||||
| RRC SR: Radio Resource Control Success Rate - The success rate of allocating radio control resources. | ||||||
| CSSR: Call Setup Success Rate - The rate of setting up a successful call or service. |
Thus, KPI (100% is the highest standard value) after applying the invention method are 15 to 40% better than before applying the invention method.
THE BENEFITS ACHIEVED BY THE INVENTION
The system was established according to the invention method which is able to calibrate and control the receiver power. At the same time, the invention method brings the best effect when compatible with each type of transmission medium, overcoming the disadvantage of slow variation with the old control type. Improve network quality in particular and network KPIs in general.
Claims
what is claimed is:1. A method for adjusting and controlling receiver power adaptation according to transmission environment in an eNodeB LTE system includes:
a) Set up initialization parameters and an input data collection system including the following steps:
ai) initialize a system setup with a number of input antennas and corresponding bandwidth,
aii) set initialization parameters for non-closed (Open-Loop) P0 and alpha power control values; where P0 is the absolute initial capacity for the uplink user data channel (Physical Uplink Shared Channel—PUSCH), alpha is the relative value of the power of the user device (User Equipment—UE) with the current location when accessing,
aiii) Measure and obtain statistics the input parameter set including: Signal per Interference and Noise Ratio (SINR), Received Signal Strength Indication (RSSI), relative position the predetermined device (Timing Advance—TA) and noise (Noise plus Interference—NI) according to the N pattern cycle through the collection software—real-time calculation,
b) Standardization, data assessment and classification of typical environments includes the following steps:
bi) calculate the average real SINR value of N samples collected in step aiii) by the following formula:
SINR_sample_i=(P0+alpha*PL+delta_pusch+f_i)*2−NI+153
In which:
SINR_sample_i is the average real SINR value of the sample i;
delta_pusch is the data channel coefficient of the uplink user, the value assigned is 0;
f_i is the sample i of the offset update index, the value assigned to 0;
NI is interference index and standard noise;
P0 and alpha are described above;
bii) standardize the collected data according to the input parameter set;
biii) compare the post-standardized value at the bii step) with the setting value of the environment to separate each type of typical environment by using a percentage assessment method against the input N sample, in there:
if the percentage of the RSSI value is less than 40% samples, then the RSSI state check flag is equal to 1, at which time the typical environment type 1 is differentiated;
if the percentage of NI value is bigger than 10% samples, the NI state check flag is equal to 1, at which time the typical environment type 2 is differentiated;
if the percentage of TA value is bigger than 10% samples, the TA status flag is equal to 1, at which time the typical environment type 3 is differentiated;
if the percentage of SINR value is bigger than 15% and decoding wrong data (Ratio_SINR_low_fail>15%), the SINR flag is equal to 1, at which time the typical environment type 4;
c) calculate, adjust and apply environmental adaptive control over time including the following steps:
ci) perform the environmental mapping defined in step biii) with the reference table of reference quality value of the signal according to each type of data modulation,
cii) calculate the delta_sinr difference between the SINRs obtained in step ci) and the ball step),
ciii) compare the calculated value in step cii) with the sampling rate repeated by bandwidth according to the following formula:
t_rep = ⌊ 10 * ( log 10 nRB ) t_sam ⌋
In which:
t_rep is the filtering index that determines the difference with maximum standard for each bandwidth;
t_sam is the compatibility ratio corresponding to each bandwidth; and
nRB is the maximum number of physical resources corresponding to each bandwidth;
civ) the final decision will follow the following principle:
if the delta_sinr value calculated in step cii) is greater than the value t_rep calculated in step ciii) then perform the value update and decide to adjust the coefficient P0 and alpha by repeating the set of parameters P0 and alpha until when the state of the delta_sinr value is less than the value of t_rep;
in case this state is not reached, the exception option that satisfies the condition of the SINR value calculated in the ball step) is between 128 and 135, and the current value of P0 and alpha is stored, if outside this range, increase P0 value by 2 units;
if the delta_sinr value calculated in step cii) is less than the value t_rep calculated in step ciii), update the current value of P0 and alpha.
Images & Drawings included:


Sources:
- United States Patent and Trademark Office - verify current appl. status at the USPTO↗
Recent applications in this class:
- » 20250293718 2025-09-18
TWO-PORT PASSIVE INTERMODULATION ANALYZER TO CLASSIFY INTERFERENCE SIGNALS AND IDENTIFY LIKELY SOURCES - » 20250293717 2025-09-18
VOLTAGE STANDING WAVE RATIO (VSWR) MONITORING FOR A RECEIVER - » 20250286569 2025-09-11
SYSTEM, METHOD AND COMPUTER PROGRAM FOR DYNAMIC CLOSED-LOOP INTERFERENCE MITIGATION - » 20250274152 2025-08-28
Receiver - » 20250260429 2025-08-14
SIGNAL CANCELLER - » 20250260428 2025-08-14
PHASE SHIFT DETECTION AND CORRECTION FOR AUDIO-BASED DATA TRANSMISSIONS - » 20250260427 2025-08-14
METHOD AND APPARATUS FOR REDUCING THE EFFECT OF CARRIER FREQUENCY OFFSET ERRORS IN WIRELESS COMMUNICATIONS SYSTEMS - » 20250260426 2025-08-14
METHOD AND APPARATUS FOR REDUCING INTERFERENCE IN WIRELESS COMMUNICATION SYSTEMS - » 20250253878 2025-08-07
NOISE SUPPRESSION CIRCUIT - » 20250233606 2025-07-17
Q-BAND BLOCK DOWN CONVERTER
Recent applications for this Assignee:
- » 20250283411 2025-09-11
Optimization Framework for Multi-Stage Compressor Disk Design in Gas Turbine Engine - » 20250282489 2025-09-11
Mechanism for indicating the opening of a flight device guidance tube cap - » 20250282331 2025-09-11
Electric lifting mechanism for automatic balancing system - » 20250239778 2025-07-24
Ka band monopulse array antenna with low sidelobe levels - » 20250237507 2025-07-24
Coning, sculling and scrolling error compensation method for strapdown inertial navigation system - » 20250237283 2025-07-24
Shock Absorber Structure - » 20250236078 2025-07-24
Method of manufacturing square tube from composite materials - » 20250212233 2025-06-26
SYSTEM FOR DETECTING A MOTION STATE OF A DEVICE BASED ON RADIO SIGNAL INFORMATION - » 20250212171 2025-06-26
METHOD TO INCREASE A NAVIGATION UPDATE RATE FOR A RTK POSITIONING SYSTEM - » 20250212132 2025-06-26
AUTONOMOUS POWER REGULATION (APR) METHOD