COMPUTER IMPLEMENTED METHOD FOR REAL-TIME LWD PROFILE PREDICTION IN THE INTERVALS FROM THE DRILL TIP TO THE LIMIT OF THE DEPTH PROFILE OFFSETS
US20250179904A1
2025-06-05
18/965,908
2024-12-02
Smart Summary: A new computer method helps predict the LWD (Logging While Drilling) profiles while drilling. It focuses on the area from the drill tip to the maximum depth of the drilling. This prediction happens in real-time, allowing for quicker responses during drilling. By providing accurate information, it helps improve decision-making for drilling operations. Overall, this method aims to make drilling more efficient and effective. 🚀 TL;DR
Abstract:
The present invention relates to a computer implemented method, the main objective of which is to predict real-time LWD profiles in the intervals from the drill tip to the limit of the profile offsets. This becomes a methodology that serves as yet another input to improve assertiveness in decision-making during well drilling operations.
Inventors:
- Lucas Abreu Blanes de Oliveira 2 🇧🇷 Rio de Janeiro, Brazil
- Paulo Romero Zanconato PINTO 2 🇧🇷 Rio de Janeiro, Brazil
- Willian Andrighetto TREVIZAN 2 🇧🇷 Rio de Janeiro, Brazil
- PLINIO CANCIO ROCHA DA SILVA JUNIOR 1 🇧🇷 Rio de Janeiro, Brazil
Assignee:
- PETRÓLEO BRASILEIRO S.A.-PETROBRAS 93 🇧🇷 Rio de Janeiro, Brazil
Applicant:
Interested in similar patents?
Get notified when new applications in this technology area are published.
Classification:
E21B45/00 » CPC main
Measuring the drilling time or rate of penetration
E21B49/005 » CPC further
Testing the nature of borehole walls; Formation testing; Methods or apparatus for obtaining samples of soil or well fluids, specially adapted to earth drilling or wells Testing the nature of borehole walls or the formation by using drilling mud or cutting data
E21B2200/20 » CPC further
Special features related to earth drilling for obtaining oil, gas or water Computer models or simulations, e.g. for reservoirs under production, drill bits
E21B49/00 IPC
Testing the nature of borehole walls; Formation testing; Methods or apparatus for obtaining samples of soil or well fluids, specially adapted to earth drilling or wells
Description
CROSS-REFERENCE TO RELATED APPLICATIONS
The present application claims the benefit of Brazilian Patent Application No. BR1020230253652, filed Dec. 2, 2023, the entire contents of which are fully incorporated herein by reference.
FIELD
The present invention applies to the industrial plant of the oil, natural gas and energy industry.
Preferably, the present invention falls within the areas related to the departments of monitoring well drilling and acquisition of geological and geophysical data, related to geological operation, and to the evaluation of formations.
BACKGROUND
The acquisition of geological and geophysical data during well drilling includes different data sources such as trough samples, gas chromatography, real-time logging profiles during drilling (logging while drilling (LWD)) and drilling parameters. Such information, associated with that coming from regional studies, which contain uncertainties related to seismic imaging or lack of correlation wells, are of utmost importance to support decision-making during operations.
Among the data acquired in real time, the drilling parameters, collected by surface sensors and coupled to the drilling system, are the only ones that reflect instantaneous information about the drilled section. These parameters include torque, revolutions per minute (RPM) and weight of drill (WOB) of the drill string, pumping pressure (stand pipe pressure-SPP), drilling rate (rate of penetration-ROP) and string vibration. These data are acquired with common sampling rates of 1 to 5 seconds and are called “real-time” drilling parameters. In order to simplify visualization and comparison with other data seen at depth, it is very common to consume and process these data based on sampling by depth, with, for example, a sample every 0.1524 m. They are thus called “in-depth” drilling parameters.
LWD tools play an important role in geological identification.
They are specifically combined for the purpose of each drilled phase and their respective arrangements depend on the configuration of the drill string. One limitation of acquisitions is related to the fact that the sensors are arranged at a specific distance above the drill drill (offset). A tool with a sensor with a smaller offset, for example, is the Gamma Ray (GR) tool close to the drill (GRbit), at an approximate distance of 3 m from it. There are some, such as sonic acquisitions, that reach a few dozen meters. Modern tools such as deep azimuthal resistivity tools provide a “look ahead”, being able to obtain predictions from 2 to 8 m ahead of the bit. However, the costs of this operation are high and contain uncertainties inherent in the mathematical model of data inversion.
Drilling operations in complex geological scenarios require important decision-making. Among these cases are the presence of igneous rocks in the evaporite section and the variation in the thickness of basal anhydrites, with high uncertainty in seismic studies, which precede the top of the pre-salt reservoirs of some Basins. In these cases, it is necessary to interrupt drilling-a sometimes critical procedure, also known as geostopping and which requires action by the geological operations sector —for lithostratigraphic characterization with the greatest possible assertiveness, avoiding risks related to geopressures, for example. To do this, it is sometimes necessary to wait for the return of gases and samples from the drilled region (trough samples, which rise from the bottom of the well to the surface with the drilling fluid) to make a decision. This sample recovery procedure is called “bottoms up” and can take a few hours, depending on the depth of the well. And it can be done more than once, if they decide to drill a little further to clarify doubts. This time spent with “bottoms up” increases the operating time, making the project more expensive.
Another type of operation that requires decision-making and involves high costs is coring. In this case, geostopping may be necessary at the top of an area with specific geological characteristics. There are also situations in which decisions may need to be made to finish the well or change the drill bit. Assertiveness in maneuver decisions becomes important because this type of operation can take around 48 hours in wells over 5,000 m deep. Such decisions need to be well-founded geologically, with the least possible uncertainty.
Most of the techniques using real-time drilling parameters in the literature address topics related to well engineering. Following this line, there are studies that seek, for example, the optimization of ROP (rate of penetration), estimates of metric drilling cost and predictions of drill drill status, in which for most of them geological information can be an important input.
Among the works in the literature focused on predicting geological attributes from drilling parameters through AI is that of Moazzeni & Haffar (2015). It predicts formations and lithology using artificial neural networks (ANN) (Janiesch, C. and Heinrich, K. 2021, ‘Machine learning and deep learning, vol. pages 685 to 695) using as inputs torque, ROP, RPM, WOB, SPP, drill diameter and type, drilled thickness, drill time at the bottom, fluid weight and total area open to flow in the drill.
Gan et al. (Gan, T., Kumar, A., Ehiwario, M., Zhang, B., Sembroski, C., de Jesus, O., Hoffmann, O., Metwally, Y., 2019. Artificial intelligent logs for formation evaluation using case studies in Gulf of Mexico and Trinidad & Tobago. Proc.-SPE Annu. Tech. Conf. Exhib. 2019-Sept) carried out case studies in drilled wells where they sought to predict synthetic logs also via ANN using drilling parameters. The authors show that the next challenge would be the implementation of the routine in real time using specific software. Nye et al. (Nye, R., Mejia, C., Dontsova, E., 2021. SPE-205402-MS Real-time Cloud-Based Automation for Formation Evaluation Optimization, Risk Mitigation and Decarbonization) show greater commercial maturity by showing automated flows in real time. The products are predictions of LWD logs and lithology via RNN from the combination of 3 models that come from correlation well data, predicting ahead-of-bit logs, drilling parameters and gas chromatography/probe geochemistry.
The calculation of Mechanical specific energy (MSE) (Teale, R., 1965. The concept of specific energy in rock drilling. Int. J. Rock Mech. Min. Sci. 2, 245) is another way to assist in the interpretation of drilling parameters in real time. However, these techniques do not use LWD profiles as support.
There are studies in the literature that show good accuracy rates in predicting LWD data from drilling parameters with different objectives, such as predicting density profiles (Gowida et al., 2020) and gamma rays (Aly et al., 2021). However, the approaches of these studies consist of training the models in wells that have already been drilled for application in new wells. There is no real-time training and retraining flow, as drilling progresses, as is performed by the method developed in the present invention. These techniques can be used to generate an initial inference and improve the real-time model of the present invention.
Furthermore, Moazzeni & Haffar (Moazzeni, A., Haffar, M., 2015. Artificial Intelligence for Lithology Identification through Real-Time Drilling Data. J. Earth Sci. Clim. Change 06, 3 to 6) confirm the hypothesis of lithological prediction and formations from a machine learning strategy, but do not show a method for predicting LWD profiles in real time in the intervals from the drill tip to the limit of the offsets of the profiles. Gowida uses an adaptive network-based fuzzy interference system (ANFIS), functional network (FN) and support vector machine (SVM) to predict density profiles in LWD, with training in many wells. In addition, Aly uses artificial neural networks (ANN), adaptive network-based fuzzy logic (ANFIS) and functional networks (FN) to predict GR training with several wells.
In this scenario, the present invention shows a method with AI applications during well drilling, using drilling parameters and LWD profiles in order to predict geological attributes in real time in the intervals from the drill tip to the limit of the offsets of the profiles, making inferences during drilling.
STATE OF THE ART
In the state of the art, there are methods/techniques for analyzing geological data in real time that assist drilling operations.
The patent document US20140351183 A1, for example, describes models and how to predict operational results of a drilling operation. At least some of the illustrative forms are methods that include: collecting sensor data related to reference wells and contextual data related to these reference wells and placing the sensor data and contextual data in a data repository; creating a reduced data set identifying a correlation between the data in the data repository and an operational result in a drilling operation; creating a model based on the reduced data set; and predicting the operational result based on the model.
Unlike the present invention, the patent document U.S. Pat. No. 20,140,351183 A1 has applicability more related to well engineering and its operational results.
WO 14066981 A1 describes methods and systems for improving drilling operations by using real-time drilling data to predict drill wear, lithology, pore pressure, a coefficient of rotational friction, permeability and cost in real time and to adjust drilling parameters in real time based on the predictions. Real-time lithology prediction is performed by processing real-time drilling data through a multilayer neural network. Real-time drill wear prediction is performed using real-time drilling data to predict a drill efficiency factor and to detect changes in the drill efficiency factor over time. Historical data can be used in combination with real-time data to provide assistance to the expert system and to identify safety concerns.
Unlike the present invention, the document WO 14066981 A1 provides for drill wear, lithology, pore pressure, coefficient of rotational friction, permeability, but does not use LWD profiles as the claimed method.
The document US20150226049 A1 relates to the monitoring/control of the drilling operation, the dimensionality of a full-scale model is reduced, and data is received from a plurality of geographically distributed sensors (e.g., with depth variation), and a surrogate model is used to estimate variables in real time. The use of the surrogate model may allow, for example, the use of particle filtering processes during the estimation, also allowing real-time estimates, avoiding the excessive use of reasonable computational resources. Operational controls or similar may then be defined based on the estimated variables. For example, drilling control parameters can be adjusted based on estimated variables to avoid loss of circulation, kicks, stuck pipes and catastrophic events, optimize drilling parameters such as penetration rate, improve success probabilities and drilling efficiency and/or similar.
The present invention differs from the state of the art because it relates to a method for predicting LWD profiles in real time in the intervals from the drill tip to the limit of the profile offsets, more specifically, a computer-implemented method for predicting LWD profiles in real time at the current depth of the drill from continuous training with drilling parameter data and LWD profiles read up to their respective depth offsets, based on retraining and loop inference of defined periods with data from the well itself being drilled, in addition to using statistical calculations of drilling parameters, generated from the time/depth conversion. Furthermore, previous models trained on correlation wells-linked to previously published approaches-can be used for initial inference and to enhance the real-time model of the present invention by providing a broader context.
SUMMARY
The present invention relates to a computer-implemented method for predicting LWD profiles in real time in the intervals from the drill tip to the limit of the depth profile offsets, comprising: (a) importing data of LWD profiles in depth from an available database; (b) importing data of drilling parameters in time from an available database; (c) applying filters to drilling parameters in time, removing records with values of ROP, WOB, RPM and torque less than or equal to zero; (d) converting said data in time to depth by calculating statistical attributes, such as mean, median and standard deviation, of said drilling parameters in time contained in specific intervals and having constant depth spacing; (e) combining said drilling parameters converted to depth in step (d) with said LWD profile data imported in step (a) using depth as a reference; (f) training machine learning models, based on supervised regressions, for each said LWD profile with the database above each respective depth offset; (g) performing inferences to predict each said LWD profile with its respective model using training features in a range corresponding to the current drill depth up to the respective offset limits; (h) periodically checking, such as every minute, whether there has been progress in drilling, if so, repeating step (f) of training said models including said new data and, subsequently, step (g), performing new inferences; and (i) sending the results for each new prediction to a database, said results being used by a visualization tool and made available to a user. Wherein in step (f) said target LWD profiles comprise layers (labels). Furthermore, in step (g) said characteristics comprise statistical attributes of drilling parameters, such as torque, weight over drill (WOB), rate of penetration (ROP), revolutions per minute (RPM), MSE (mechanical specific energy), pumping pressure (SPP), drilled phase, drill type and drill run.
Furthermore, the present invention relates to a computer-readable non-transitory storage medium comprising instructions stored therein, wherein the instructions, when read by a computer, cause the computer to execute the steps of the method as defined above.
BRIEF DESCRIPTION OF THE FIGURES
In order to complement the present description and obtain a better understanding of the features of the present invention, and in accordance with a preferred embodiment thereof, a set of figures is presented in the annex, where in an exemplary, although not limitative, manner its preferred embodiment is represented.
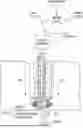
FIG. 1 shows a hexagon showing at its vertices the main elements that must be analyzed for a successful “drilling stop”. One of the vertices, which deals with the drilling parameters, is also highlighted. In addition to this, the diagram shows a drill drilling the drilling mud (fluid).
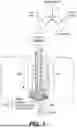
FIG. 2 is a representation of the objective of the proposed method, which is to predict LWD profiles in the offset “hole”. It shows LWD profiles and drilling parameters at depth and highlights this interval to be predicted, according to a preferred embodiment of the present invention.
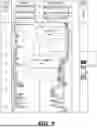
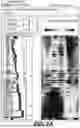
FIG. 3 is a representation of an example where there were difficulties in making a “drilling stop” during the coring operation, in a certain zone where there would be an increase in porosity. However, the LWD profiles used to illustrate this feature had a high offset (36.14 m) and the beginning of the target was lost.
FIG. 4 is a representation of an example where there was a section of the well with a lot of silicification, in which the drilling engineering performed drill exchange maneuvers to insert one suitable for this type of rock.
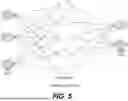
FIG. 5 is a representation of a three-layer neural network.
FIG. 6 is a representation of how an estimate with a synthetic curve of the compressive sonic is made through machine learning techniques using drilling parameters in time.
FIGS. 7A and 7B are a representation of drilling parameter patterns in one-dimensional space via orthogonal periodic functions.
FIG. 8 is a generic flowchart of the method of the present invention, highlighting the applications where the technique can add value, according to a preferred embodiment of the present invention.
FIG. 9 is a representation of the Real Time Training (RTT) of the present invention, highlighting the training with data from the well itself and the possibility of inserting pre-trained models in other wells, according to a preferred embodiment of the present invention.
FIGS. 10A and 10B are a representation of how the loop was executed every minute to acquire the drilling parameter data in real time in the first prototype of the claimed method, according to a preferred embodiment of the present invention.
FIG. 11 is a representation of the execution of how the time-depth conversion of the drilling parameters of the claimed method is done, according to a preferred embodiment of the present invention.
FIG. 12 is a representation of the requested method with these main steps: data acquisition and preprocessing, training, machine learning model inference and sending of data to the user. The entire flow is done in a loop, as the well is drilled, with constant retraining, according to a preferred embodiment of the present invention.
FIG. 13 is a representation of how the inference performed by the AI of the requested method is carried out, according to a preferred embodiment of the present invention.
FIG. 14 is a representation of results (highlighted in the curves in red) after application of the requested method, according to a preferred embodiment of the present invention.
DETAILED DESCRIPTION OF THE DRAWINGS
When drilling wells, geological decisions are required in a series of geostopping situations, such as phase termination, core sampling, well termination and drill change maneuvers, which cost rig hours, as seen in FIG. 3. The acquisition of geological and geophysical data during well drilling includes different data sources, such as channel samples, gas chromatography, logging while drilling (LWD) and drilling parameters, as seen in FIGS. 1 and 7. Such information is extremely important to support decision-making during operations. Among these data acquired in real time, drilling parameters, collected by surface sensors and coupled to the drilling system, are the only ones that reflect instantaneous information about the drilled section. Drilling parameters can allow lithological and/or formation changes in real time and are acquired at intervals of the order of a few seconds. These are free data that reflect exactly what occurs at the “tip of the drill”, with no distance to the sensors, as occurs in LWD profiles. LWD tools play an important role in geological identification. They are specifically combined for the purpose of each drilled phase and their respective arrangements depend on the configuration of the drill string. One limitation of the acquisitions is related to the fact that the sensors are arranged at a specific distance above the drill (offset). Drilling operations in complex geological scenarios require important decision-making, as seen in FIG. 4.
Specifically in this context, the computer-implemented method for predicting LWD profiles in real time at the current drill depth from continuous training with drilling parameter data and LWD profiles read up to their respective depth offsets, of the present invention as seen in FIGS. 8 and 12, is applied to an automated real-time routine that, mainly, fosters a learning curve in this operation, collecting requirements for a definitive future application as seen in FIG. 2. Specific models were trained/applied for different LWD profiles in the drilled phases of the pre-salt reservoirs and in the salt phase. The prediction results showed that there are clear relationships between the drilling parameters and the geological attributes.
Furthermore, the method of the present invention predicts LWD profiles in real time in the intervals from the drill tip to the limit of the profile offsets, serving as another input to improve the assertiveness in decision-making during these operations.
To solve this problem, it is proposed to use a computer-implemented method for predicting LWD profiles in real time in the intervals from the drill tip to the limit of the profile offsets, comprising: (a) importing the LWD profiles in depth from the database; (b) importing from the database of drilling parameters in time; (c) applying filters to the drilling parameters in time to preserve only the data from the drilling moments (“drilling mode”); (d) converting the data in time to depth by calculating statistical attributes, such as mean, median and standard deviation, of the drilling parameters in time contained in specific intervals and with constant depth spacing (for example, every meter: from 5000 to 5001 m the statistics are calculated; from 5001 to 5002 m the statistics are also calculated); (e) combine the drilling parameters converted to depth in step (d) with the LWD profile data imported in step (a); (f) train different machine learning models, based on supervised regressions for each LWD profile with the database above the respective depth offsets. The layers (labels) are the target LWD profiles themselves and the features can be the statistical attributes of the following drilling parameters: torque, weight on drill (WOB), rate of penetration (ROP), revolution per minute (RPM), MSE (mechanical specific energy), pumping pressure (SPP), drilled phase, type and drill run, as exemplified in FIG. 5. Machine learning algorithms based on a Gradient Boosting structure, such as Light GBM, are used; (g) performing inferences to predict each LWD profile with its respective model using the training features in the range corresponding to the current drill depth up to the respective offset limits; (h) checking from time to time whether there has been progress in drilling. If so, repeating step (f) of training the models including the new data and then repeating step (g), performing new inferences. This procedure was named Real Time Training (RTT), as can be seen in FIG. 9; (i) for each new prediction, sending the results to the database, as seen in FIGS. 10 and 14. The geological operations team can monitor the results using visualization tools of their choice.
Finally, in another embodiment of the present invention, a non-transitory computer-readable medium is provided. The medium may be, for example, a memory, a flash memory, a hard disk, a compact disk, or any other device capable of storing computer instructions. When the readable medium of the present embodiment is read by a computer, the computer is enabled to perform the LWD profile prediction method in real time in the intervals from the drill tip to the limit of the profile offsets.
Example of implementation/Tests/Results
The first stage (initial testing phase) aimed to test the hypothesis of a relationship between drilling parameters and profiles in a series of wells in the same area, develop a workflow to predict geological attributes in the offset sections of profiles, and seek paths for future implementation in real time. For this purpose, time and depth databases were prepared, encompassing 17 wells already drilled in the Santos basin pre-salt. A subdivision was also made between the drilling phases of the evaporite section (SAL) and the reservoir (RES).
The first challenge encountered was the concatenation of information from different systems. A Python routine was developed that encompasses a series of steps. Among the main applications of time-based drilling parameters to obtain a depth-based database are the application of filters such as the “drilling mode” filter, time-depth conversion by calculating statistical variables from the time base (such as mean, median and standard deviation) and concatenation with other types of data, as seen in FIG. 11. These include LWD profiles and profiles acquired via wireline, gas chromatography, categorical information such as drill types, drilling fluid, lithology, etc. A time-based database was also created, but it had not been used in the AI routines until that moment.
With the database ready, it was possible to perform an exploratory analysis of the data. It was initially noted that there was a strong relationship between the observed parameter patterns and the types of drill. In fact, each phase/well has drilling configurations that encompass, in addition to the type of drill, other factors such as fluids used and the arrangement of the tools. This set of features is defined as a specific “drilling layout”. Additionally, the database contains wells drilled over the last few years, where the evolution in drill technology ends up making the prediction task more difficult.
The AI routines had different objectives for the RES and SAL phases. In the first, the aim was to obtain a porosity curve (target), with training supervised by Nuclear Magnetic Resonance (NMR) porosity profiles via regression. In the SAL phase, the objective was to predict lithotypes (target), configuring training supervised by the descriptions available in Exata via classification. The XGBoost algorithm (Chen, T. & Guestrin, C., 2016. XGBoost: A Scalable Tree Boosting System. In Proceedings of the 22nd ACM SIGKDD International Conference on Knowledge Discovery and Data Mining. KDD & #x27;16. New York, NY, USA: ACM, pages 785 to 794) was used, which is based on decision trees and uses a gradient boosting structure. The training inputs were the intervals with data on drilling parameters at depth, their respective statistical attributes calculated in the preprocessing and the available targets. The inferences were made using the drilling parameters and their statistical variables, as observed in FIG. 13.
The first approach studied consisted of using the entire multiwell database to predict information in a test well. The results were generally unsatisfactory. In a test performed, the prediction of total porosity (PHIT) follows the trend of an average value throughout the reservoir. It was also observed that the results of the classification of lithofacies in the SAL phase revealed low accuracy. In fact, the particularities of the “drilling layouts” in the several wells ended up harming the performance of the models. It was necessary to seek other application strategies in order to make the models more robust.
New tests indicated that the information acquired in the well being drilled was the most valuable during the training of the machine learning routines, as observed in FIG. 6. Therefore, real-time training (RTT) was created, a technique in which the machine learning algorithm is retrained at each depth advance in a defined interval and, subsequently, the model is applied. The accuracy of the results improved as the well advanced and the model became more robust.
From the application tests of the RTT methodology, it was noted that the technique was able to significantly improve the inferences of the algorithm. It is worth noting that using this approach only with data from the well itself limits learning to patterns experienced up to the point of drilling. Specifically for the SAL phase, where the main challenge is to identify the reservoir entry, the database includes notes on the desired carbonate (less than 1%). Data from other wells were also used, but even so, the accuracy of carbonate prediction was low.
Specifically, developing routines that require exhaustive preparation of the database, downloading information from different systems, manipulating time and depth databases, and concatenating these data is not the best path for real-time implementation. The first stage of testing was completed by delivering the RTT methodology from offline “cold” data and mapping the main systems and requirements to seek a future real-time implementation test.
The second stage of testing had as its main objective performing a real-time test of the RTT methodology, predicting the LWD profiles available in each phase in the offset section. For this purpose, two wells with drilling in progress at the time of the test were used to prepare an MVP in the RES and SAL phases, respectively.
At the end of the first stage, efforts were focused on applying real-time tests. In order to chart paths for the next stage, a survey of the main sources of available time and depth data was carried out. In the case of these tests, there were 2 main types of systems that provided the following data and services: (a) it provides data from LWD profiles in depth and receives the products of the method in depth for visualization and consumption; and (b) it provides data on drilling parameters in real time.
The first tests performed were semi-automated in nature, since network folders and personal machines were used to execute the routines. A first script, outlined, aimed to prepare the real-time database. In it, the Torque, WOB, RPM and their respective means/medians/standard deviations came from the system (R) as the source. The LWD profiles, ROP and MSE were acquired from the system (E). Below is a summary of the steps of this script: 1) capturing every minute of a set of data in real time (R), saving it in xlsx files in a network folder, each file containing data from 60 seconds; 2) applying filters to preserve only the data from “drilling mode”; 3) converting time/depth by calculating statistical attributes of the drilling parameters; 4) concatenating the database with the system data (E) at depth; 5) constant updating the database at depth in a network folder.
A second script developed aimed to train/predict LWD profiles in the offset section in real time using only data from the well itself (RTT methodology). The LightGBM algorithm was used (Ke, G. et al., 2017. Lightgbm: A highly efficient gradient boosting decision tree. Advances in neural information processing systems, 30, pages 3146 to 3154), which is also based on decision trees and uses a gradient boosting structure. The steps are summarized below: 1) periodic checking the network folder containing the depth file generated with script 1; 2) training network for each specific target using as input data from the respective ranges above the offset: Torque+WOB+RPM+Torque/WOB/RPM statistical variables+ROP+MSE+target LWD profile; 3) applying the models in the offset section using the following data as input: Torque+WOB+RPM+Torque/WOB/RPM statistical variables+ROP+MSE; 4) at each determined depth advance, performing new training and new application of the models; 5) exporting a file in LAS format, manually imported into the system (E) for viewing by the interpreter.
Throughout the process, important adjustments were made, and a true learning curve was built. At various times, it was necessary to redo all the predictions, for example, to insert or remove a certain curve, due to signs of overfitting-which occurs when the model becomes super specialized in the training data but has little capacity to be generalist in new data-and even due to problems with momentary system interruptions. Therefore, in order to prevent data leakage when redoing the flow, such as training a model with more “recent” data and applying it to previous depths, a routine was created to simulate drilling in these cases.
Regarding the data, some specific inconsistencies were noticed. For example, the ROP data obtained by manipulating the time base of the system (R) proved to be somewhat inconsistent. It was preferred to use the ROP of system (E), even though the statistical information of this data was lost.
Specific models were trained/applied for different LWD profiles in the RES and SAL phases. It was noted that the predictions were reasonable for the DTC, GR, RHOB and neutron (NEU) profiles. In the final section of the well there was a transmission problem in the system (R) that made predictions impossible. The results were compared with the porosity obtained in the NMR profile after wireline logging. In general, the product showed the main trends of increase/reduction in porosity.
Claims
1. A computer implemented method for real-time LWD profile prediction in the intervals from a drill tip to a limit of depth profile offsets, comprising:
(a) importing first data of LWD profiles in depth from an available first database;
(b) importing second data of drilling parameters in time from an available second database;
(c) applying filters to drilling parameters in real-time by removing records with ROP, WOB, RPM and torque values less than or equal to zero;
(d) converting second data in time to depth by calculating statistical attributes of said drilling parameters in time contained in specific intervals and having constant depth spacing;
(e) combining said drilling parameters converted to depth in step (d) with said LWD profile data imported in step (a) using depth as a reference;
(f) training machine learning models, based on supervised regressions, for each said LWD profile with the first database above each respective depth offset;
(g) performing inferences to predict each said LWD profile with its respective model using training features in an interval corresponding to the current depth of a drill up to the respective offset limits;
(h) periodically checking whether there has been progress in drilling, if so, repeating step (f) by training the models with any new data and, subsequently, step (g), performing new inferences with respect to the new data; and
(i) sending the results of each new prediction to a third database, the results being used by a visualization tool and made available to a user.
2. The computer implemented method according to claim 1, wherein the target LWD profiles comprise layers (labels) in step (f).
3. The computer implemented method according to claim 1, wherein in step (g) characteristics of statistical attributes of drilling parameters comprise torque, weight on drill (WOB), rate of penetration (ROP), revolutions per minute (RPM), MSE (mechanical specific energy), pumping pressure (SPP), drilled phase, drill type, drill run, or combination thereof.
4. A non-transitory computer-readable storage medium comprising instructions stored thereon and, when read by a computer, cause the computer to execute the steps of the method as defined by claim 1.
Images & Drawings included:


Sources:
- United States Patent and Trademark Office - verify current appl. status at the USPTO↗
Recent applications in this class:
- » 20240392677 2024-11-28
RATE OF PENETRATION PREDICTION AND USES THEREOF - » 20240200438 2024-06-20
REAL-TIME DRILLING PARAMETER ADHERENCE - » 20230323765 2023-10-12
SYNCHRONIZATION OF TOOL ACCELERATION VS TIME DATA AND DRILLER DEPTH VS TIME DATA - » 20230279767 2023-09-07
Methods for estimating downhole weight on bit and rate of penetration using acceleration measurements - » 20230184085 2023-06-15
Drilling Rate Of Penetration - » 20230184084 2023-06-15
Method for determining pore pressures of a reservoir - » 20230070571 2023-03-09
Intelligent Peak Detection Method Under Physical Phenomenon - » 20230031743 2023-02-02
Method for estimating rate of penetration while drilling - » 20210301643 2021-09-30
Method for evaluating downhole working condition of a PDC bit - » 20210293130 2021-09-23
System and method to predict value and timing of drilling operational parameters
Recent applications for this Assignee:
- » 20250182304 2025-06-05
AUTOMATIC TRACKING METHOD FOR CO-REGISTRATION OF 2D SEM IMAGES AND 3D TOMOGRAPHIC DATA OF ROCK CYLINDERS - » 20250180419 2025-06-05
TORQUE APPLICATION SYSTEM - » 20250179986 2025-06-05
SUBSEA SYSTEM FOR ENERGY CAPTURE ON FLOATING PLATFORMS - » 20250178041 2025-06-05
SAFETY SYSTEM AND METHOD FOR HYDRO JETTING GUNS - » 20250173887 2025-05-29
METHOD FOR MEASURING OIL DISPERSION CAPACITY ON WATER SURFACE - » 20250171676 2025-05-29
NON-AQUEOUS BASED COMPLETION FLUID COMPOSITION - » 20250122101 2025-04-17
PROCESS AND SYSTEM FOR WATER TREATMENT IN OFFSHORE OIL PRODUCTION FACILITIES - » 20250121489 2025-04-17
Gripper Applicator for External Gripping Tool - » 20250109816 2025-04-03
DEVICE FOR LEAK CONTAINMENT - » 20250102700 2025-03-27
COMPUTER-IMPLEMENTED METHOD FOR MULTI-SCALE UNSUPERVISED CLASSIFICATION OF ELECTRO-FACIES