FLUID PROPERTIES ESTIMATION IN FORMATION TESTING AND SAMPLING
US20260139587A1
2026-05-21
18/949,678
2024-11-15
Smart Summary: A new method allows for measuring important properties of oil and gas directly in a well. It uses a special tool that goes deep into the ground to check the temperature, pressure, and characteristics of the reservoir fluids. This tool can measure things like how dense the fluid is and how thick it is while still inside the well. By doing this, it can calculate the oil formation volume factor (FVF) or the gas to oil ratio (GOR) in real time. This helps in understanding the quality and behavior of the oil and gas without needing to bring samples to the surface first. 🚀 TL;DR
Abstract:
A method and system for downhole measurements of reservoir temperature and pressure and reservoir fluid compressibility, density, viscosity, and bubble point pressure to obtain an oil formation volume factor (FVF) or a gas to oil ratio (GOR) in real time are disclosed. In embodiments, methods include conveying a downhole formation analysis tool into a wellbore, measuring reservoir fluid compressibility, density, viscosity, and bubble point pressure, and obtaining the oil formation volume factor (FVF) or the gas to oil ratio (GOR) while the fluid sampling tool is still in the wellbore.
Inventors:
- Christopher Michael Jones 194 🇺🇸 Houston, TX, United States
- Mehdi Ali Pour KALLEHBASTI 13 🇺🇸 Houston, TX, United States
- Wael Soliman Mohamed Elhawary 3 🇺🇸 Houston, TX, United States
Assignee:
- HALLIBURTON ENERGY SERVICES, INC. 10,722 🇺🇸 Houston, TX, United States
Applicant:
Interested in similar patents?
Get notified when new applications in this technology area are published.
Classification:
E21B49/0875 » CPC main
Testing the nature of borehole walls; Formation testing; Methods or apparatus for obtaining samples of soil or well fluids, specially adapted to earth drilling or wells; Obtaining fluid samples or testing fluids, in boreholes or wells; Well testing, e.g. testing for reservoir productivity or formation parameters determining specific fluid parameters
E21B2200/20 » CPC further
Special features related to earth drilling for obtaining oil, gas or water Computer models or simulations, e.g. for reservoirs under production, drill bits
E21B2200/22 » CPC further
Special features related to earth drilling for obtaining oil, gas or water Fuzzy logic, artificial intelligence, neural networks or the like
E21B49/08 IPC
Testing the nature of borehole walls; Formation testing; Methods or apparatus for obtaining samples of soil or well fluids, specially adapted to earth drilling or wells Obtaining fluid samples or testing fluids, in boreholes or wells
Description
BACKGROUND
Wells may be drilled at various depths to access and produce oil, gas, minerals, and other naturally occurring deposits from subterranean geological formations. The drilling of a well is typically accomplished with a drill bit that is rotated within the well to advance the well by removing topsoil, sand, clay, limestone, calcites, dolomites, or other materials. During or after drilling operations, sampling operations may be performed to collect a representative sample of formation or reservoir fluids (e.g., hydrocarbons) to further evaluate drilling operations and production potential, or to detect the presence of certain gases or other materials in the formation that may affect well production.
Having an accurate and comprehensive understanding of volumetric changes and phase behavior of the reservoir fluid at flowing pressure and temperature conditions from the producing reservoir to surface is the cornerstone of subsurface analysis in the oil and gas industry. It is required for designing an effective field development plan and optimizing production and fluid recoveries from oil and gas reservoirs. The phase behavior and volumetric changes of the reservoir fluids, which are typically multi-phase, are a function of the reservoir pressure, temperature, and fluid composition. During the petroleum recovery period, the temperature of the reservoir may be maintained at an approximately constant value. However, the reservoir pressure changes at varying degrees depending upon the reservoir drive mechanisms, quantities of fluids injected into the reservoir over its producing life, and pressure decline induced by the production of the reservoir fluid. Thus, reservoir pressure is often regarded as a key influence in determining reservoir-fluid-phase behavior for flow assurance. Compositional changes also occur over the producing life of a reservoir, particularly to the gas to oil ratio and gas density, where gas liquids are removed from the gaseous phase, either at the surface or in the reservoir.
Bubble-point pressure (Pb) and oil formation volume factor (FVF) are key properties of the reservoir fluid because of their importance to reservoir engineering, geological assessment, and influence reservoir management and decision making. The bubble point pressure (Pb) of a hydrocarbon producing reservoir is defined as the highest pressure at which a bubble of gas is first liberated from the oil. This important property may be measured experimentally for a crude oil system by conducting a constant composition expansion (CCE) test. The oil formation volume factor is defined as the oil and dissolved gas volume at reservoir conditions divided by the oil volume at standard conditions. Since most measurements of oil and gas production are made at surface and the fluid flow takes place in the formation, formation volume factors are needed to convert measured surface volumes to reservoir conditions. Oil formation volume factors are almost always greater than 1.0 because the oil in the formation usually contains dissolved gas that comes out of solution in the wellbore with dropping pressure on its way to the surface.
Generally, the properties of reservoir fluids, including bubble point pressure and oil formation volume factor, may be accurately measured directly through laboratory-based experimental testing or laboratory pressure volume temperature (PVT) testing. However, sample collection requirements for PVT testing are onerous as representative reservoir fluid samples are difficult to acquire with a formation analysis and sampling tool and time consuming to perform. In some production situations, it can be difficult to obtain enough representative reservoir fluid samples from producing reservoirs, or the samples obtained are unreliable because of their collection and transportation conditions, making it impossible to perform representative laboratory pressure volume temperature (PVT) measurements.
BRIEF DESCRIPTION OF THE DRAWINGS
The features and advantages of certain embodiments will be more readily appreciated when considered in conjunction with the accompanying figures. The figures are not to be construed as limiting any of the preferred embodiments.
FIG. 1 illustrates a schematic view of a well in which an example embodiment of a downhole formation analysis tool is deployed;
FIG. 2 illustrates a schematic view of another well in which an example embodiment of a drilling downhole formation analysis tool is deployed;
FIG. 3 illustrates a schematic view of a chipset in an information handling system according to embodiments of the present disclosure;
FIG. 4 illustrates the chipset in communication with other components of the information handling system according to embodiments of the present disclosure;
FIG. 5 illustrates a schematic view of a cloud-based system according to embodiments of the present disclosure;
FIG. 6 illustrates a neural network according to embodiments of the present disclosure;
FIG. 7 illustrates a schematic view of an example embodiment of a formation analysis and sampling tool according to embodiments of the present disclosure;
FIG. 8 illustrates an enlarged schematic view of an enhanced probe section according to embodiments of the present disclosure; and
FIG. 9 illustrates a workflow according to embodiments of the present disclosure.
DETAILED DESCRIPTION
The present disclosure relates to subterranean operations and, more particularly, embodiments disclosed herein provide methods and systems for downhole measurements of reservoir temperature and pressure and reservoir fluid compressibility, density, viscosity, and bubble point pressure to obtain oil formation volume factor (FVF) and/or gas to oil ratio (GOR) in real time. The obtention of the oil formation volume factor (FVF) and/or gas to oil ratio (GOR) while the formation analysis and sampling tool is still downhole gives the operator the ability to decide whether measurements at a specific station should be performed again to validate unexpected results and save time and money in the process as the formation analysis and sampling tool is already downhole and avoid a second trip of the formation analysis and sampling tool from surface to the specific station where unexpected results were obtained and/or in the proximity of the specific station. Further, the operator may decide to collect at least one sample of the reservoir fluid at the specific station where unexpected results were obtained and/or in its proximity giving the operator the ability to make informed decisions in real time saving time and money by avoiding a second trip or more downhole.
The downhole measurements of these reservoir properties and reservoir fluid properties may be performed by any downhole formation analysis tool capable of performing these measurements including downhole fluid analysis and sampling tool or fluid sampling tool. The downhole formation analysis tool, systems and methods described herein may be used with any of the various techniques employed for evaluating a well, including without limitation wireline formation testing (WFT), measurement while drilling (MWD), and logging while drilling (LWD). The various tools and sampling units described herein may be delivered downhole as part of a wireline-delivered downhole assembly or as a part of a drill string. It should also be apparent that given the benefit of this disclosure, the apparatuses and methods described herein have applications in downhole operations other than drilling and may also be used after a well is completed.
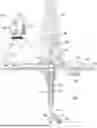
FIG. 1 is a schematic diagram of downhole formation analysis tool 100 on a conveyance 102. As illustrated, wellbore 104 may extend through subterranean formation 106. In examples, reservoir fluid may be contaminated with well fluid (e.g., drilling fluid) from wellbore 104. As described herein, the reservoir fluid sample may be analyzed to determine fluid contamination and other fluid properties of the reservoir fluid. As illustrated, a wellbore 104 may extend through subterranean formation 106. While the wellbore 104 is shown extending generally vertically into the subterranean formation 106, the principles described herein are also applicable to wellbores that extend at an angle through the subterranean formation 106, such as horizontal and slanted wellbores. For example, although FIG. 1 shows a vertical or low inclination angle well, high inclination angle or horizontal placement of the well and equipment is also possible. It should further be noted that while FIG. 1 generally depicts a land-based operation, those skilled in the art will readily recognize that the principles described herein are equally applicable to subsea operations that employ floating or sea-based platforms and rigs, without departing from the scope of the disclosure.
As illustrated, a hoist 108 may be used to run downhole formation analysis tool 100 into wellbore 104. Hoist 108 may be disposed on a vehicle 110 and controlled by operator 132. Hoist 108 may be used, for example, to raise and lower conveyance 102 in wellbore 104. While hoist 108 is shown on vehicle 110, it should be understood that conveyance 102 may alternatively be disposed from a hoist 108 that is installed at surface 112 instead of being located on vehicle 110. Downhole formation analysis tool 100 may be suspended in wellbore 104 on conveyance 102. Other conveyance types may be used for conveying downhole formation analysis tool 100 into wellbore 104, including coiled tubing and wired drill pipe, for example. Downhole formation analysis tool 100 may comprise a tool body 114, which may be elongated as shown on FIG. 1. Tool body 114 may be any suitable material, including without limitation titanium, stainless steel, alloys, plastic, combinations thereof, and the like. Downhole formation analysis tool 100 may further include one or more sensors 116 for measuring properties of the reservoir fluid sample, reservoir fluid, wellbore 104, subterranean formation 106, or the like. In examples, downhole formation analysis tool 100 may also include a fluid analysis module 118, which may be operable to process information regarding reservoir fluid sample, as described below. Downhole formation analysis tool 100 may be used to collect reservoir fluid samples from subterranean formation 106 and may obtain and separately store different reservoir fluid samples from subterranean formation 106.
In examples, fluid analysis module 118 may comprise at least one sensor that may continuously monitor a reservoir fluid. Such sensors include optical sensors, acoustic sensors, electromagnetic sensors, conductivity sensors, resistivity sensors, selective electrodes, density sensors, mass sensors, thermal sensors, chromatography sensors, viscosity sensors, bubble point sensors, fluid compressibility sensors, flow rate sensors, pressure sensors, and/or nuclear magnetic resonance (NMR) sensors, microfluidic sensor including but not limited to microfluidic pressure, volume, and temperature (PVT) phase behavior sensors. Sensors may measure a contrast between drilling fluid filtrate properties and formation fluid properties. Fluid analysis module 118 may be operable to derive properties and characterize the reservoir fluid sample. By way of example, fluid analysis module 118 may measure absorption, transmittance, or reflectance spectra and translate such measurements into component concentrations of the reservoir fluid sample, which may be lumped component concentrations, as described above. The fluid analysis module 118 may also measure gas-to-oil ratio, fluid composition, fluid compressibility, bubble point pressure, water cut, live fluid density, live fluid viscosity, formation pressure, and formation temperature. Fluid analysis module 118 may also be operable to determine fluid contamination of the reservoir fluid sample and may include any instrumentality or aggregate of instrumentalities operable to compute, classify, process, transmit, receive, retrieve, originate, switch, store, display, manifest, detect, record, reproduce, handle, or utilize any form of information, intelligence, or data for business, scientific, control, or other purposes. The absorption, transmittance, or reflectance spectra absorption, transmittance, or reflectance spectra may be measured with sensors 116 by way of standard operations. For example, fluid analysis module 118 may include random access memory (RAM), one or more processing units, such as a central processing unit (CPU), or hardware or software control logic, ROM, and/or other types of nonvolatile memory.
Any suitable technique may be used for transmitting signals from the downhole formation analysis tool 100 to the surface 112. As illustrated, a communication link 120 (which may be wired or wireless, for example) may be provided that may transmit data from downhole formation analysis tool 100 to an information handling system 122 at surface 112. Information handling system 122 may include a processing unit 124, a monitor 126, an input device 128 (e.g., keyboard, mouse, etc.), and/or computer media 130 (e.g., optical disks, magnetic disks) that can store code representative of the methods described herein. Information handling system 122 may act as a data acquisition system and possibly a data processing system that analyzes information from downhole formation analysis tool 100. For example, information handling system 122 may process the information from downhole formation analysis tool 100 for determination of fluid contamination. The information handling system 122 may also determine additional properties of the reservoir fluid sample (or reservoir fluid), such as component concentrations, pressure-volume-temperature properties (e.g., bubble point, phase envelop prediction, etc.), formation volume factor, gas-oil ratio, based on the fluid characterization. This processing may occur at surface 112 in real-time. Alternatively, the processing may occur downhole or at surface 112 or another location after recovery of downhole formation analysis tool 100 from wellbore 104. Alternatively, the processing may be performed by an information handling system 122 in wellbore 104, such as fluid analysis module 118. The resultant fluid contamination and fluid properties may then be transmitted to surface 112, for example, in real-time. Real time may be defined within any range comprising 0.01 seconds to 0.1 seconds, 0.1 seconds to 1 second, 1 second to 1 minute, 1 minute to 1 hour, 1 hour to 4 hours, or any combination of ranges provided.
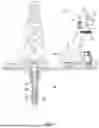
Referring now to FIG. 2, a schematic diagram of downhole formation analysis tool 100 disposed on a drill string 200 in a drilling operation. Downhole formation analysis tool 100 may be used to obtain a reservoir fluid sample, for example, a fluid sample of a reservoir fluid from subterranean formation 106. The reservoir fluid may be contaminated with well fluid (e.g., drilling fluid) from wellbore 104. As described herein, the fluid sample may be analyzed to determine fluid contamination and other fluid properties of the reservoir fluid. As illustrated, a wellbore 104 may extend through subterranean formation 106. While the wellbore 104 is shown extending generally vertically into the subterranean formation 106, the principles described herein are also applicable to wellbores that extend at an angle through the subterranean formation 106, such as horizontal and slanted wellbores. For example, although FIG. 2 shows a vertical or low inclination angle well, high inclination angle or horizontal placement of the well and equipment is also possible. It should further be noted that while FIG. 2 generally depicts a land-based operation, those skilled in the art will readily recognize that the principles described herein are equally applicable to subsea operations that employ floating or sea-based platforms and rigs, without departing from the scope of the disclosure.
As illustrated, a drilling platform 202 may support a derrick 204 having a traveling block 206 for raising and lowering drill string 200. Drill string 200 may include, but is not limited to, drill pipe and coiled tubing, as generally known to those skilled in the art. A kelly 208 may support drill string 200 as it may be lowered through a rotary table 210. A drill bit 212 may be attached to the distal end of drill string 200 and may be driven either by a downhole motor and/or via rotation of drill string 200 from surface 112. Without limitation, drill bit 212 may include, roller cone bits, PDC bits, natural diamond bits, any hole openers, reamers, coring bits, and the like. As drill bit 212 rotates, it may create and extend wellbore 104 that penetrates various subterranean formations 106. A pump 214 may circulate drilling fluid through a feed pipe 216 to kelly 208, downhole through interior of drill string 200, through orifices in drill bit 212, back to surface 112 via annulus 218 surrounding drill string 200, and into a retention pit 220.
Drill bit 212 may be just one piece of a downhole assembly that may include one or more drill collars 222 and downhole formation analysis tool 100. Downhole formation analysis tool 100, which may be built into the drill collars 222 may gather measurements and fluid samples as described herein. One or more of the drill collars 222 may form a tool body 114, which may be elongated as shown on FIG. 2. Tool body 114 may be any suitable material, including without limitation titanium, stainless steel, alloys, plastic, combinations thereof, and the like. Downhole formation analysis tool 100 may be similar in configuration and operation to downhole formation analysis tool 100 shown on FIG. 1 except that FIG. 2 shows downhole formation analysis tool 100 disposed on drill string 200. Alternatively, downhole formation analysis tool 100 may be lowered into the wellbore after drilling operations on a wireline.
Downhole formation analysis tool 100 may further include one or more sensors 116 for measuring properties of the reservoir fluid, reservoir fluid sample, wellbore 104, subterranean formation 106, or the like. The one or more sensors 116 may be disposed within fluid analysis module 118. In examples, more than one fluid analysis module may be disposed on drill string 200. The properties of the reservoir fluid are measured as the reservoir fluid passes from the formation through the tool and into either the wellbore or a sample container. As reservoir fluid is flushed in the near wellbore region by the mechanical pump, the reservoir fluid that passes through the tool generally reduces in drilling fluid filtrate content, and generally increases in formation fluid content. Downhole formation analysis tool 100 may be used to collect a reservoir fluid sample from subterranean formation 106 when the filtrate content has been determined to be sufficiently low. Sufficiently low depends on the purpose of sampling. For some laboratory testing below, 10% drilling fluid contamination is sufficiently low, and for other testing below, 1% drilling fluid filtrate contamination is sufficiently low. Sufficiently low also depends on the nature of the formation fluid such that lower requirements are generally needed, the lighter the oil as designated with either a higher GOR or a higher API gravity. Sufficiently low also depends on the rate of cleanup in a cost benefit analysis since longer pump out times required to incrementally reduce the contamination levels may have prohibitively large costs. As previously described, the reservoir fluid sample may comprise a reservoir fluid, which may be contaminated with a drilling fluid or drilling fluid filtrate. Downhole formation analysis tool 100 may obtain and separately store different fluid samples from subterranean formation 106 with fluid analysis module 118. Fluid analysis module 118 may operate and function in the same manner as described above. However, storing of the fluid samples in the downhole formation analysis tool 100 may be based on the determination of the fluid contamination. For example, if the reservoir fluid contamination exceeds a tolerance, then the reservoir fluid sample may not be stored. If the fluid contamination is within a tolerance, then the reservoir fluid sample may be stored in the downhole formation analysis tool 100. In examples, contamination may be defined within fluid analysis module 118.
As previously described, information from downhole formation analysis tool 100 may be transmitted to an information handling system 122, which may be located at surface 112. As illustrated, communication link 120 (which may be wired or wireless, for example) may be provided that may transmit data from downhole formation analysis tool 100 to an information handling system 122 at surface 112. Information handling system 122 may include a processing unit 124, a monitor 126, an input device 128 (e.g., keyboard, mouse, etc.), and/or computer media 130 (e.g., optical disks, magnetic disks) that may store code representative of the methods described herein. In addition to, or in place of processing at surface 112, processing may occur downhole (e.g., fluid analysis module 118). In examples, information handling system 122 may perform computations to estimate asphaltenes within a fluid sample.
FIG. 3 illustrates an example information handling system 122 which may be employed to perform various steps, methods, and techniques disclosed herein. Persons of ordinary skill in the art will readily appreciate that other system examples are possible. As illustrated, information handling system 122 includes a processing unit (CPU or processor) 302 and a system bus 304 that couples various system components including system memory 306 such as read only memory (ROM) 308 and random access memory (RAM) 310 to processor 302. Processors disclosed herein may all be forms of this processor 302. Information handling system 122 may include a cache 312 of high-speed memory connected directly with, in close proximity to, or integrated as part of processor 302. Information handling system 122 copies data from memory 306 and/or storage device 314 to cache 312 for quick access by processor 302. In this way, cache 312 provides a performance boost that avoids processor 302 delays while waiting for data. These and other modules may control or be configured to control processor 302 to perform various operations or actions. Other system memory 306 may be available for use as well. Memory 306 may include multiple different types of memory with different performance characteristics. It may be appreciated that the disclosure may operate on information handling system 122 with more than one processor 302 or on a group or cluster of computing devices networked together to provide greater processing capability. Processor 302 may include any general purpose processor and a hardware module or software module, such as first module 316, second module 318, and third module 320 stored in storage device 314, configured to control processor 302 as well as a special-purpose processor where software instructions are incorporated into processor 302. Processor 302 may be a self-contained computing system, containing multiple cores or processors, a bus, memory controller, cache, etc. A multi-core processor may be symmetric or asymmetric. Processor 302 may include multiple processors, such as a system having multiple, physically separate processors in different sockets, or a system having multiple processor cores on a single physical chip. Similarly, processor 302 may include multiple distributed processors located in multiple separate computing devices but working together such as via a communications network. Multiple processors or processor cores may share resources such as memory 306 or cache 312 or may operate using independent resources. Processor 302 may include one or more state machines, an application specific integrated circuit (ASIC), or a programmable gate array (PGA) including a field PGA (FPGA).
Each individual component discussed above may be coupled to system bus 304, which may connect each and every individual component to each other. System bus 304 may be any of several types of bus structures including a memory bus or memory controller, a peripheral bus, and a local bus using any of a variety of bus architectures. A basic input/output (BIOS) stored in ROM 308 or the like, may provide the basic routine that helps to transfer information between elements within information handling system 122, such as during start-up. Information handling system 122 further includes storage devices 314 or machine-readable storage media such as a hard disk drive, a magnetic disk drive, an optical disk drive, tape drive, solid-state drive, RAM drive, removable storage devices, a redundant array of inexpensive disks (RAID), hybrid storage device, or the like. Storage device 314 may include software modules 316, 318, and 320 for controlling processor 302. Information handling system 122 may include other hardware or software modules. Storage device 314 is connected to the system bus 304 by a drive interface. The drives and the associated machine-readable storage devices provide nonvolatile storage of machine-readable instructions, data structures, program modules and other data for information handling system 122. In one aspect, a hardware module that performs a particular function includes the software component stored in a tangible machine-readable storage device in connection with the necessary hardware components, such as processor 302, system bus 304, and so forth, to carry out a particular function. In another aspect, the system may use a processor and machine-readable storage device to store instructions which, when executed by the processor, cause the processor to perform operations, a method or other specific actions. The basic components and appropriate variations may be modified depending on the type of device, such as whether information handling system 122 is a small, handheld computing device, a desktop computer, or a computer server. When processor 302 executes instructions to perform “operations”, processor 302 may perform the operations directly and/or facilitate, direct, or cooperate with another device or component to perform the operations.
As illustrated, information handling system 122 employs storage device 314, which may be a hard disk or other types of machine-readable storage devices which may store data that are accessible by a computer, such as magnetic cassettes, flash memory cards, digital versatile disks (DVDs), cartridges, random access memories (RAMs) 310, read only memory (ROM) 308, a cable containing a bit stream and the like, may also be used in the exemplary operating environment. Tangible machine-readable storage media, machine-readable storage devices, or machine-readable memory devices, expressly exclude media such as transitory waves, energy, carrier signals, electromagnetic waves, and signals per se.
To enable user interaction with information handling system 122, an input device 322 represents any number of input mechanisms, such as a microphone for speech, a touch-sensitive screen for gesture or graphical input, keyboard, mouse, motion input, speech and so forth. Additionally, input device 322 may take in data from one or more sensors 116, discussed above. An output device 324 may also be one or more of a number of output mechanisms known to those of skills in the art. In some instances, multimodal systems enable a user to provide multiple types of input to communicate with information handling system 122. Communications interface 326 generally governs and manages the user input and system output. There is no restriction on operating on any particular hardware arrangement and therefore the basic hardware depicted may easily be substituted for improved hardware or firmware arrangements as they are developed.
As illustrated, each individual component described above is depicted and disclosed as individual functional blocks. The functions these blocks represent may be provided through the use of either shared or dedicated hardware, including, but not limited to, hardware capable of executing software and hardware, such as a processor 302, that is purpose-built to operate as an equivalent to software executing on a general purpose processor. For example, the functions of one or more processors presented in FIG. 3 may be provided by a single shared processor or multiple processors. (Use of the term “processor” should not be construed to refer exclusively to hardware capable of executing software.) Illustrative embodiments may include microprocessor and/or digital signal processor (DSP) hardware, read-only memory (ROM) 308 for storing software performing the operations described below, and random-access memory (RAM) 310 for storing results. Very large-scale integration (VLSI) hardware embodiments, as well as custom VLSI circuitry in combination with a general-purpose DSP circuit, may also be provided.
The logical operations of the various methods, described below, are implemented as: (1) a sequence of computer implemented steps, operations, or procedures running on a programmable circuit within a general use computer, (2) a sequence of computer implemented steps, operations, or procedures running on a specific-use programmable circuit; and/or (3) interconnected machine modules or program engines within the programmable circuits. Information handling system 122 may practice all or part of the recited methods, may be a part of the recited systems, and/or may operate according to instructions in the recited tangible machine-readable storage devices. Such logical operations may be implemented as modules configured to control processor 302 to perform particular functions according to the programming of software modules 316, 318, and 320.
In examples, one or more parts of the example information handling system 122, up to and including the entire information handling system 122, may be virtualized. For example, a virtual processor may be a software object that executes according to a particular instruction set, even when a physical processor of the same type as the virtual processor is unavailable. A virtualization layer or a virtual “host” may enable virtualized components of one or more different computing devices or device types by translating virtualized operations to actual operations. Ultimately however, virtualized hardware of every type is implemented or executed by some underlying physical hardware. Thus, a virtualization computer layer may operate on top of a physical computer layer. The virtualization computer layer may include one or more virtual machines, an overlay network, a hypervisor, virtual switching, and any other virtualization application.
FIG. 4 illustrates an example information handling system 122 having a chipset architecture that may be used in executing the described method and generating and displaying a graphical user interface (GUI). Information handling system 122 is an example of computer hardware, software, and firmware that may be used to implement the disclosed technology. Information handling system 122 may include a processor 302, representative of any number of physically and/or logically distinct resources capable of executing software, firmware, and hardware configured to perform identified computations. Processor 302 may communicate with a chipset 400 that may control input to and output from processor 302. In this example, chipset 400 outputs information to output device 324, such as a display, and may read and write information to storage device 314, which may include, for example, magnetic media, and solid-state media. Chipset 400 may also read data from and write data to RAM 310. A bridge 402 for interfacing with a variety of user interface components 404 may be provided for interfacing with chipset 400. Such user interface components 404 may include a keyboard, a microphone, touch detection and processing circuitry, a pointing device, such as a mouse, and so on. In general, inputs to information handling system 122 may come from any of a variety of sources, machine generated and/or human generated.
Chipset 400 may also interface with one or more communication interfaces 326 that may have different physical interfaces. Such communication interfaces may include interfaces for wired and wireless local area networks, for broadband wireless networks, as well as personal area networks. Some applications of the methods for generating, displaying, and using the GUI disclosed herein may include receiving ordered datasets over the physical interface or be generated by the machine itself by processor 302 analyzing data stored in storage device 314 or RAM 310. Further, information handling system 122 may receive inputs from a user via user interface components 404 and execute appropriate functions, such as browsing functions by interpreting these inputs using processor 302.
In examples, information handling system 122 may also include tangible and/or non-transitory machine-readable storage devices for carrying or having machine-executable instructions or data structures stored thereon. Such tangible machine-readable storage devices may be any available device that may be accessed by a general purpose or special purpose computer, including the functional design of any special purpose processor as described above. By way of example, and not limitation, such tangible machine-readable devices may include RAM, ROM, EEPROM, CD-ROM or other optical disk storage, magnetic disk storage or other magnetic storage devices, or any other device which may be used to carry or store desired program code in the form of machine-executable instructions, data structures, or processor chip design. When information or instructions are provided via a network, or another communications connection (either hardwired, wireless, or combination thereof), to a computer and/or machine, the computer and/or machine properly views the connection as a machine-readable medium. Thus, any such connection is properly termed a machine-readable medium. Combinations of the above should also be included within the scope of the machine-readable storage devices.
Machine-executable instructions include, for example, instructions and data which cause a general-purpose computer, special purpose computer, or special purpose processing device to perform a certain function or group of functions. Machine-executable instructions also include program modules that are executed by computers in stand-alone or network environments. Generally, program modules include routines, programs, components, data structures, objects, and the functions inherent in the design of special-purpose processors, etc. that perform particular tasks or implement particular abstract data types. Machine-executable instructions, associated data structures, and program modules represent examples of the program code means for executing steps of the methods disclosed herein. The particular sequence of such executable instructions or associated data structures represents examples of corresponding acts for implementing the functions described in such steps.
In additional examples, methods may be practiced in network computing environments with many types of computer system configurations, including personal computers, hand-held devices, multi-processor systems, microprocessor-based or programmable consumer electronics, network PCs, minicomputers, mainframe computers, and the like. Examples may also be practiced in distributed computing environments where tasks are performed by local and remote processing devices that are linked (either by hardwired links, wireless links, or by a combination thereof) through a communications network. In a distributed computing environment, program modules may be located in both local and remote memory storage devices. During drilling operations information handling system 122 may process different types of real time data which may be utilized to measure and/or calculate oil formation volume factor (FVF) and/or a gas to oil ratio (GOR).
FIG. 5 illustrates an example of one arrangement of resources in a computing network that may employ the processes and techniques described herein, although many others are of course possible. As noted above, an information handling system 122, as part of their function, may utilize data, which includes files, directories, metadata (e.g., access control list (ACLS) creation/edit dates associated with the data, etc.), and other data objects. The data on the information handling system 122 is typically a primary copy (e.g., a production copy). During a copy, backup, archive or other storage operation, information handling system 122 may send a copy of some data objects (or some components thereof) to a secondary storage computing device 504 by utilizing one or more data agents 502.
A data agent 502 may be a desktop application, website application, or any software-based application that is run on information handling system 122. As illustrated, information handling system 122 may be disposed at any rig site (e.g., referring to FIG. 1) or repair and manufacturing center. Data agent 502 may communicate with a secondary storage computing device 504 using communication protocol 508 in a wired or wireless system. Communication protocol 508 may function and operate as an input to a website application. In the website application, field data related to pre- and post-operations, generated DTCs, notes, and the like may be uploaded. Additionally, information handling system 122 may utilize communication protocol 508 to access processed measurements, operations with similar DTCs, troubleshooting findings, historical run data, and/or the like. This information is accessed from secondary storage computing device 504 by data agent 502, which is loaded on information handling system 122.
Secondary storage computing device 504 may operate and function to create secondary copies of primary data objects (or some components thereof) in various cloud storage sites 506A-N. Additionally, secondary storage computing device 504 may run determinative algorithms on data uploaded from one or more information handling systems 122, discussed further below. Communications between the secondary storage computing devices 504 and cloud storage sites 506A-N may utilize REST protocols (Representational State Transfer interfaces) that satisfy basic C/R/U/D semantics (Create/Read/Update/Delete semantics), or other hypertext transfer protocol (“HTTP”)-based or file-transfer protocol (“FTP”)-based protocols (e.g., Simple Object Access Protocol).
In conjunction with creating secondary copies in cloud storage sites 506A-N, the secondary storage computing device 504 may also perform local content indexing and/or local object-level, sub-object-level or block-level deduplication when performing storage operations involving various cloud storage sites 506A-N. Cloud storage sites 506A-N may further record and maintain DTC code logs for each downhole operation or run, map DTC codes, store repair and maintenance data, store operational data, and/or provide outputs from determinative algorithms that are fun at cloud storage sites 506A-N. This type of network may be utilized to process different types of real time data which may be utilized to measure and/or calculate oil formation volume factor (FVF) and/or a gas to oil ratio (GOR).
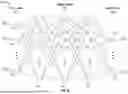
In examples to determine a relationship between measured reservoir fluid compressibility, density, viscosity, bubble point pressure, or any combination thereof and oil formation volume factor (FVF) and gas to oil ratio (GOR) using machine learning, a neural network (NN) 600, as illustrated in FIG. 6, may be utilized as discussed below. FIG. 6 illustrates neural network (NN) 600. NN 600 may operate utilizing one or more information handling systems 122 (e.g., referring to FIG. 1) on computing NN 600. Although a NN is illustrated, multiple models may be used with input output structures. These models may comprise flexible empirical models such as NN, gaussian processing methods, kriging methods, evolutionary methods such as genetic algorithms, classification methods, clustering methods empirical methods, or physics-based methods such as equations of state, thermodynamic models, geological, geochemistry, or chemistry models, or kinetic models or any combinations therein including recursive combinations of similar or dissimilar models and iterative model combinations. A NN 600 is an artificial neural network with one or more hidden layers 602 between input layer 604 and output layer 606. In examples, NN 600 may be software on a single information handling system 122. In other examples, NN 600 may software running on multiple information handling systems 122 connected wirelessly and/or by a hard-wired connection in a network of multiple information handling systems 122. Herein, NN 600 may be applied in a wide array of implementations.
During operations, inputs 608 data are given to neurons 612 in input layer 604. Neurons 612, 614, and 616 are defined as individual or multiple information handling systems 122 connected in a computing NN 600. The output from neurons 612 may be transferred to one or more neurons 614 within one or more hidden layers 602. Hidden layers 602 comprises one or more neurons 614 connected in a network that further process information from neurons 612. The number of hidden layers 602 and neurons 612 in hidden layer 602 may be determined by personnel that designs NN 600. Hidden layers 602 is defined as a set of information handling systems 122 assigned to specific processing. Hidden layers 602 spread computation to multiple neurons 612, which may allow for faster computing, processing, training, and learning by NN 600. Output from NN 600 may be computed by neurons 616. An information handling system 122 (e.g., referring to FIG. 1) being utilized in a computing NN 600, or alone may control operations described above.
As such, input layer 604 may include any number of inputs 608. Inputs 608 may comprise properties of reservoir fluid and/or fluid formations such as physical properties (bulk or molecular) such as density, index of refraction, reservoir fluid compressibility, bubble point, phase and/or other phase behavior properties measured by downhole formation analysis tool 100. In examples, inputs may also include transport properties such as viscosity or thermal conductivity. Fluid analysis modules 118 may determine optical, chromatographic, mass spectrometry, density sensor, viscosity sensor, phase change apparatus compressibility sensor resistivity sensor, capacitance or dielectric sensor acoustic sensor, or combinations therein. Additionally, inputs 608 may also include chemical properties including composition i.e., hydrocarbon composition (methane, ethane, propane, butane, pentane, hexane, higher hydrocarbons) and or chemical classes such as but not limited to Saturates, Aromatics, Resins, or Asphaltenes chemical classes, and their respective concentrations of the various components, pH, oxidation-reduction potential (eH), chemical potential, reactivity, fluid compatibility, and/or scaling potential. Fluid analysis modules 118 may comprise optical sensor, chromatographic sensor, mass spectrometry sensor, density sensor, viscosity sensor, phase change sensor, compressibility sensor, resistivity sensor, capacitance or dielectric sensor, acoustic sensor, or combinations thereof. In examples, inputs may include raw sensor measurements such as temperature, pressure, optical information, acoustic information, and/or electromagnetic information. Fluid analysis modules 118 may determine optical, chromatographic, mass spectrometry, density, viscosity, phase change, compressibility, gas to oil ratio, resistivity, capacitance, dielectric, acoustic properties, or any combinations thereof. In examples, output layer 606 may form output 610. Outputs 610 may comprise other unmeasured or less well measured physical or chemical properties, and/or correlated sensor measurements. For instance, outputs 610 may comprise scaling potential, or oil formation volume factor (FVF) and/or a gas to oil ratio (GOR) if not directly measured. Alternatively, the model may provide outputs 610 for enhanced resolution, precision or accuracy refinement of a measured property such as bubble point, or oil formation volume factor (FVF) and/or a gas to oil ratio (GOR) which may be included as an input 608 but refined as an enhanced measurement as an output 610 in output layer 606. Any of the inputs 608 or outputs 610 may be from the current well being evaluated or analogue wells which may be in the field, in the basis, or not so if other characteristics such as but not limited to formation type or formation fluid provide a basis for analogy.
During operations, inputs 608 data are given to neurons 612 in input layer 604. Neurons 612, 614, and 616 are defined as individual or multiple information handling systems 122 connected in a network, which may compute information to make drilling, completion, or production decisions such as but not limited to how to drill the well, where to drill the well, how to complete a well, or where to complete a well, or how to produce a well, or where to produce a well. Any of computations may be from the current well being evaluated or analogue wells which may be in the field, in the basis, or not so if other characteristics such as but not limited to formation type or formation fluid provide a basis for analogy. The output from neurons 612 may be transferred to one or more neurons 614 within one or more hidden layers 602. Hidden layers 602 includes one or more neurons 614 connected in a network that further process information from neurons 612. The number of hidden layers 602 and neurons 612 in hidden layer 602 may be determined by personnel that design NN 600. Hidden layers 602 is defined as a set of information handling system 122 assigned to specific processing. Hidden layers 602 spread computation to multiple neurons 612, 614, and 616, which may allow for faster computing, processing, training, and learning by NN 600. Output layers 606 may combine the processing in hidden layers 602, using neurons 616, to identify the oil Formation Volume Factor (FVF) and/or gas to oil ratio (GOR). By any of the modeling methods, output layers 606, wherein other methods may use different layer or subfunction structuring, may be coordinated such that simultaneously a FVF and/or GOR may be provided for different outputs each corresponding to a different depths or lateral distance across a field or distance from an injecting well, temperature or other state condition comprising at least formation or concentration of materials. Multiple outputs may be coordinated wherein the multiple outputs are different but related parameters which may include but is not limited to the oil formation volume factor (FVF) and/or gas to oil ratio (GOR), either static for a single state, or as a function independent variable such as but not limited to depth or lateral distance across a field or distance from an injecting well or of state variables such as but not limited to temperature. Other modeling methods include equations of state, kriging methods, random forest methods, classification methods, multivariate analysis methods and combinations therein.
FIG. 7 illustrates a schematic of downhole formation analysis tool 100. As illustrated, downhole formation analysis tool 100 includes a power telemetry section 702 through which downhole formation analysis tool 100 may communicate with other actuators and sensors in a conveyance (e.g., conveyance 102 on FIG. 1 or drill string 200 on FIG. 2), the conveyance's communications system, such as information handling system 122 (e.g., referring to FIG. 1). In examples, power telemetry section 702 may also be a port through which the various actuators (e.g., valves) and sensors (e.g., temperature and pressure sensors) in downhole formation analysis tool 100 may be controlled and monitored. In examples, power telemetry section 702 includes an information handling system 122 that exercises the control and monitoring function. In one example, the control and monitoring function is performed by an information handling system 122 in another part of the drill string or wireline tool (not shown) or by an information handling system 122 at surface 112.
Information from downhole formation analysis tool 100 may be gathered and/or processed by the information handling system 122 (e.g., referring to FIGS. 1 and 2). The processing may be performed real-time during data acquisition or after recovery of downhole formation analysis tool 100. Processing may alternatively occur downhole or may occur both downhole and at surface. In embodiments, processing is performed in real-time to give the ability to the operator to make informed decisions on reservoir fluid measurements and sampling strategies in real time or while formation downhole formation analysis tool 100 is still downhole. In some examples, signals recorded by downhole formation analysis tool 100 may be conducted to information handling system by way of conveyance. Information handling system 122 may process the signals, and the information contained therein may be displayed for an operator to observe and stored for future processing and reference. Information handling system 122 may also contain an apparatus for supplying control signals and power to downhole formation analysis tool 100.
In examples, downhole formation analysis tool 100 may include one or more enhanced probe sections 704. Each enhanced probe section may include a dual probe section 706 or a focus sampling probe section 708. Both of which may extract fluid from the reservoir and deliver it to a channel 710 that extends from one end of downhole formation analysis tool 100 to the other. Without limitation, dual probe section 706 includes two probes 712, 714 which may extend from downhole formation analysis tool 100 and press against the inner wall of wellbore 104 (e.g., referring to FIG. 1). Probe channels 716, 718 may connect probes 712, 714 to channel 710 and allow for continuous fluid flow from the formation 106 to channel 710. A high-volume bidirectional pump 720 may be used to pump fluids from the formation, through probe channels 716, 718 and to channel 710. Alternatively, a low volume pump bidirectional piston 722 may be used to remove reservoir fluid from the reservoir and house them for reservoir fluid bubble point pressure measurements, fluid compressibility measurements, or any combination thereof. Low volume pump bidirectional piston 722 may be capable of handling 5 mL, 10 mL, 25 mL, 50 mL, 75 mL, 100 mL, 125 mL, 250 mL, 500 mL or above of reservoir fluid. Two standoffs or stabilizers 724, 726 hold downhole formation analysis tool 100 in place as probes 712, 714 press against the wall of wellbore 104. In examples, probes 712, 714 and stabilizers 724, 726 may be retracted when downhole formation analysis tool 100 may be in motion and probes 712, 714 and stabilizers 724, 726 may be extended to sample the formation fluids at any suitable location in wellbore 104. As illustrated, probes 712, 714 may be replaced, or used in conjunction with, focus sampling probe section 708. Focus sampling probe section 708 may operate and function as discussed above for probes 712, 714 but with a single probe 728. Other probe examples may include, but are not limited to, oval probes, packers, and/or radial or circumferential probes.
In examples, channel 710 may connect other parts and sections of downhole formation analysis tool 100 to each other. For example, Additionally, downhole formation analysis tool 100 may include a second high-volume bidirectional pump 730 for pumping fluid through channel 710 to one or more multi-chamber sections 732, one or more amide side fluid density modules 734, and/or one or more sample side optics analyzers.
FIG. 8 illustrates an expanded view 800 of enhanced probe section 704 and fluid analysis module 736. As illustrated, enhanced probe section 704 includes low volume pump bidirectional piston 722 is utilized for bubble point pressure measurements, fluid compressibility measurements, or any combination thereof. The measurements of the reservoir fluid compressibility and bubble point pressure using enhanced probe section 704 are combined with the reservoir fluid viscosity and density acquired with fluid density modules 734 (not shown in FIG. 8) and the reservoir pressure and temperature measurements to obtain oil formation volume factor (FVF) and gas to oil ratio (GOR) in real time. The reservoir pressure and temperature measurements are obtained from Wireline or Logging While Drilling (LWD) operations mostly during sampling job. The data may be acquired with any pressure sampling and sampling tool such as Halliburton Reservoir Description Tool (RDT) or Geotap® Formation Pressure Testing ID in any form and shape. While FIG. 8 shows a special dual circular probe scenario, the probe may be of in any shape and or any configuration such as oval or focused or even sampling with straddle packer. In embodiments, bubble point pressure (Pb) and reservoir fluid compressibility (Co) are measured during the sampling job. In other embodiments, bubble point pressure (Pb) and reservoir fluid compressibility (Co) are provided from historical data. Alternatively, bubble point pressure (Pb) and reservoir fluid compressibility (Co) may be calculated. In embodiments, bubble point pressure (Pb) and reservoir fluid compressibility (Co) may be measured downhole through closing valves 804 positioned along each probe channels 716 and 718 and pressurizing or depressurizing the isolated volume with bidirectional pump 722 in multiple pressure or volume steps. The pressure-volume data in the next step is used to estimate bubble point pressure (Pb) and reservoir fluid compressibility (Co). Pressure and temperature are measured at all stages of the test to acquire indication of the fluid properties and conditions at each stage.
As illustrated in FIG. 8, these laboratory test may be reconstructed downhole using enhanced probe section 704. Specifically, testing methods include the use of housing 721 that includes a low volume bidirectional piston 722 within enhanced probe section 704. Housing 721 allows for low volume bidirectional piston 722 to draw in reservoir fluid for measurement, analyses, or testing within the housing. When sampling operations are being performed, as described above, reservoir fluid is extracted from a reservoir through a probe, such as focus sampling probe section 708 (referring to FIG. 7), and into downhole formation analysis tool 100 through probe channels 716 and 718. As illustrated, probe channels 716 and 718 may each be connected to independent zero offset pressure gauge 802. Downhole formation analysis tool 100 includes housing 721 and low volume bidirectional piston 722, where housing 721 may have from 25 mL to 1000 mL capacity including 100 mL of capacity and the capability to operate up to 20000 psi below hydrostatic pressure, which is monitored by another high-resolution pressure gauge 802. Additionally, probe channels 716 and 718 have the ability to isolate reservoir fluid from internal flowlines, such as channel 710, from the formation through one or more shut in valves 804 positioned along each probe channels 716 and 718. This allows enhanced probe section 704 to access fluids from either downhole formation analysis tool 100 or reservoir fluid taken through a probe.
As testing methods are performed with housing 721, additional testing methods may analyze reservoir fluid in channel 710 with one or more optical measurement tools 738 in fluid analysis module 736. Within the fluid analysis module, fluid composition including C1, C2, C3, C4, C5, C6+, Saturates, Aromatics, Resins, and Asphaltene concentrations, bubble point, viscosity, index of refractions, molecular weight, API gravity, Gas to Oil ratio (GOR), reservoir fluid compressibility, capacitance, dielectric spectroscopy, resistivity, optical throughput may be measured, for example.
Thus, measurement of reservoir fluid compressibility, bubble point pressure, density, temperature, and reservoir pressure may be performed in real time, downhole, in order to prevent catastrophic consequences that may require considerable costly remediation efforts. The measurement of these properties may be utilized to further find or refine equation of state (EOS) to estimate formation volume factor and gas to oil ratio in real time.
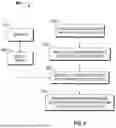
FIG. 9 illustrates a workflow 900 for determining the equation of state (EOS) to estimate the oil formation volume factor (FVF) and/or the gas to oil ratio (GOR) in real time. It should be noted that workflow 900 may be performed at least in part on information handling system 122 (e.g., referring to FIGS. 1 & 2). Workflow 900 may begin with block 902. In block 902, downhole formation analysis tool 100 may be disposed in wellbore 104 on conveyance 102 (e.g., referring to FIGS. 1 & 2) to a potential sampling station. A potential sampling station may include any station where downhole formation analysis tool 100 may stop to extract reservoir fluid from the formation and analyze it to determine its value as potential sample to retrieve to surface for laboratory analysis but also to determine reservoir connectivity, for example. The downhole analysis of the reservoir fluid may be performed using fluid analysis module 118. The downhole formation analysis tool 100, systems and methods described herein may be used with any of the various techniques employed for evaluating a well, including without limitation wireline formation testing (WFT), measurement while drilling (MWD), logging while drilling (LWD), but also with coiled tubing and wired drill pipe, for example.
When downhole formation analysis tool 100 is disposed at a potential sampling station in wellbore 104 in block 902, downhole formation analysis tool 100 may take one or more measurements of the reservoir fluid properties in block 904. In examples, the one or more measurements taken by downhole formation analysis tool 100 of reservoir fluid properties may comprise any chemical and physical properties capable of characterizing the reservoir fluid. For example, measurements may comprise reservoir fluid density, viscosity, compressibility, bubble point pressure, or any combination thereof.
The measurements of the reservoir fluid properties from block 904 may then be utilized as an input into a model in block 906 to calculate an oil formation volume factor (FVF) and/or a gas to oil ratio (GOR) in real time by downhole formation analysis tool 100. To calculate FVF and/or GOR in real time in block 906, in block 908 a model may be chosen to calculate FVF and/or GOR in real time. Models chosen in block 908 may be chosen from artificial intelligence/machine learning methods such as neural network/deep learning, xgboost, random-forest, support vector machine, for example. It may also use symbolic regression which express target value (FVF and GOR) as a function of input parameters. The model chosen in block 908 may operate and function according to the systems and methods described above in FIGS. 5 & 6. Additionally, the model in block 908 may be trained, at least in part, from previous data stored at least in part in a database in block 910. In block 910, data stored, at least in part in a database, may originate from existing database such as data obtained from previous downhole measurements, data obtained from previous surface measurements after downhole sampling, data obtained from prior art such as published data, or any combination thereof. Using data from block 910 in a model chosen in block 908, may allow for mathematical operations in block 906. Specifically, one or more measurements from block 904 may be input into the model, chosen from block 908 and trained with data from block 910, in block 906. As an output from block 906, the model may calculate FVF and/or GOR in real time from the one or more measurements captured in block 904 and utilized as inputs in block 906. The FVF and/or GOR may further be utilized by personnel to identify additional operations that may be performed based at least in part on the FVF and/or GOR.
In block 912, the FVF and/or GOR from block 906 may be reviewed by personnel to determine additional operations that may be performed based at least in part on the FVF and/or GOR. At such time, personnel may determine if one or more reservoir fluid measurements may be performed at the potential sampling station to validate the measurements performed in block 904. In other examples, personnel may determine from the FVF and/or GOR that reservoir fluid sampling operations may be performed if the reservoir fluid is deemed of interest for further laboratory measurements or convey downhole formation analysis tool 100 (e.g., referring to FIGS. 1 & 2) to another potential sampling station to perform measurement of reservoir fluid properties. Additionally, personnel may determine that downhole formation analysis tool 100 should return to surface when the reservoir fluid measurements as samples acquired in block 904 may be deemed sufficient or downhole formation analysis tool 100 needs maintenance.
The methods and systems disclosed above are an improvement over current technology as the obtention of the oil formation volume factor (FVF) and gas to oil ratio (GOR) while downhole formation analysis tool 100 is still downhole gives the operator the ability to decide whether measurements at a specific station should be reacquired to validate unexpected results and save time and money in the process as downhole formation analysis tool 100 is already downhole and avoid a second trip of downhole formation analysis tool 100 from surface to the specific station where unexpected results were obtained and/or in the proximity of the specific station. Further, the operator may decide to collect at least one sample of the reservoir fluid at the specific station where unexpected results were obtained and/or in its proximity giving the operator the ability to make informed decisions in real time saving time and money by avoiding a second trip downhole.
-
- Statement 1. A method comprising: conveying a downhole formation analysis tool into a wellbore; measuring a reservoir fluid for compressibility, density, viscosity, bubble point pressure, or any combination thereof; and calculating an oil formation volume factor (FVF) or a gas to oil ratio (GOR) from at least a part of one of the compressibility, the density, the viscosity, the bubble point pressure, or any combination thereof, while the downhole formation analysis tool is still in the wellbore.
- Statement 2. The method of Statement 1, wherein the oil formation volume factor (FVF) or the gas to oil ratio (GOR) is obtained while the downhole formation analysis tool is within two hours of conveyance from a location where the reservoir fluid compressibility, density, viscosity, bubble point pressure, or any combination thereof were measured.
- Statement 3. The method of Statement 1 or Statement 2, wherein the oil formation volume factor (FVF) or the gas to oil ratio (GOR) are obtained while the downhole formation analysis tool is still at the same location where the reservoir fluid compressibility, density, viscosity, bubble point pressure, or any combination thereof were measured.
- Statement 4. The method of any one of Statements 1-3, further comprising collecting at least one fluid sample after the oil formation volume factor (FVF) or the gas to oil ratio (GOR) are obtained.
- Statement 5. The method of any one of Statements 1-4, further comprising collecting at least one fluid sample in the same location where the reservoir fluid compressibility, density, viscosity, bubble point pressure, or any combination thereof were measured.
- Statement 6. The method of any one of Statements 1-5, further comprising collecting at least one fluid sample in the same location where the reservoir fluid compressibility, density, viscosity, bubble point pressure, or any combination thereof were measured and the oil formation volume factor (FVF) or the gas to oil ratio (GOR) were obtained.
- Statement 7. The method of any one of Statements 1-6, further comprising comparing the obtained oil formation volume factor (FVF) or the gas to oil ratio (GOR) with oil formation volume factors (FVF) or gas to oil ratio (GOR) from a database.
- Statement 8. The method of any one of Statements 1-7, further comprising comparing the obtained oil formation volume factor (FVF) or the gas to oil ratio (GOR) with an oil formation volume factor (FVF) or a gas to oil ratio (GOR) measured downhole in another well.
- Statement 9. The method of any one of Statements 1-8, further comprising comparing the obtained oil formation volume factor (FVF) or the gas to oil ratio (GOR) with an oil formation volume factor (FVF) or a gas to oil ratio (GOR) measured at surface after downhole sampling.
- Statement 10. The method of any one of Statements 1-9, wherein obtaining oil formation volume factor (FVF) or gas to oil ratio (GOR) comprises selecting a model from a group of models consisting of neural network/deep learning, xgboost, random-forest, support vector machine, and any combination thereof.
- Statement 11. The method of any one of Statements 1-10, wherein the model is trained at least in part from previous data stored at least in part in a database.
- Statement 12. The method of any one of Statements 1-11, wherein the database originates from data obtained from previous downhole measurements.
- Statement 13. The method of any one of Statements 1-12, wherein the database originates from data obtained from previous surface measurements after downhole sampling.
- Statement 14. The method of any one of Statements 1-13, wherein the database originates from data obtained from published data.
- Statement 15. The method of any one of Statements 1-14, wherein at least one of the measured reservoir fluid compressibility, density, viscosity, and bubble point pressure is an input to a model to calculate the oil formation volume factor (FVF).
- Statement 16. The method of any one of Statements 1-15, wherein at least one of the measured reservoir fluid compressibility, density, viscosity, and bubble point pressure is an input to a model to calculate the gas to oil ratio (GOR).
- Statement 17. The method of any one of Statements 1-16, wherein at least one of the measured reservoir fluid compressibility, density, viscosity, and bubble point pressure is an input to a model to calculate the oil formation volume factor (FVF) in real time.
- Statement 18. The method of any one of Statements 1-17, wherein at least one of the measured reservoir fluid compressibility, density, viscosity, and bubble point pressure is an input to a model to calculate the gas to oil ratio (GOR) in real time.
- Statement 19. The method of any one of Statements 1-18, wherein at least one of the measured reservoir fluid compressibility, density, viscosity, and bubble point pressure is an input to a model to calculate the oil formation volume factor (FVF) in real time, wherein the model is trained at least in part from previous data stored at least in part in a database.
- Statement 20. The method of any one of Statements 1-19, wherein at least one of the measured reservoir fluid compressibility, density, viscosity, and bubble point pressure is an input to a model to calculate the gas to oil ratio (GOR) in real time, wherein the model is trained at least in part from previous data stored at least in part in a database.
The preceding description provides various embodiments of the systems and methods of use disclosed herein which may contain different method steps and alternative combinations of components. It should be understood that, although individual embodiments may be discussed herein, the present disclosure covers all combinations of the disclosed embodiments, including, without limitation, the different component combinations, method step combinations, and properties of the system. It should be understood that the compositions and methods are described in terms of “including,” “containing,” or “including” various components or steps, the compositions and methods can also “consist essentially of” or “consist of” the various components and steps. Moreover, the indefinite articles “a” or “an,” as used in the claims, are defined herein to mean one or more than one of the element that it introduces.
For the sake of brevity, only certain ranges are explicitly disclosed herein. However, ranges from any lower limit may be combined with any upper limit to recite a range not explicitly recited, as well as, ranges from any lower limit may be combined with any other lower limit to recite a range not explicitly recited, in the same way, ranges from any upper limit may be combined with any other upper limit to recite a range not explicitly recited. Additionally, whenever a numerical range with a lower limit and an upper limit is disclosed, any number and any included range falling within the range are specifically disclosed. In particular, every range of values (of the form, “from about a to about b,” or, equivalently, “from approximately a to b,” or, equivalently, “from approximately a-b”) disclosed herein is to be understood to set forth every number and range encompassed within the broader range of values even if not explicitly recited. Thus, every point or individual value may serve as its own lower or upper limit combined with any other point or individual value or any other lower or upper limit, to recite a range not explicitly recited.
Therefore, the present embodiments are well adapted to attain the ends and advantages mentioned as well as those that are inherent therein. The particular embodiments disclosed above are illustrative only, and may be modified and practiced in different but equivalent manners apparent to those skilled in the art having the benefit of the teachings herein. Although individual embodiments are discussed, the disclosure covers all combinations of all of the embodiments. Furthermore, no limitations are intended to the details of construction or design herein shown, other than as described in the claims below. Also, the terms in the claims have their plain, ordinary meaning unless otherwise explicitly and clearly defined by the patentee. It is therefore evident that the particular illustrative embodiments disclosed above may be altered or modified and all such variations are considered within the scope and spirit of those embodiments. If there is any conflict in the usages of a word or term in this specification and one or more patent(s) or other documents that may be incorporated herein by reference, the definitions that are consistent with this specification should be adopted.
Claims
What is claimed is:1. A method comprising:
conveying a downhole formation analysis tool into a wellbore;
measuring a reservoir fluid for compressibility, density, viscosity, bubble point pressure, or any combination thereof; and
calculating an oil formation volume factor (FVF) or a gas to oil ratio (GOR) from at least a part of one of the compressibility, the density, the viscosity, the bubble point pressure, or any combination thereof, while the downhole formation analysis tool is still in the wellbore.
2. The method of claim 1, wherein the oil formation volume factor (FVF) or the gas to oil ratio (GOR) is obtained while the downhole formation analysis tool is within two hours of conveyance from a location where the reservoir fluid compressibility, density, viscosity, bubble point pressure, or any combination thereof were measured.
3. The method of claim 1, wherein the oil formation volume factor (FVF) or the gas to oil ratio (GOR) is obtained while the downhole formation analysis tool is still at the same location where the reservoir fluid compressibility, density, viscosity, bubble point pressure, or any combination thereof were measured.
4. The method of claim 1, further comprising collecting at least one fluid sample after the oil formation volume factor (FVF) or the gas to oil ratio (GOR) is obtained.
5. The method of claim 1, further comprising collecting at least one fluid sample in the same location where the reservoir fluid compressibility, density, viscosity, bubble point pressure, or any combination thereof were measured.
6. The method of claim 1, further comprising collecting at least one fluid sample in the same location where the reservoir fluid compressibility, density, viscosity, bubble point pressure, or any combination thereof were measured and the oil formation volume factor (FVF) or the gas to oil ratio (GOR) was obtained.
7. The method of claim 1, further comprising comparing the calculated oil formation volume factor (FVF) or the gas to oil ratio (GOR) with oil formation volume factors (FVF) or gas to oil ratio (GOR) from a database.
8. The method of claim 1, further comprising comparing the calculated oil formation volume factor (FVF) or the gas to oil ratio (GOR) with an oil formation volume factor (FVF) or a gas to oil ratio (GOR) measured downhole in another well.
9. The method of claim 1, further comprising comparing the calculated oil formation volume factor (FVF) or the gas to oil ratio (GOR) with an oil formation volume factor (FVF) or a gas to oil ratio (GOR) measured at surface after downhole sampling.
10. The method of claim 1, wherein obtaining oil formation volume factor (FVF) or gas to oil ratio (GOR) comprises selecting a model from a group of models consisting of neural network/deep learning, xgboost, random-forest, support vector machine, and any combination thereof.
11. The method of claim 10, wherein the model is trained at least in part from previous data stored at least in part in a database.
12. The method of claim 11, wherein the database originates from data obtained from previous downhole measurements.
13. The method of claim 11, wherein the database originates from data obtained from previous surface measurements after downhole sampling.
14. The method of claim 11, wherein the database originates from data obtained from published data.
15. The method of claim 1, wherein at least one of the measured reservoir fluid compressibility, density, viscosity, and bubble point pressure is an input to a model to calculate the oil formation volume factor (FVF).
16. The method of claim 1, wherein at least one of the measured reservoir fluid compressibility, density, viscosity, and bubble point pressure is an input to a model to calculate the gas to oil ratio (GOR).
17. The method of claim 1, wherein at least one of the measured reservoir fluid compressibility, density, viscosity, and bubble point pressure is an input to a model to calculate the oil formation volume factor (FVF) in real time.
18. The method of claim 1, wherein at least one of the measured reservoir fluid compressibility, density, viscosity, and bubble point pressure is an input to a model to calculate the gas to oil ratio (GOR) in real time.
19. The method of claim 1, wherein at least one of the measured reservoir fluid compressibility, density, viscosity, and bubble point pressure is an input to a model to calculate the oil formation volume factor (FVF) in real time, wherein the model is trained at least in part from previous data stored at least in part in a database.
20. The method of claim 1, wherein at least one of the measured reservoir fluid compressibility, density, viscosity, and bubble point pressure is an input to a model to calculate the gas to oil ratio (GOR) in real time, wherein the model is trained at least in part from previous data stored at least in part in a database.
Images & Drawings included:


Sources:
- United States Patent and Trademark Office - verify current appl. status at the USPTO↗
Recent applications in this class:
- » 20260132714 2026-05-14
SUBSURFACE DETECTION SYSTEM AND METHOD - » 20260117652 2026-04-30
DOWNHOLE WATER CHEMISTRY SENSING UTILIZING POLYMER MATRIX CARTRIDGE - » 20260103979 2026-04-16
SYSTEMS AND METHODS FOR DISCOVERING AND RECOVERING SUBSURFACE FLUIDS AND VERIFICATION OF SUBSURFACE STORAGE FLUIDS - » 20260071542 2026-03-12
QUALITY ASSESSMENT OF DOWNHOLE RESERVOIR FLUID SAMPLING BY PREDICTED INTERFACIAL TENSION - » 20260036049 2026-02-05
PRODUCTION OF LOW PERMEABILITY GEOTHERMAL RESOURCES - » 20260009330 2026-01-08
SYSTEMS AND METHODS FOR MEASUREMENT OF FORMATION ELASTIC MODULI WITH A BOREHOLE DUAL PACKER APPARATUS - » 20260009329 2026-01-08
SYSTEM AND METHOD FOR DETERMINING WELL CHARACTERISTICS - » 20260002442 2026-01-01
DEVICE FOR CHARACTERIZING AND TESTING ON-SITE BASIC PARAMETER OF NATURAL GAS HYDRATE - » 20250320815 2025-10-16
APPARATUS AND METHOD FOR POSITIONING A MEASUREMENT DEVICE AT A SUBSURFACE LOCATION TO CONDUCT IN-SITU MONITORING OF HYDROGEN LEVELS - » 20250215796 2025-07-03
System And Method For Down Hole High Concentration Gas Sensing
Recent applications for this Assignee:
- » 20260140275 2026-05-21
NEUTRON ABSORBING DOPANT FOR REDUCING BOREHOLE FLUID BACKGROUND IN GEOCHEMICAL LOGGING - » 20260140045 2026-05-21
SYSTEM AND METHOD TO RETARD H2S REACTION WITH A TARGET SENSING ELEMENT - » 20260139589 2026-05-21
FORMATION PERMEABILITY ANISOTROPY MEASUREMENT BY INJECTING THEN PUMPING OF INJECTION FLUID - » 20260139588 2026-05-21
METHOD TO CONTROL THE FLOW RATES OF FOCUS SAMPLING PROBE TO ENABLE FASTER CAPTURE OF CLEAN FORMATION FLUID - » 20260139586 2026-05-21
LARGE COUNT MICROSAMPLER - » 20260139579 2026-05-21
CLASSIFICATION OF PORE OR GRAIN TYPES IN FORMATION SAMPLES FROM A SUBTERRANEAN FORMATION - » 20260135021 2026-05-14
Pass-Thru Electrical Devices and Methods - » 20260133109 2026-05-14
Measurement Of Water Chemistry By Altering The Resonant Frequency Of A Vibrating Element With Hydrophilic Hydrogels - » 20260132713 2026-05-14
IDENTIFYING ASPHALTENE PRECIPITATION AND AGGREGATION WITH A FORMATION TESTING AND SAMPLING TOOL - » 20260132699 2026-05-14
Gas Tight Ball Seat System