RUTHENIUM-BASED STABLE ANODE CATALYSTS FOR WATER OXIDATION REACTION IN ACIDIC ELECTROLYTES
US20260146348A1
2026-05-28
19/122,684
2023-10-19
Smart Summary: A new type of catalyst is designed for helping water split into oxygen and hydrogen in acidic solutions. It mainly contains ruthenium, oxygen, and a transition metal as a special additive. Iridium can also be included in the catalyst. To create this catalyst, the process involves mixing certain materials, heating them to form tiny particles, and then treating these particles to remove any unwanted parts. The final product is a stable catalyst that can efficiently promote the water oxidation reaction. 🚀 TL;DR
Abstract:
A catalyst may include ruthenium, oxygen, and a dopant, wherein the dopant comprises a transition metal. The catalyst may further include iridium. A method of making the catalyst may include impregnating ruthenium precursors and dopant precursors on a support, reducing the ruthenium precursors and the dopant precursors to obtain alloy nanoparticles supported on the support and including an alloy of ruthenium and the dopant, annealing the alloy nanoparticles and the support to remove the support and to convert the alloy nanoparticles to an intermediate mixed oxide including ruthenium, oxygen and the dopant, and leaching the intermediate mixed oxide to remove unstable dopant and obtain the catalyst.
Inventors:
- Haotian Wang 4 🇺🇸 Houston, TX, United States
- Zhen-Yu Wu 1 🇺🇸 Houston, TX, United States
- Chang Qiu 1 🇺🇸 Houston, TX, United States
Assignee:
- William Marsh Rice University 796 🇺🇸 Houston, TX, United States
Applicant:
Interested in similar patents?
Get notified when new applications in this technology area are published.
Classification:
C25B11/091 » CPC main
Electrodes; Manufacture thereof not otherwise provided for characterised by the material; Electrodes formed of electrocatalysts on a substrate or carrier characterised by the electrocatalyst material consisting of at least one catalytic element and at least one catalytic compound; consisting of two or more catalytic elements or catalytic compounds
C25B11/054 » CPC further
Electrodes; Manufacture thereof not otherwise provided for characterised by the material; Electrodes formed of electrocatalysts on a substrate or carrier Electrodes comprising electrocatalysts supported on a carrier
Description
REFERENCE TO APPENDICES
Appendix A describes one or more embodiments. Appendix A is hereby incorporated by reference into the instant application.
Appendix B describes one or more embodiments. Appendix B is hereby incorporated by reference into the instant application.
BACKGROUND
Development of active, stable and low-cost acidic oxygen evolution reaction (OER) catalysts is highly important for commercialization of polymer-based proton exchange membrane water electrolysis (PEM-WE) technology for clean H2 production. OER catalysts that mainly contain Ru-based oxides have the potential to decrease the price of traditional Ir-based OER catalysts. However, Ru-based oxides that have been studied have not been stable enough in PEM-WE cells. The present invention was funded in part by the Robert A. Welch Foundation under Welch Grant No. C-2051.
SUMMARY
This disclosure describes new catalysts and method of forming catalysts designed to increase efficiency of OER in PEM-WE applications.
The present disclosure presents catalysts and method of forming catalysts. The catalyst includes ruthenium, oxygen, and a dopant, wherein the dopant comprises a transition metal. The catalyst may further include iridium. The method of making the catalyst includes impregnating ruthenium precursors and dopant precursors on a support, reducing the ruthenium precursors and the dopant precursors to obtain alloy nanoparticles supported on the support and including an alloy of ruthenium and the dopant, annealing the alloy nanoparticles and the support to remove the support and to convert the alloy nanoparticles to an intermediate mixed oxide including ruthenium, oxygen and the dopant, and leaching the intermediate mixed oxide to remove unstable dopant and obtain the catalyst.
BRIEF DESCRIPTION OF THE DRAWINGS
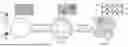
FIG. 1 is a reaction schematic diagram of a method according to one or more embodiments.
FIG. 2 shows a comparison of OER performance between Ru3Ni/C, Ru3NiOx and Ni—RuO2.
FIG. 3 shows a comparison of OER activity based on annealing temperature of the Ni—RuO2 catalyst according to one or more embodiments of the present disclosure.
FIG. 4 is a high-resolution Ni 2p XPS spectrum of Ni—RuO2 according to one or more embodiments of the present disclosure.
FIG. 5 is a high-resolution Ru 3d XPS spectrum of Ni—RuO2 according to one or more embodiments of the present disclosure.
FIG. 6 is a Ni—K edge XANES spectrum of Ni foil, NiO and Ni—RuO2 according to one or more embodiments of the present disclosure.
FIG. 7 is an extended X-ray absorption fine structure (EXAFS) spectrum of Ni—RuO2 at Ni—K edge according to one or more embodiments of the present disclosure.
FIG. 8 is a Ru—K edge XANES spectrum of Ru powder, RuO2 and Ni—RuO2 according to one or more embodiments of the present disclosure.
FIG. 9 is an extended X-ray absorption fine structure (EXAFS) spectrum of Ni—RuO2 at Ru—K edge according to one or more embodiments of the present disclosure.
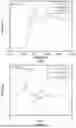
FIG. 10 is a linear sweep voltammetry (LSV) graph comparing OER activity of RuO2, commercial RuO2 (com-RuO2), and Ni—RuO2 according to one or more embodiments of the present disclosure.
FIG. 11 is a graph comparing Tafel slopes of RuO2, com-RuO2, and Ni—Ru02 according to one or more embodiments of the present disclosure.
FIG. 12 is a graph comparing the charge transfer resistances of RuO2, com-RuO2, and Ni—RuO2 at 1.45 V (vs. RHE).
FIG. 13 is a schematic showing the impedance circuit used to measure the charge transfer resistances, shown in FIG. 12.
FIG. 14 shows a graph comparing the electrochemical double-layer capacitance (Cdl) of RuO2, com-RuO2, and Ni—RuO2.
FIG. 15 shows a graph comparing the electrochemically active surface area (ECSA) normalized OER activity of RuO2, com-RuO2, and Ni—RuO2.
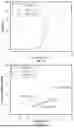
FIG. 16 shows a comparison of water electrolysis activity of RuO2, commercial RuO2, and Ni—RuO2.
FIG. 17 shows a comparison of OER durability of RuO2, commercial RuO2, and Ni—RuO2 at 10 mA/cm2 in an acidic electrolyte on RDE.
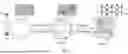
FIG. 18 shows a schematic diagram of a proton exchange membrane (PEM) water electrolyzer (WE).
FIG. 19 shows a constructed PEM-WE device used to evaluate OER activity.
FIG. 20A shows a comparison of the stability of RuO2 and Ni—RuO2 at 200 mA cm−2 at low pressure anode preparation.
FIGS. 20B-20C shows the stability of Ni—RuO2 at 200 mA cm−2 at medium and high pressure anode preparation.
FIG. 21 shows a graph of the Faradaic efficiencies of Ni—RuO2 generated O2 for 1000 hrs.
FIG. 22 shows a graph of Ru dissolution from Ni—RuO2 1000-hr stability test.
FIG. 23 shows X-ray diffraction (XRD) patterns comparing the structure of Ni—RuO2 before and after catalysis.
FIG. 24 compares I-V curves of RuO2 and Ni—RuO2 at elevated temperatures.
FIG. 25 shows a graph of Ni—RuO2 OER activity at elevated temperatures and 200 mA/cm.
FIG. 26 shows a graph of an OER stability test of La doped Ru24IrOx at room temperature and ambient pressure.
FIG. 27A shows a graph of OER stability test of Ru6IrOx at room temperature and ambient pressure for 1000 hours.
FIG. 27B shows a graph of OER stability test of Ru12IrOx at room temperature and ambient pressure for 1000 hours.
FIG. 27C shows a graph of OER stability test of Ru24IrOx at room temperature and ambient pressure for 1000 hours.
FIG. 27D shows a graph of OER stability test of RuO2 at room temperature and ambient pressure for 1000 hours.
FIG. 28 shows a schematic diagram of two possible mechanisms for catalytic activity as described in EXAMPLE 6.
FIG. 29A illustrates Ni incorporation to form a Ni-doped RuO2 surface at a Ru bridge (BRI) site.
FIG. 29B illustrates the two Ru sites of the fully oxidized (110) surface predicted by DFT as described in EXAMPLE 6.
FIG. 30 compares DFT simulated EXAFS spectra of the modeled Ni—RuO2 surface and the measured EXAFS spectra of synthesized Ni—RuO2 at the Ni—K edge.
FIG. 31 shows a comparison of DFT simulated EXAFS spectra of the modeled Ni—RuO2 surface and the measured EXAFS spectra of synthesized Ni—RuO2 at the Ru—K edge.
DETAILED DESCRIPTION
The present disclosure provides a new type of OER catalysts, which is prepared by a newly developed method. The present inventors developed an effective method to stabilize the OER catalysts by doping other transition metals, such as one or more of Ni, Fe, Co, Mn, Cu, Cr, and Zn. The present disclosure describes a new method for the synthesis of a family of novel low-iridium (Ir) or non-iridium oxides, including transition metal doped RuO2, IrO2, and RuxIryOz oxides as stable OER catalysts in the PEM-WE. The developed OER catalysts have very small nanoparticle sizes (3-10 nm) and high crystallinity, which is also beneficial to the stability of the developed OER catalysts.
Compared with pure IrO2 OER catalyst, the cost of the present OER catalysts are lower because of much lower Ir contents in our catalysts. Additionally, the present OER catalysts showed a much better OER stability than pure RuO2 catalysts; the present low-iridium or non-iridium (Ir) oxides OER catalysts can operate stably in PEM-WE cells over 1000 hours.
In one aspect, embodiments disclosed herein relate to a method of making a catalyst active for the oxygen evolution reaction, the method includes: impregnating ruthenium precursors and dopant precursors on a support; reducing the ruthenium precursors and the dopant precursors to obtain alloy nanoparticles supported on the support and comprising an alloy of ruthenium and the dopant; annealing the alloy nanoparticles and the support to remove the support and to convert the alloy nanoparticles to an intermediate mixed oxide comprising ruthenium, oxygen and the dopant; and leaching the intermediate mixed oxide to remove unstable dopant and obtain the catalyst.
In one or more embodiments, the dopant is selected from the group consisting of iron, cobalt, nickel, lanthanum, manganese, copper, chromium, zinc, and combinations thereof. In one or more embodiments, the impregnating includes or may be a wet impregnation. In one or more embodiments, wherein the reducing includes or may be an annealing reduction. In one or more embodiments, reducing the ruthenium precursors and dopant precursors occurs in an atmosphere comprising hydrogen gas and argon. In one or more embodiments, annealing the alloy nanoparticles and the support occurs in an air atmosphere. In one or more embodiments, the annealing the alloy nanoparticles takes place at a temperature in the range of 250 to 600° C. In one or more embodiments, the leaching includes or is acid leaching.
In one or more embodiments, the catalyst includes ruthenium, oxygen, and the dopant. In one or more embodiments, the catalyst includes RuO2 doped with the dopant.
In one or more embodiments, impregnating the ruthenium precursors and the dopant precursors includes impregnating iridium precursors, reducing the ruthenium precursors and the dopant precursors includes reducing the iridium precursors, and the mixed oxide further comprises iridium. In one or more embodiments, the catalyst comprises iridium ruthenium oxide. In one or more embodiments, the iridium ruthenium oxide includes iridium at a concentration in the range of 5-20 wt %.
In one or more embodiments, the support includes or is carbon black.
In another aspect, embodiments disclosed herein relate to a catalyst active for the oxygen evolution reaction, where the catalyst includes ruthenium, oxygen, and a dopant, wherein the dopant comprises a transition metal. In one or more embodiments, the catalyst is more stable than a comparative catalyst comprising ruthenium and oxygen and excluding the dopant. In one or more embodiments, wherein the dopant is selected from the group consisting of iron, nickel, cobalt, lanthanum, copper, manganese, chromium, zinc, and combinations thereof. In one or more embodiments, wherein the catalyst includes a lattice structure comprising ruthenium sites and oxygen sites, the dopant is incorporated into the lattice at a portion of the ruthenium sites.
In one or more embodiments, the catalyst includes RuO2 doped with the dopant. In one or more embodiments, wherein the catalyst is more stable than a comparative catalyst comprising RuO2 and excluding the dopant.
In one or more embodiments, the catalyst further comprises iridium. In one or more embodiments, the catalyst comprises iridium ruthenium oxide doped with the dopant. In one or more embodiments, the catalyst is more stable than a comparative catalyst comprising iridium ruthenium oxide and excluding the dopant.
EXAMPLES
Carbon black was used as the support for catalysts preparation in laboratory conditions as presented in the examples below. For the examples, the weight ratio of metal precursors to carbon was fixed at 1:4. This weight ratio produces OER catalysts with very small and even sizes and high crystallinity. It will be understood that other weight ratios are contemplated. It tended to be difficult to scale up the catalyst synthesis, due to low density of carbon black, to produce OER catalysts in the lab conditions. However, the experiments were successfully carried out. The present inventors contemplate overcoming the limitations by using industrial level equipment, such as very large reaction vessels and tube furnaces.
Example 1
Example 1 illustrates M-RuO2 OER catalysts and their synthesis. As shown in FIG. 1, and according to one or more embodiments, a carbon support may be 1) wet impregnated with ruthenium and nickel precursors to form the Ru3Ni alloy nanoparticles on carbon, then may undergo an annealing reduction under inert gas. After wet impregnation and annealing reduction, the Ru3Ni alloy nanoparticles on carbon is 2) annealed in air to form intermediate Ru3NiOx nanoparticles and to remove the carbon support. The Ru3NiOx nanoparticles subsequently undergo 3) acid-leaching to result in purified Ni—RuO2 as the final catalyst.
In a typical procedure, 0.1721 g of RuCl3 and 0.0656 g of NiCl2·6H2O (i.e. RuCl3 and NiCl2 with a molar ratio of 3:1) were mixed in 150 mL of 1 M HCl and sonicated for 2 h. 0.4 g of carbon black (Cabot, BP2000) was then added and dispersed by stirring for 18 h under room temperature to ensure the uniform distribution. Next, the mixture solution was dried by a rotary evaporator, and the remaining powder was collected. The powder was annealed in a flowing Ar/H2 (5% H2) atmosphere at 900° C. for 2 h and then annealed in air at 250-550° C. (450° C. as the optimized temperature) for 3 hours. After annealing, 50 mg of product was added in 20 mL 1 M HCl and mixed under room temperature for 12 h to perform acid leaching, and then centrifuged and washed with deionized water for 3 times. Finally, the sample was dried at 80° C. in an oven for 12 h to obtain the Ni—RuO2 catalyst. The RuaNibOx-AL samples with different Ni dopant amounts were also prepared following the same procedure, except that the amount of precursor was tuned in the first step. Besides, RuO2 without Ni incorporation was also prepared in a similar method by using RuCl3 as precursor. In addition, the M-RuO2 (M=Fe, Co, Zn, Cu) samples with different metal dopants were also prepared using the same procedure, except that the different precursors were used in the first step, including FeCl3, CoCl2, Zn(NO3)2·6H2O, and CuCl2·2H2O. Of note, the weight ratio of total metal content in precursors to carbon black support was fixed at 1:4 in all of catalyst synthesis. Other metal doped RuO2 can be synthesized by tuning the precursors and their ratios.
While many catalysts were made using the different metal dopants as precursors, they were initially tested for OER activity. Of the tested group, the nickel dopant performed the best. To determine the best ratio for Ni:Ru in the OER catalyst, 4 different ratios were prepared using different Ni dopant amounts and result in catalysts according to the following formula: RuaNibOx-AL. The different ratio formulas are: Ru6NiOx-AL, Ru3NiOx-AL, RuNiOx-AL, RuNi3Ox-AL. Of the different ratios, the Ru3NiOx-AL with the Ru to Ni precursor ratio of 3:1 performed the best in LSV tests.
As shown in FIG. 2, OER activity is improved by incorporating the steps of annealing in air and acid-leaching. While intermediate Ru3NiOx nanoparticles demonstrate improved performance over the ruthenium metal, the final catalyst Ni—RuO2 yields the highest improvement in OER performance. Furthermore, as shown in FIG. 3, a comparison of annealing temperatures ranging from 250-550° C. demonstrates that an annealing temperature of 450° C. yields the greatest improvement in OER activity.
Catalyst Characterization
TEM, HADDF-STEM, and EDS elemental mapping were performed on a Talos F200X transmission electron microscope at an accelerating voltage of 200 kV equipped with an energy dispersive detector. HRTEM and HR-HADDF-STEM images were captured by using a JEM-ARM 200F Atomic Resolution Analytical Microscope operating at an accelerating voltage of 200 kV. XPS data was obtained on an X-ray photoelectron spectrometer (ESCALab MKII) with an excitation source of Mg Kα radiation (1253.6 eV). XRD data were collected on a Rigaku SmartLab X-ray diffractometer. XAS measurements were conducted at the Sector 20-BM beamline of the Advanced Photon Source at Argonne National Laboratory. All XAS measurements were carried out at room temperature under ambient pressure. The samples were measured in fluorescence mode simultaneously with metal foils as references. Data processing and EXAFS fitting were performed using the Athena program.
The Ni—RuO2 catalyst was characterized using X-ray diffraction (XRD), X-ray photoelectron spectroscopy (XPS), high-resolution Ni 2p and Ru 3d XPS, X-ray absorption near-edge spectroscopy (XANES) and extended X-ray absorption fine structure (EXAFS) spectroscopy. As for particle size and structure, TEM, HADDF-STEM and HRTEM were used.
As shown in FIG. 4, the high-resolution Ni 2p XPS spectrum of the Ni—RuO2 results in 4 distinct peaks corresponding to 2 satellites peaks at 861.8 eV and 881.6 eV, and two Ni peaks assigned to Ni 2p3/2 at 856.0 eV and Ni 2p1/2 at 873.9 eV. As for the ruthenium, as shown in FIG. 5, the high-resolution Ru 3d XPS spectrum of the Ru—NiO2 results in two sets of distinct doublets between 280 and 290 eV, assigned to Ru4+ 3d5/2 and Ru4+ 3d3/2 and weaker features in the spectrum assigned to satellites. In comparing the Ni—RuO2 with the RuO2, there is a positive shift of ˜0.1 eV which suggests a higher oxidation state in the Ru—NiO2 catalyst. A higher oxidation state is also suggested by the high-resolution O is XPS spectra which also shows significant similarity between the Ni—RuO2 and RuO2, which clearly shows peaks at 530.1, 531.4 and 532.9 eV for the corresponding Ru—O bonds, OH groups and H2O, respectively. However, in the case of the O is spectra, the Ru—O and OH peaks are negatively shifted by 0.1 and 0.2 eV, respectively. X-ray photoelectron spectroscopy (XPS) was used to determine the Ni atomic ratio. The Ni—RuO2 catalyst obtained from the method described above results in a Ni atomic ratio of 1.4 at % which corresponds to a Ni:Ru ratio of around 1:21.
The prepared Ni—RuO2 results in Ni incorporation uniformly distributed throughout the entire RuO2 matrix, as evidenced by EDS mapping. In using TEM, the prepared RuO2 results in an average nanoparticle size of ˜4 nm. To confirm removal of the support and differentiation from the intermediate mixed oxide Ru3NiOx nanoparticles, TEM was also used on the Ri3Ni/C and Ru3NiOx. The TEM of Ri3Ni/C results in a smaller average nanoparticle sizes of ˜1.7 nm while that of Ru3NiO, results in particle that lack uniformity in size yet exhibit an average particle size of 4.0 nm. As for the Ni—RuO2, the resulting average particle size is 4.0 nm, however, the particles are of uniform size compared to the precursors. HAADF-STEM and HRTEM images of the Ni—RuO2 were captured and confirmed well-defined lattices, uniformity and high crystallinity. However, this is not the case for the Ri3Ni/C and Ru3NiOx. The transformations that take place in the method described above as also distinctly seen in XRD spectra of the Ri3Ni/C and Ru3NiO, when compared to the Ni—RuO2 catalyst. The X-ray diffraction (XRD) pattern of Ni—RuO2 result in characteristic peaks of RuO2 (JCPDS 71-2273) with the dominant (110) peak at 28.1° suggesting the Ni incorporation did not affect the RuO2 lattice structure.
The Ni—RuO2 was compared to NiO and Ni foil using XANES, as shown in FIG. 6. The overlap seen between the NiO and the Ni—RuO2 suggests the presence of a similar Ni oxidation states of that in NiO (Ni2+). The EXAFS spectrum shown in FIG. 7 demonstrates that similar to NiO whose Ni—O coordination is assigned to the peak at 1.6 Å, the catalyst Ni—RuO2 also has a Ni—O coordination. The lack of features ascribed to NiO and Ni foil nanoparticles in the Ni—RuO2 spectrum suggests the absence of both NiO and Ni foil nanoparticles in the catalyst Ni—RuO2.
As shown in FIG. 8, the XANES spectrum of Ni—RuO2 at the Ru—K edge results in an overlap with RuO2, revealing almost identical character yet a modest increase in absorption in the range of approximately 22,140 to 22,150 eV. This feature further supports a higher oxidation state of the Ru in the nickel doped RuO2 than the undoped RuO2. Unlike the EXAFS spectra comparing the Ni—RuO2 with the NiO and Ni foil, the comparison of the Ni—RuO2 with RuO2 and Ru powder, as shown in FIG. 9, results in nearly identical features to the RuO2 suggesting that the coordination structure of the Ru center in Ni—RuO2 is seemingly unchanged from doping with nickel. However, XANES spectra revealed a slightly higher near-edge absorption and a white line peak in the Ni—RuO2 of the Ru—K edge over the RuO2. This characterization is further supported by wavelet transforms (WT), derived from the EXAFS data presented in FIG. 7, of the Ni—K edge of NiO, Ni foil and the Ni—RuO2 catalyst. The Ni—RuO2 Ni—K edge WT shows peaks that closely resemble the peaks of Ni—O rather than the Ni—Ni seen in Ni foil. Similar comparisons were seen in the WT for the Ru—K edges of the Ru powder, RuO2 and Ni—RuO2. In the WT for comparing the Ru, the Ni—RuO2 shows peaks that closely resemble the peaks of Ru—Ru in RuO2 rather than the Ru—Ru in Ru powder.
Example 2
Example 2 illustrates M-Ru—Ir—Ox OER catalysts and their synthesis. The method for synthesizing M-Ru—Ir—Ox OER catalysts is similar to that of Ni—RuO2 catalysts. The as-received IrCl3·xH2O was firstly dissolved into 1 M HCl solution to form 5 mg mL−1 IrCl3·xH2O solution. We used the synthesis of NiRu3IrOx as a typical example to demonstrate the preparation processes of M-Ru—Ir—O, OER catalysts. In a typical procedure, (22.82) mL IrCl3·xH2O solution, (0.2124) g of RuCl3 and (0.082) g of NiCl2·6H2O (i.e. IrCl3, RuCl3 and NiCl2 with a molar ratio of 1:3:1) were mixed in 150 mL of 1 M HCl and sonicated for 2 h. (0.757) g of carbon black (Cabot, BP2000) was then added and dispersed by stirring for 18 h under room temperature to ensure the uniform distribution. Next, the mixture solution was dried by a rotary evaporator, and the remaining powder was collected. The powder was annealed in a flowing Ar/H2 (5% H2) atmosphere at 800° C. for 2 h and then annealed in air at 500° C. for 3 hours to obtain NiRu3IrOx catalysts. The molar ratio of Ni:Ru:Ir in Ni—Ru—Ir—Ox OER catalysts can be tuned by using different amounts of NiCl2·6H2O, IrCl3·xH2O and RuCl3. The method for synthesizing other M-Ru—Ir—Or such as Fe—, Co—, Mn—, La—, Cu—, Zn—, Cr—, Ru—Ir—O, is similar to that of NiRu3IrOx by using different precursors and different ratios of precursors. Besides, IrOx without other metal incorporation was also prepared in a similar method by just using IrCl3·xH2O as precursor. In addition, Ru—Ir—Ox can be synthesized in a similar method by using IrCl3·xH2O and RuCl3 as precursor. The ratio of Ru to Ir can also be tuned by using different amounts of IrCl3·xH2O and RuCl3. Of note, the weight ratio of total metal content in precursors to carbon black support was always fixed at 1:4 in all of catalyst synthesis.
Example 3
Example 3 illustrates Ru—O2-based catalysts and their electrochemical stability as catalysts for oxygen evolution reaction (OER). For the following tests, control samples are an as-prepared RuO2, commercially available RuO2 nanoparticles (com-RuO2) and the Ni—RuO2 catalyst described above. XRD of the as-prepared RuO2 and the com-RuO2 are in good agreement. Furthermore, the spectra reveals a similar morphology between the prepared Ni—RuO2, as shown in FIG. 23, and RuO2.
Electrochemical Measurements
In a typical three-electrode system test, 5 mg of catalyst and 20 μL of Nafion 117 (5% solution, Sigma Aldrich) are added to 1 mL of isopropyl alcohol and sonicated for 1 hour to form a catalyst ink. To prepare the electrode, 16 μL of the catalyst ink is drop-casted onto a 5.0 mm diameter glass carbon electrode (area: 0.196 cm2) to provide a catalyst loading of 0.4 mg/cm2. Prior to use, the drop-cast electrode is vacuum dried at room temperature.
RDE measurements are run at room temperature in a typical three-electrode cell containing an O2-saturated 0.1 M HClO4 electrolyte solution. A carbon rod (99.99%, Beantown Chemical) and a saturated calomel electrode ((SCE), CH Instruments) are used as the counter and reference electrodes, respectively. For the working electrode, an RDE assembly (AFE4TQ050) with prepared glassy carbon electrodes and a rotation rate of 2500 rpm is used. All potentials measured against SCE are converted to the reversible hydrogen electrode (RHE) scale using formula (I):
E ( vs . RHE ) = E ( vs . SCE ) + 0.241 V + 0.0591 × pH ( I )
The pH of the electrolyte solution is 1 and is measured with an Orion Star A111 pH Meter (Thermo Scientific). Potentiometric electrochemical impedance spectroscopy (PEIS) is used to measure solution resistance (Rs) at frequencies from 0.1 Hz to 200 kHz. All the measured potentials in RDE tests are 100% iR-compensated unless otherwise specified. All LSV tests are recorded at a scan rate of 5 mV/s unless otherwise noted. The stability of the catalysts are examined using chronopotentiometry tests at 10 mA/cm2 unless otherwise noted. Electrochemical impedance spectroscopy (EIS) tests are performed at 1.45 V (vs. RHE) from 0.1 Hz to 200 kHz using the impedance circuit shown in FIG. 13, and the results are modeled in the form of a Nyquist plot as shown in FIG. 12. The electrochemically active surface area (ECSA) is determined using the double layer capacitance (Cdl) and the specific capacitance (Cs) of the samples according to Formula (II):
ECSA = Cdl / Cs ( II )
For the catalyst of the present disclosure, a Cs=0.035 mF/cm2 is used. Cdl is determined Formula (III):
Cdl = ic / v , ( III )
-
- where ic is the charging current and v is the scan rate. The catalyst are measured using a series of CV tests in the non-faradaic potential region 1.18-1.28 V (vs. RHE) under scan rates ranging from 2.5 mV/s to 20 mV/s. The CV spectrum are graphed to show the measured ic vs. v, where the Cdl is obtained from the slopes of a linear fit. The roughness factor (RF) is calculated by dividing the ECSA by the geometric area of the electrode mentioned above.
The stability number (S number) of the catalysts are determined according to Formula (IV):
S number = n O 2 n Ru ( dissolved ) , ( IV )
where nO2 is the molar number of total oxygen evolved with a period of time, and nRu(dissolved) is the total dissolved Ru measured by ICP-MS.
The catalysts are evaluated using differential electrochemical mass spectroscopy (DEMS). In a typical procedure, DEMS tests are conducted using 1.0 mg of the catalyst that is mixed with 10 wt % of Nafion in 0.5 mL of ethanol. The mixture is then drop cast onto the 0.5 mm in diameter Glassy Carbon working electrode which is then dried for at least 1 hr prior to use. DEMS measurements are performed using a HPR-40 DEMS (Hidden Analytical) couples with a flow cell, an Autolab potentiostat (PCSTAT204, Metrohm) an OER catalyst modified working electrode, as described above, an Ag/AgCl reference electrode and a Pt wire as a counter electrode. The DEMS measurements are performed without iR-compensation. The electrolyte flow rate is 0.5 mL/min through the flow cell and all measurements are recorded against the reference electrode and then converted to RHE using formula (V):
E ( vs . RHE ) = E ( vs . Ag / AgCl ) + 0.197 + 0.0591 × pH . ( V )
The labeled 18O 0.1 M HClO4 electrolyte solution is prepared using 18O-labeled water (97% 18O, Cambridge Isotope Laboratories) then used to prepare the labeled catalyst for 10 at 10 mA/cm2. The electrodes and flow cell are rinsed with 16O labeled water for 20 minutes to remove any remaining H218O. The flow cell and electrodes are scanned in 0.1 M HClO4 solution of H216O at 0.5 mV s-1 from 1.1 V vs. RHE until the current density reaches 50 mA/cm2. However, for DEMS galvanostatic methods, after rinsing the flow cell and electrodes collect background for 10 minutes prior to applying 10 mA/cm2 for 30 minutes to probe possible oxygen lattice exchange. The ionization used for all species is 70 eV with an emission current of 450 μA. A secondary electron multiplier with a detector voltage of 1200V is used to detect m/z=32 and 34. The data was smoothed by averaging every ten points then the signals were calculated using fitting data.
As shown in the linear sweep voltammetry (LSV) spectra of FIG. 10, both the as-prepared RuO2 nanoparticles and the Ni—RuO2 catalyst outperform the com-RuO2 for OER activity. The improvements shown in the as-prepared RuO2 can be associated with larger average nanoparticle size (˜4.5 nm) compared the com-RuO2, as evidenced by TEM. A similar effect is seen in the differences of the overpotentials. The com-RuO2 results in an overpotential of 330 mV to deliver 10 mA/cm2, whereas the as-prepared RuO2 and the Ni—RuO2 result in much lower overpotentials of 227 mV and 214 mV, respectively. This is further emphasized in the overpotentials to apply higher current densities, as shown in FIG. 11, where the incorporation of Ni to the RuO2 results in an improvement in the Tafel slope (42.6 mV/dec) compared to the as-prepared RuO2 (52.9 mV/dec) and the com-RuO2 (60.7 mV/dec). When electrochemical impedance spectroscopy (EIS) is used, the benefit of using nickel as a dopant in the Ni—RuO2 also results in the lowest charge transfer resistance at 1.45V, as shown in FIG. 12, when compared to the as-prepared RuO2 and com-RuO2.
The double-layer capacitance (Cdl), derived from cyclic voltammetry scans at a rate ranging from 2.5-20 mV/s, of the as-prepared RuO2, com-RuO2, and Ni—Ru were compared and used to calculate electrochemically active surface area (ECSA) and roughness factor. As shown in FIG. 14 and Table 1, the Ni—RuO2 outperforms both the as-prepared RuO2 and com-RuO2 thereby suggesting a higher number of active sites available when doped with nickel. Furthermore, the ECSA normalized activity graph, as shown in FIG. 15 demonstrates that given the higher density of active sites in Ni—RuO2, an intrinsic improvement in OER activity can be expected due to the incorporation of the Ni dopant.
| TABLE 1 | |||
| Catalyst | Cdl (F) | ECSA (cm2ECSA) | Roughness factor (RF) |
| Ni—RuO2 | 0.01708 | 488 | 2489.79592 |
| RuO2 | 0.00897 | 256.2857 | 1307.58017 |
| Com-RuO2 | 0.0012 | 34.28571 | 174.927114 |
The stability of the catalyst during OER activity was determined in an acidic electrolyte at 10 mA/cm2 on RDE. As shown in FIG. 17, the Ni—RuO2 catalyst outperformed the as-prepared RuO2 as well as the com-RuO2, in both tests, and proved to be stable well over 100 hours, even demonstrating negligible potential increase after 200 hours in acidic OER conditions. Additionally, stability tests by way of linear sweep voltammetry results confirm the trend shown in FIG. 17, as the LSV spectra shows clear degradation in the com-RuO2 and as-prepared RuO2 between the 1st, 1000th and 3000th cycles. In-situ XANES spectra for the Ni—K and Ru—K edges were collected at the open-circuit voltage, 1.2, 1.4 and 1.6 V as well at at the OCV at times ranging from 15 to 120 minutes. In all cases, the spectra closely resembles those of the catalyst prior to catalysis. The electrolyte was also tested for the presence of Ru and Ni using ICP-MS. While there is an initial presence of Ru that increases gradually over the first 100 hours, the stability tests results in ˜10 ppb of Ru and 1 ppb of Ni in the electrolyte by the end of the 205 hour test period. At the end of the test period, the stability number of the Ni—RuO2 catalyst is 7.4×10⁵, which comparable to rutile IrO2 (˜106, Alfa Aesar) and other iridium oxides (˜105).
The stability and durability of the Ni—RuO2 catalyst is further emphasized in the XRD spectrum of FIG. 23, which indicates that even post catalysis, the Ni—RuO2 catalyst is still in nearly identical condition as it was prior to OER tests. This stability and durability was also confirmed in studies using XPS and high-resolution XPS at the Ni 2p and Ru 3d which closely resembled the structures shown in FIGS. 4 and 5. The surfaces of the catalysts were analyzed using EDS mapping for all elements and closely mirror the maps formed prior to 205 hours of catalysis. As for particle size and structure, TEM, HADDF-STEM and HRTEM images confirm that the catalyst maintains its high crystallinity and distinct lattices after 205 hours of catalysis. Overall, the performance of the Ni—RuO2 catalyst on RDE demonstrates excellent stability and repeatability across batches, even when compared to other performance benchmarks for non-Ir based acidic OER catalysts, as shown in Table 2.
| TABLE 2 | ||||||
| Catalyst | Substrate | Electrolyte | η (mV) | Stability (h) | Dη (mV) | Ref. |
| Ru—N—C | GCE | 0.5M H2SO4 | 267 | 30 (@ | / | 1 |
| 1.49 VRHE) | ||||||
| IrOx/SrIrO3 | SrTiO3 | 0.5M H2SO4 | 270-290 | 30 | / | 2 |
| La3IrO7-SLD | GCE | 0.1M HClO4 | 296 | 16.7 | ca. 100 | 3 |
| Cu—RuO2 | GCE | 0.5M H2SO4 | 188 | 8 | 83 | 4 |
| Amorphous Ir NSs | GCE | 0.1M HClO4 | 255 | 8 | / | 5 |
| 6H—SrIrO3 | GCE | 0.5M H2SO4 | 248 | 30 | / | 6 |
| Cr0.6Ru0.4O2 | GCE | 0.5M H2SO4 | 178 | 10 | ca. 70 | 7 |
| Ru1—Pt3Cu | GCE | 0.1M HClO4 | 220 | 28 | 30.5 | 8 |
| RuNi2@G-250 | GCE | 0.5M H2SO4 | 227 | 3 | ca. 125 | 9 |
| CaCu3Ru4O12 | GCE | 0.5M H2SO4 | 171 | 24 | 21 | 10 |
| IrCoNi PHNCs | GCE | 0.1M HClO4 | 303 | 3.33 (@5 | 20 | 11 |
| mA cm − 2) | ||||||
| Mo—Co9S8@C | Carbon | 0.5M H2SO4 | 370 | 24 h (@ | / | 12 |
| paper/clot h | 1.6 VRHE) | |||||
| Mn—RuO2 | GCE | 0.5M H2SO4 | 158 | 10 | >150 | 13 |
| SrCo0.9Ir0.1O3-δ | GCE | 0.1M HClO4 | ca. 295 | 3 | ca. 37.5 | 14 |
| Co—RuIr | GCE | 0.1M HClO4 | 235 | 25 | >125 | 15 |
| RuO2 NSs | GCE | 0.5M H2SO4 | 199 | 6 | 32 | 16 |
| E-Ru/Fe ONAs | GCE | 0.5M H2SO4 | 238 | 9 (@5 mA | >50 | 17 |
| cm − 2) | ||||||
| Pd@Ir3L | GCE | 0.1M HClO4 | 245 | / | / | 18 |
| NiFeP | Free- | 0.05M H2SO4 | 540 | 30 | / | 19 |
| standing | ||||||
| W0.2Er0.1Ru0.7O2-δ | GCE | 0.5M H2SO4 | ca. 170 | 100 | 39 | 20 |
| Ba[Co-POM] | CP | 1.0M H2SO4 | 361 | / | / | 21 |
| IrNiCu DNF | GCE | 0.1M HClO4 | 303 | / | / | 22 |
| Y2Ru2O7-δ | GCE | 0.1M HClO4 | 270 (@2.23 | 8 (@1 | / | 23 |
| mA cm − 2) | mA/cm2) | |||||
| TiO2—RuO2 | Ti foil | 0.1M H2SO4 | 609 | 6 (@1 | / | 24 |
| mA/cm2) | ||||||
| MnOx—TiO2—RuO2 | Ti foil | 0.1M H2SO4 | 386 | 6 (@1 | / | 24 |
| (Mn44) | mA/cm2) | |||||
| Ni—RuO2 | GCE | 0.1M HClO4 | 214 | 205 | 20 | — |
| The η was overpotential at current density of 10 mA/cm2 unless otherwise specified. | ||||||
| Δη was the increased overpotential after stability test. |
REFERENCES
- (1) Cao, L. et al. Dynamic oxygen adsorption on single-atomic Ruthenium catalyst with high performance for acidic oxygen evolution reaction. Nat. Commun. 10, 4849 (2019).
- (2) Seitz, L. C. et al. A highly active and stable IrOx/SrIrO3 catalyst for the oxygen evolution reaction. Science 353, 1011-1014 (2016).
- (3) Qin, Q. et al. Gettering La Effect from La3IrO7 as a Highly Efficient Electrocatalyst for Oxygen Evolution Reaction in Acid Media. Adv. Energy Mater. 11, 2003561 (2021).
- (4) Su, J. et al. Assembling Ultrasmall Copper-Doped Ruthenium Oxide Nanocrystals into Hollow Porous Polyhedra: Highly Robust Electrocatalysts for Oxygen Evolution in Acidic Media. Adv. Mater. 30, 1801351 (2018).
- (5) Wu, G. et al. A general synthesis approach for amorphous noble metal nanosheets. Nat. Commun. 10, 4855 (2019).
- (6) Yang, L. et al. Efficient oxygen evolution electrocatalysis in acid by a perovskite with face-sharing IrO6 octahedral dimers. Nat. Commun. 9, 5236 (2018).
- (7) Lin, Y. et al. Chromium-ruthenium oxide solid solution electrocatalyst for highly efficient oxygen evolution reaction in acidic media. Nat. Commun. 10, 162 (2019).
- (8) Yao, Y. et al. Engineering the electronic structure of single atom Ru sites via compressive strain boosts acidic water oxidation electrocatalysis. Nat. Catal. 2, 304-313 (2019).
- (9) Cui, X. et al. Robust Interface Ru Centers for High-Performance Acidic Oxygen Evolution. Adv. Mater. 32, 1908126 (2020).
- (10) Miao, X. et al. Quadruple perovskite ruthenate as a highly efficient catalyst for acidic water oxidation. Nat. Commun. 10, 3809 (2019).
- (11) Feng, J. et al. Iridium-Based Multimetallic Porous Hollow Nanocrystals for Efficient Overall-Water-Splitting Catalysis. Adv. Mater. 29, 1703798 (2017).
- (12) Wang, L. et al. Atomically Dispersed Mo Supported on Metallic Co9S8 Nanoflakes as an Advanced Noble-Metal-Free Bifunctional Water Splitting Catalyst Working in Universal pH Conditions. Adv. Energy Mater. 10, 1903137 (2020).
- (13) Chen, S. et al. Mn-Doped RuO2 Nanocrystals as Highly Active Electrocatalysts for Enhanced Oxygen Evolution in Acidic Media. ACS Catal., 1152-1160 (2019).
- (14) Chen, Y. et al. Exceptionally active iridium evolved from a pseudo-cubic perovskite for oxygen evolution in acid. Nat. Commun. 10, 572 (2019).
- (15) Shan, J., Ling, T., Davey, K., Zheng, Y. & Qiao, S.-Z. Transition-Metal-Doped RuIr Bifunctional Nanocrystals for Overall Water Splitting in Acidic Environments. Adv., Mater. 31, 1900510 (2019).
- (16) Zhao, Z. L. et al. Boosting the oxygen evolution reaction using defect-rich ultra-thin ruthenium oxide nanosheets in acidic media. Energy Environ. Sci. 13, 5143-5151 (2020).
- (17) Yao, Q. et al. A chemical etching strategy to improve and stabilize RuO2-based nanoassemblies for acidic oxygen evolution. Nano Energy 84, 105909 (2021).
- (18) Zhu, J. et al. Facile Synthesis and Characterization of Pd@ImL (n=1-4) Core-Shell Nanocubes for Highly Efficient Oxygen Evolution in Acidic Media. Chem. Mater. 31, 5867-5875 (2019).
- (19) Hu, F. et at. Amorphous Metallic NiFeP: A Conductive Bulk Material Achieving High Activity for Oxygen Evolution Reaction in Both Alkaline and Acidic Media. Adv. Mater. 29, 1606570 (2017).
- (20) Hao, S. et al. Dopants fixation of Ruthenium for boosting acidic oxygen evolution stability and activity. Nat. Commun. 11, 5368 (2020).
- (21) Blasco-Ahicart, M., Soriano-Lopez, J., Carbo, J. J., Poblet, J. M. & Galan-Mascaros, J. R. Polyoxometalate electrocatalysts based on earth-abundant metals for efficient water oxidation in acidic media. Nat. Chem. 10, 24-30 (2018).
- (22) Park, J. et al. Iridium-Based Multimetallic Nanoframe@Nanoframe Structure: An Efficient and Robust Electrocatalyst toward Oxygen Evolution Reaction. ACS Nano 11, 5500-5509 (2017).
- (23) Kim, J. et al. High-Performance Pyrochlore-Type Yttrium Ruthenate Electrocatalyst for Oxygen Evolution Reaction in Acidic Media. J. Am. Chem. Soc. 139, 12076-12083 (2017).
- (24) Etzi Coller Pascuzzi, M., Goryachev, A., Hofmann, J. P. & Hensen, E. J. M. Mn promotion of rutile TiO2—RuO2 anodes for water oxidation in acidic media. Appl. Catal. B Environ. 261, 118225 (2020).
Example 4
Example 4 demonstrates the performance of the Ni—RuO2 catalyst in a constructed PEM-WE device. FIG. 18 illustrates a schematic diagram of the PEM-WE device. FIG. 19 shows a constructed PEM-WE electrolyzer using the above-described Ni—RuO2 catalyst as the anode for OER, commercial Pt/C as the cathode for hydrogen evolution reaction (HER), and a Nafion 117 cation/proton exchange membrane electrolyte.
For the HER cathode, approximately 0.65 mg/cm2 of commercial Pt/C with 20 wt % Nafion 117 binder is air-brushed onto a carbon paper electrode. For low pressure anode preparation, ˜3.1 mg/cm2 OER catalyst with 20 wt % PTFE binder is drop-cast onto a platinized titanium fiber felt electrode. After drying, the electrode is pressed at room temperature at a pressure of <0.5 MPa using a hot-press machine, then annealed in the air for 0.5 hour at 350° C. before use as OER anode. The anode is circulated in 0.1 M HClO4 aqueous electrolyte at a flow rate of 4 mL/min. The I-V curves are measured using galvanostatic mode from 50 to 2200 mA/cm2 at room temperature and ambient pressure. The stability test for the catalyst are carried out at 200 mA/cm2 and at room temperature and ambient pressure.
For medium and high pressure anode preparation, the same procedure of drop casting is used as described in the low pressure anode preparation, however, freshly annealed (at 450° C.) catalyst is used with ca. 1.5 MPa for the medium pressure anode preparation and ca. 3.0 MPa for the high pressure anode preparation. For both medium and high pressure anode preparation, a hydraulic press machine is used at room temperature and the circulation flow is reduced to 0.5 mL/min to reduce electrolyte flushing of the anode coating.
All cell voltages measured in PEM-WE device were without iR-compensation. It is noted here that the slight voltage difference between I-V curves and chronopotentiometry stability tests could come from the different activization methods for electrolyzers, voltage test methods and electrolyzers' resistances.
PEM-WE Performance
As shown in FIG. 16 (without iR-compensation), the I-V curve of the Ni—RuO2 catalyst results in improved water electrolysis activity compared to the as-prepared RuO2 and com-RuO2 catalyst, requiring the lowest voltage to reach current densities in the range of 500-2000 mA/cm2. To investigate the Ni—RuO2 catalysts performance beyond typical applications, it was tested at 200 mA/cm2 and compared to the as-prepared RuO2 catalysts described above. As shown in FIG. 20A, at low pressure anode preparation, the Ni—RuO2 catalyst results in a small voltage increase that begins at around hour 700 of 1000 hours, yet still significantly outperforms the as-prepared RuO2 catalyst. The degradation from 700 hours was accompanied by a coating of black material on the outlet tubing, believed to be detachment of Ni—RuO2 catalyst from the anode. However, when medium (ca. 1.5 MPa) and high pressure anode preparations were used, the Ni—RuO2 catalyst resulted in no obvious voltage increases during the 1000 hr stability tests, as shown in FIGS. 20B and 20C, respectively. Furthermore, far less black material was seen on the outlet tubing for the medium and high pressure stability tests. When RuO2 catalyst was tested at medium pressure, it proved to still be far less stable than the Ni—RuO2 catalyst.
The O2 faraday efficiency of the Ni—RuO2 catalyst was measured during the PEM-WE stability tests. As shown in FIG. 21, the Ni—RuO2 catalyst results in Faradaic efficiencies of ˜100%. During the stability test, Ru dissolution of the Ni—RuO2 catalysts was also monitored and results in a rapid increase in the Ru concentration, followed by a more gradual increase that plateaus after ˜500 hours, as shown in FIG. 22.
For insight on oxygen generation, 18O labeled catalysts were tracked in OER stability tests performed at 10 mA/cm. During the stability tests, a gradual increase in OER in acidic electrolyte labeled with H216O results in a corresponding and constant increase in both 32O (16O+16O) and 34O (16O+18O) for both the 18O labeled catalysts Ni—RuO2 and RuO2. The constant ratio between the 32O and 34O is comparable to the natural abundance of 18O suggesting that the OER does not take place using lattice O in either of the catalysts.
To demonstrate the Ni—RuO2 catalyst performance at elevated temperatures, electrochemical stability tests were also performed at 80° C. As shown in FIG. 24 (not iR-compensated), the Ni—RuO2 catalyst requires less voltage to reach current densities in the range of 500 to 2000 mA/cm2 when compared to the as-prepared RuO2 catalyst at the same temperature. Furthermore, FIG. 25 shows that the Ni—RuO2 catalyst's (high pressure anode preparation of ca. 3.0 MPa) OER activity is maintained at elevated temperatures for over 1000 hours.
Example 5
Example 5 demonstrates the stability of low iridium loading ruthenium-iridium oxide catalysts, RunIrOx (n=24, 12, 6). The catalysts were synthesized using the above-described method according to the amounts shown in Table 3.
| TABLE 3 | |||
| Catalyst | Ir wt % | Ir loading (mg cm−2) | |
| Ru6IrOx | 19% | 0.38 | |
| Ru12IrOx | 11% | 0.21 | |
| Ru24IrOx | 6% | 0.11 | |
The durability of the low iridium loading RunIrOx (n=24, 12, 6) catalysts were then tested as anode catalysts in the above-described PEM-WE at 2 A/cm2. As shown in FIGS. 27A-27D, when compared to the pure RuO2 catalyst, which decayed rapidly at 2 A/cm2 (FIG. 27D), the use of low iridium loading RunIrOx (n=24, 12, 6) catalysts results in gradual improvements in stability. Improvement is seen in the lowest dose of Ir, 6 wt % Ir—Ru24IrOx (FIG. 27C), which results in stability increases past 200 hours in both independent tests. When the iridium content is increased to 11 wt/o and 19 wt % (FIGS. 27B and 27A, respectively), the catalyst is stable for well over 1000 hours without degradation in all independent tests.
The lowest iridium dosed catalyst (Ru24IrOx) was doped with lanthanum and tested for stability as an OER anode catalyst at 2 A/cm2 at room temperature and ambient pressure. As shown in FIG. 26, the La doped Ru24IrOx was stable for 500 hours as an OER catalyst for water electrolysis.
Example 6
Example 6 describes density functional theory (“DFT”) modeling of the mechanisms of which the above-described Ni—RuO2 catalyst uses to generate oxygen.
Computational Details
The first principles DFT calculations with a plane-wave basis set are performed using the Vienna ab initio simulation package (VASP) software. The Perdew, Burke and Ernzernhof (PBE) functionals of generalized gradient approximation (GGA) is used to describe the term of electronic exchange and correlation energy. The energy cutoff of plane wave basis set is set as 500 eV for planewave expansion. Projector augmented wave (PAW) pseudopotential was used to describe the core electrons. The electronic energy is converged until the energy difference between iterations was lower than 10−5 eV. During structure optimization calculations, the atomic positions are relaxed until the force on each ion falls below 0.01 eV Å−1. The lattice parameter of rutile RuO2 was determined to be a=4.53 Å and c=3.12 Å, agreeing with the previous computational prediction of a=4.54 Å and c=3.14 Å. A 2×2×1 RuO2 (110) model with 16 Ru atoms and 32 O atoms is used in the calculations. The slab model consists of two atomic layers of O and two atomic layers of Ru. The top two layers (1 layer O and 1 layer Ru) are optimized during structure optimization calculations. A vacuum layer of 15 Å thickness is added perpendicularly to the surface to minimize interactions between periodic images. To model Ni doped RuO2 surface, one Ru atom at bridge (BRI) site in 2×2×1 RuO2 (110) model is substituted by a Ni atom, leading to the chemical composition of 2.1 at % Ni, 31.3 at % Ru, and 66.6 at % O. The Brillouin Zone is sampled using Monkhorst scheme with 6×3×1 k-point mesh for RuO2 (110) and Ni—RuO2 (110). Due to the strong-correlation of d electrons in Ni, a value of U-J of 5.3 eV was adopted. Zero-point energy (ZPE) corrections were included in all the adsorbate system calculations. ZPE corrections were calculated according to Formula (VI):
ZPE = ∑ i 1 2 hv i , ( VI )
where h is Planck's constant and vi is the frequency of the ith vibrational mode of binding molecules.
According to the Arrhenius equation, activation energy plays an important role in determining reaction rates. In 2010, Norskov et. al25 observed that the calculated free energy change for the protonation/deprotonation reactions showed a good linear relationship with the activation energy barrier for the same reaction (i.e., following the Brønsted-Evans-Polanyi (BEP) relation). Following their conclusion, the predicted free energy change could be used to estimate the activation energy, and hence derive the reaction rate as well as the rate determining step. The relation between activation energy and free energy change of protonation/deprotonation reaction is shown in Formula (VII):
E a = 0.26 + 0.5 × Δ G , ( VII )
Where Ea and ΔG are the activation energy and free energy change of the protonation/deprotonation reaction, respectively. Consequently, a high (or low) free energy change indicates a high (or low) activation energy for the protonation reactions involved in OER.
Given the increases in stability as a result of the fully annealed RuO2 catalyst at 450° C. mentioned above, the fully oxidized RuO2 crystal was modeled. In the outer layer of the RuO2 (110) surface, there are two Ru sites where the oxygen can bind to undergo OER. As shown in FIG. 29B, a coordinatively unsaturated (CUS) Ru site that has five coordinated O atoms (4 in plane with Ru, 1 below Ru plane) and a fully coordinated bridge (BRI) Ru site that has six coordinated O atoms (4 in plane with Ru, 1 above Ru plane, 1 below Ru plane). Optimized atomic structures including nickel at either site indicates an energetically favorable pathway for Ni in the place of a Ru BRU site (as shown in FIG. 29A), with an energy of 0.00 eV, whereas Ni in the place of a Ru CUS site results in an energy of 1.45 eV.
Given the energetically favorable Ni placement at the BRU site, EXAFS was predicted based on the proposed atomic structure. As shown in FIGS. 30 and 31, there is agreement between the predicted and experimental EXAFS for both the Ni—K and Ru—K edge.
Modeling was also used to schematically depict the two possible mechanisms for oxygen generation using the Ni-doped Ru—O2. As shown in FIG. 28, step 1) includes the addition of water to the central Ru center, shown as II. The addition is followed by two deprotonation steps (step 2) and step 3) to generate an *OH bound to the Ru center II, followed by *O the Ru center II. After the generation of *O the Ru center II, the modeling reveals two pathways. The top pathway (AEM) involves a reaction between the surface absorbed *O with another H2O in the electrolyte to form a *OOH (step 4), followed by a deprotonation to reveal the absorbed O2 (step 5). In the bottom lattice oxygen mechanism (LOM) pathway, the surface absorbed *O reacts with lattice O (not shown) to produce O2 and a O vacancy (step 4). The generated O vacancy is refilled by another H2O in the electrolyte (step 5), followed by a deprotonation to reform the starting central Ru center II of the surface (step 6).
Given the two possible mechanism, free energies for both mechanisms were predicted. The free energy calculations of the OER via AEM mechanism results in a lowest free energy potential of 1.89 V. For the OER via LOM mechanism, the lowest free energy potential results in an energy potential of 3.76 V. Thus, OER is thermodynamically favored to undergo the AEM mechanism. Additionally, we predicted the free energy change for each elementary step involved in OER. Specifically, we predicted the free energy change to be 0.59 eV for the H2O to *OH step, 0.90 eV for the *OH to *O step, 1.89 eV for the *O to *OOH step, and 1.54 eV for the *OOH to O2 step. In following the well-established BEP relation, it was identified that the rate-determining step (RDS) was the *O to *OOH (step 4)) of the OER mechanism shown in FIG. 28.
Limiting potential and lattice stability calculations were performed to evaluate the impacts of the Ni incorporation on the catalyst activity and stability. The enthalpy change for Ru demetallation was evaluated for both Ni—RuO2 and RuO2. Removal of Ru from the CUS site for the incorporation of Ni increases the energy from 1.87 eV for RuO2 to 2.22 eV for Ni—RuO2. Furthermore, DFT calculations were performed using RuO4 as the final dissolution product and O2 and water as oxidants. In this case, the Ru demetallation enthalpy changes were calculated to be 1.73 eV for RuO2 and 2.08 eV for Ni—RuO2. For the subsurface oxygen loss, the enthalpy changes were calculated to be 1.67 and 2.12 eV. The calculations performed demonstrate that the stability and OER activity of RuO2 is improved with the doping of Ni through Ru demetallation and lattice oxygen loss. These findings agreed well with the experimental data for the Ni—RuO2 catalyst described above.
Embodiments of the present disclosure may provide at least one of the following advantages.
The invention is used for the preparation of active, stable and low-cost acidic oxygen evolution reaction as anodic catalysts in PEM-WE cells. In this invention, we solve the problems of high cost of Ir-based OER catalysts and low stability of Ru-based OER catalysts. We used Ru elements as the main composition for OER catalysts and stabilized the unstable Ru-based catalysts by other metal dopants. The developed methods can be used for preparing other oxides catalysts, and the developed catalysts can also be used for other catalysis processes, such as chlorine evolution reaction, and hydrogen evolution reaction, and the like.
It will be understood herein that includes has the meaning of includes but is not limited to.
Although only a few example embodiments have been described in detail above, those skilled in the art will readily appreciate that many modifications are possible in the example embodiments without materially departing from this invention. Accordingly, all such modifications are intended to be included within the scope of this disclosure as defined in the following claims.
Claims
1. A catalyst, the catalyst comprising:
ruthenium, oxygen, and a dopant, wherein the dopant comprises a transition metal.
2. The catalyst of claim 1, wherein the catalyst is more stable than a comparative catalyst comprising ruthenium and oxygen and excluding the dopant.
3. The catalyst of claim 1, wherein the dopant is selected from the group consisting of nickel, iron, cobalt, lanthanum, manganese, copper, zinc, chromium, and combinations thereof.
4. The catalyst of claim 1, wherein the catalyst comprises a lattice structure comprising ruthenium sites and oxygen sites, the dopant is incorporated into the lattice at a portion of the ruthenium sites.
5. The catalyst of claim 1, wherein the catalyst comprises RuO2 doped with the dopant.
6. The catalyst of claim 5, wherein the catalyst is more stable than a comparative catalyst comprising RuO2 and excluding the dopant.
7. The catalyst of claim 1, further comprising iridium.
8. The catalyst of claim 7, wherein the catalyst comprises iridium ruthenium oxide doped with the dopant.
9. The catalyst of claim 8, wherein the catalyst is more stable than a comparative catalyst comprising iridium ruthenium oxide and excluding the dopant.
10. A method of making a catalyst, the method comprising:
impregnating ruthenium precursors and dopant precursors on a support;
reducing the ruthenium precursors and the dopant precursors to obtain alloy nanoparticles supported on the support and comprising an alloy of ruthenium and the dopant;
annealing the alloy nanoparticles and the support to remove the support and to convert the alloy nanoparticles to an intermediate mixed oxide comprising ruthenium, oxygen and the dopant; and
leaching the intermediate mixed oxide to remove unstable dopant and obtain the catalyst.
11. The method of claim 10, wherein the dopant is selected from the group consisting of nickel, iron, cobalt, lanthanum, manganese, copper, zinc, chromium, and combinations thereof.
12. The method of claim 10, wherein the impregnating comprises a wet impregnation.
13. The method of claim 10, wherein the reducing comprises an annealing reduction.
14. The method of claim 10, wherein reducing the ruthenium precursors and dopant precursors occurs in an atmosphere comprising hydrogen gas and argon.
15. The method of claim 10, wherein annealing the alloy nanoparticles and the support occurs in an air atmosphere.
16. The method of claim 10, wherein the leaching comprises acid leaching.
17. The method of claim 10, wherein the catalyst comprises ruthenium, oxygen, and the dopant.
18. The method of claim 10, wherein the catalyst comprises RuO2 doped with the dopant.
19. The method of claim 10, wherein impregnating the ruthenium precursors and the dopant precursors further comprises impregnating iridium precursors, wherein reducing the ruthenium precursors and the dopant precursors further comprises reducing the iridium precursors, and wherein the mixed oxide further comprises iridium.
20. The method of claim 19, wherein the catalyst comprises iridium ruthenium oxide.
Images & Drawings included:


Sources:
- United States Patent and Trademark Office - verify current appl. status at the USPTO↗
Recent applications in this class:
- » 20260146347 2026-05-28
CATALYTIC ELECTRODE AND METHOD OF FORMING THE SAME AND ELECTROLYSIS DEVICE - » 20260146346 2026-05-28
RED MUD-BASED CATALYSTS FOR WATER SPLITTING - » 20260132526 2026-05-14
CATALYST FOR OXYGEN EVOLUTION REACTION HAVING A NET STRUCTURE AND A METHOD OF PREPARING THE SAME - » 20260098352 2026-04-09
METALLIC NICKEL/NICKEL-IRON HYDROXIDE CATALYTIC LAYER-MODIFIED COPPER IODIDE-BISMUTH COMPOSITE ELECTRODE AND METHOD OF PREPARING THE SAME AND METHOD OF PREPARING ADIPONITRILE USING METALLIC NICKEL/NICKEL-IRON HYDROXIDE CATALYTIC LAYER-MODIFIED COPPER IODIDE-BISMUTH COMPOSITE ELECTRODE - » 20260085436 2026-03-26
WATER ELECTROLYSIS ELECTRODE, WATER ELECTROLYSIS CELL, WATER ELECTROLYSIS DEVICE, AND METHOD FOR MANUFACTURING WATER ELECTROLYSIS ELECTRODE - » 20260078507 2026-03-19
COPPER CATALYSTS FOR THE ELECTROCHEMICAL CONVERSION OF CARBON DIOXIDE OR CARBON MONOXIDE TO C2+ PRODUCTS - » 20260022479 2026-01-22
ELECTROCHEMICAL NITRATE CONVERSION AMMONIA PRODUCTION CATALYST USING CUPROUS OXIDE SURFACE SUBSTITUTION DOPING AND METHOD FOR MANUFACTURING SAME - » 20260009149 2026-01-08
TRANSITION METAL-DOPED NICKEL OXYHYDROXIDE CATALYST, PREPARATION METHOD THEREOF, AND USE THEREOF - » 20250382715 2025-12-18
ELECTRODE FOR OZONE GENERATION - » 20250376776 2025-12-11
CORE-SHELL STRUCTURE FOR WATER ELECTROLYSIS, PREPARING METHOD OF THE SAME, AND THE ELECTRODE INCLUDING THE SAME
Recent applications for this Assignee:
- » 20260137948 2026-05-21
MAGNETOELECTRIC DATA AND POWER TO MINIATURE BIODEVICES WITH TUNABLE AMPLITUDE AND WAVEFORM - » 20260115487 2026-04-30
IMPLANTABLE BIOELECTRONIC DEVICES BASED ON MAGNETOELECTRIC MATERIAL - » 20260104387 2026-04-16
DEVICE AND METHOD FOR NATIVE SINGLE-CELL WESTERN BLOT - » 20260104065 2026-04-16
SHEET-BASED FLUIDIC DIODES FOR EMBEDDED FLUIDIC CIRCUITRY IN SOFT DEVICES - » 20260092388 2026-04-02
METHODS FOR PREVENTION OR REMOVAL OF PRECIPITATED SALTS TO IMPROVE ELECTROCHEMICAL CO2 REDUCTION REACTIONS - » 20260077205 2026-03-19
MINIATURIZED MAGNETOELECTRIC-BASED WIRELESS BIOIMPLANT - » 20260057502 2026-02-26
STRAIN MAPPING BY HYPERSPECTRAL IMAGING - » 20260038790 2026-02-05
MONOLITHIC THREE-DIMENSIONAL ION TRAP - » 20260022333 2026-01-22
IMPARTING UNIQUE CELL-SCAFFOLD INTERACTIONS TO CREATE SELF-ORGANIZING TISSUES - » 20260021484 2026-01-22
FINGER-ACTUATED SYSTEMS AND METHODS FOR ELECTROCHEMICAL MEASUREMENTS OF PROTEIN BIOMARKERS FOR POINT-OF-CARE TESTING