Corrected parameter control method for a two-shaft gas turbine
US20060242963A1
2006-11-02
10/539,271
2003-12-10
✅ Patent granted
US 7,634,914 B2
2009-12-22
WO; PCT/EP03/14174; 20031210
WO; WO2004/055340; 20040701
Michael Cuff | Phutthiwat Wongwian
2025-05-01
Abstract:
A corrected parameter control method for a two-shaft gas turbine, of the type in which the protection of the said turbine is provided by a first control loop which controls the opening of fuel valves to keep the gas temperature Tfire at the inlet to a first wheel of the said turbine and the fuel/air ratio F/A within specified limits: this control is provided in such a way that the exhaust temperature TX has values calculated by a linear approximation, in other words as the sum of a reference temperature TXbase to which are added corrections relating to a single environmental or operating parameter which differs from the reference parameter; a second control loop, which controls the opening of a valve (bleed valve) located between the outlet of the axial compressor and the atmosphere, controls the F/A ratio: this control is provided in such a way that the exhaust temperature has values calculated by a linear approximation.
Inventors:
- Andrea Casoni 4 🇮🇹 Florence, Italy
- Stefano Groppi 2 🇮🇹 Monsummano Terme, Italy
- Andrea Casoni 1 🇮🇹 Firenze, Italy
- Stefano Groppi 1 🇮🇹 Monsummano, Italy
- Alessandro Russo 1 🇮🇹 Pisa, Italy
Assignee:
- NUOVO PIGNONE HOLDING S.P.A. 31 🇮🇹 Florence, Italy
Interested in similar patents?
Get notified when new applications in this technology area are published.
Classification:
F01D21/12 » CPC main
Shutting-down of machines or engines, e.g. in emergency; Regulating, controlling, or safety means not otherwise provided for responsive to temperature
F01D17/085 » CPC further
Regulating or controlling by varying flow; Arrangement of sensing elements responsive to condition of working-fluid, e.g. pressure to temperature
F01D17/105 » CPC further
Regulating or controlling by varying flow; Final actuators by passing part of the fluid
F02C9/28 » CPC further
Controlling gas-turbine plants; Controlling fuel supply in air- breathing jet-propulsion plants; Control of fuel supply Regulating systems responsive to plant or ambient parameters, e.g. temperature, pressure, rotor speed
F05D2270/08 » CPC further
Control; Purpose of the control system to produce clean exhaust gases
F05D2270/112 » CPC further
Control; Purpose of the control system to prolong engine life by limiting temperatures
F05D2270/303 » CPC further
Control; Control parameters, e.g. input parameters Temperature
F02C9/00 IPC
Controlling gas-turbine plants; Controlling fuel supply in air- breathing jet-propulsion plants
Description
The present invention relates to a corrected parameter control method for a two-shaft gas turbine.
As is known, a two-shaft gas turbine is a machine consisting of a compressor, one or more combustion chambers, and two turbine wheels with one or more stages; one turbine wheel is connected by a shaft to the compressor, while the other wheel is connected to the load by the second shaft.
Air taken from the external environment is fed to the compressor to be pressurized. The compressor can be provided with suitable vent valves, also known as bleed valves, which discharge some of the compressed air to the atmosphere.
The pressurized air passes over the outside of the combustion chamber jackets, thus cooling them, and then reaches a set of burners which have the function of mixing the air and the fuel gas (obtained from external pipes), thus providing a gas-air mixture for burning. The pre-mixing of the air with the gas enables the local temperature to be contained in the following primary combustion region, thus limiting the formation of pollutants such as nitrogen oxides.
The combustion reaction takes place inside the jackets, where the temperature and consequently the enthalpy of the gases are increased.
The gas at high temperature and high pressure then passes through suitable pipes to the different stages of the turbine, which converts the enthalpy of the gas to mechanical energy available to a user.
It is known that, in order to obtain the maximum efficiency of any given gas turbine, the temperature of the gas at the inlet to the first turbine wheel, referred to below as the temperature TFire, must be as high as possible; however, the maximum temperatures that can be reached during the use of the turbine are limited by the strength of the materials used.
It is also known that, in order to obtain low emission of pollutants, the fuel-air ratio (abbreviated to F/A in the following text) must be suitably controlled; however, the acceptable values of F/A are limited by problems of loss of ignition in the gas turbine or the generation of pressure pulsations in the combustion chamber.
In practice, there is a requirement to design a thermodynamic cycle for the two-shaft gas turbine which will yield high efficiency combined with low emission of pollutants.
However, the nominal thermodynamic cycle of a gas turbine is modified in practical applications by disturbance factors such as:
-
- variations of environmental conditions (pressure, temperature and humidity);
- variations of pressure drops in the inlet air intake pipes;
- variations of the pressure drops in the exhaust gas discharge pipes;
- variations of the speed of the low pressure shaft (connected to the user).
If due allowance is not made for these disturbance factors, they may have the following effects:
-
- failure to achieve the maximum temperature TFire at the inlet of the first turbine wheel in full load conditions (with consequent reduction of the thermodynamic performance of the turbine);
- exceeding of the maximum temperature TFire at the inlet of the first turbine wheel in full load conditions, with consequent reduction of the maintenance interval for the turbine;
- failure to achieve the correct fuel-air ratio F/A in the combustion chamber with a consequent increase in the emission of pollutants such as nitrogen oxides (also abbreviated to NOx in the following text) and carbon monoxide, and the appearance of dangerous pressure pulsations in the combustion chamber or loss of ignition in the combustion chamber.
The object of the present invention is therefore to provide a method for controlling TFire and F/A which can overcome the aforementioned problems, particularly by proposing a corrected parameter control method for a two-shaft gas turbine which enables high machine efficiency to be achieved together with low emission of pollutants.
Another object of the present invention is to propose a corrected parameter control method for a two-shaft gas turbine which is reliable and is applied by means of simple relations which are easily implemented on the control panels of the machine.
These and other objects of the present invention are achieved by proposing a corrected parameter control method for a two-shaft gas turbine as disclosed in Claim 1.
Further characteristics of the corrected parameter control method for a two-shaft gas turbine are specified in the subsequent claims.
The characteristics and advantages of a corrected parameter control method for a two-shaft gas turbine according to the present invention will be made clearer by the following description, provided by way of example and without restrictive intent, which refers to the attached schematic drawings in which:
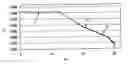
FIG. 1 shows a correlation between the exhaust temperature TX and the compression ratio PR relating to operating conditions in which the machine has reached the limit value of TFire or F/A in standard conditions, in other words where the speed of the low pressure wheel is 100%, the pressure drops are zero in the intake and exhaust pipes and the relative humidity is 60%; this curve shows the maximum permissible exhaust temperature for the gas turbine;
FIG. 2 shows two curves of the maximum exhaust temperature in standard operating conditions: the first curve 21 represents the curve of maximum exhaust temperature due to the attainment of the limit value of TFire; the second curve 23 represents the curve of maximum exhaust temperature due to the attainment of the limit value of F/A;
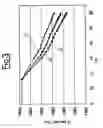
FIG. 3 shows how the curve of maximum exhaust temperature due to the limit value of TFire is modified by the variation of the speed of the low pressure wheel;
FIG. 4 shows how the curve of maximum exhaust temperature due to the limit value of F/A is modified by the variation of the speed of the low pressure wheel;
FIG. 5 is a diagram of the correlation between the variation of maximum exhaust temperature due to a variation of the environmental humidity with respect to the standard value of 60%;
FIG. 6 shows the correlation between the variation of maximum exhaust temperature and the variation of the pressure drops in the inlet pipes with respect to the standard value of 0 mm of water (abbreviated to 0 mmH2O);
FIG. 7 shows the correlation between the variation of maximum exhaust temperature and the variation of the pressure drops in the exhaust pipes with respect to the standard value of 0 mmH2O;
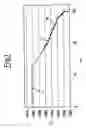
FIG. 8 shows a correlation between the exhaust temperature TX and the compression ratio PR and the ambient temperature (used as an independent parameter) relative to operating conditions in which the machine has reached the nominal value of F/A in standard conditions, in other words with a low pressure wheel speed of 100%, zero pressure drops in the intake and exhaust pipes and relative humidity of 60%; this curve represents the desired exhaust temperature for achieving the nominal value of F/A;
FIG. 9 is derived from FIG. 8 by nondimensionalizing it with respect to ambient temperature;
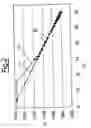
FIG. 10 shows the set of nondimensionalized curves (as in FIG. 9) relating to different speeds of the low pressure wheel;
FIG. 11 shows the correlation between the variation of the exhaust temperature required to achieve the nominal F/A and the variation of the environmental humidity with respect to the standard value of 60%;
FIG. 12 shows the correlation between the variation of exhaust temperature required to achieve nominal F/A and the variation of the pressure drops in the intake pipes with respect to the standard value of 0 mmH20;
FIG. 13 shows the correlation between the variation of exhaust temperature required to achieve nominal F/A and the variation of the pressure drops in the exhaust pipes with respect to the standard value of 0 mmH20.
With reference to the figures, a corrected parameter control method for a two-shaft gas turbine is indicated.
The control system consists of two feedback control loops by means of which the following actions are carried out independently:
- 1. First loop: protection of the machine by limiting the opening of the fuel valves to keep TFire and F/A within specified limits;
- 2. Second loop: control of F/A by controlling the opening of the bleed valve.
We shall start with a discussion of the control loop for protecting the machine from high values of TFire or F/A.
The limit operating conditions at full load are encountered when one of the following cases is present:
-
- the maximum fuel to air ratio F/A is reached in the combustion chamber, in other words there is a maximum temperature increment Trise of the gases in the combustion chamber;
- the maximum temperature TFire is present.
These limits can be expressed in the form of a curve on a plane PR-TX, in other words a curve showing the exhaust temperature TX as a function of the compression ratio PR of the axial compressor: when conditions on this curve are reached, the flow of fuel is reduced, so that the curve represents a curve of maximum permissible exhaust temperature.
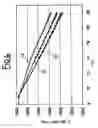
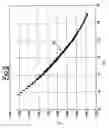
FIG. 1 shows a diagram of an example of a curve of maximum permissible exhaust temperature TX, expressed in degrees Rankine, at 100% of the load speed (in other words the speed of the low pressure shaft to which the load is applied) with pressure drops of 0 mmH20 at the intake and exhaust and 60% relative humidity, as a function of the compression ratio PR.
More precisely, the curve in the diagram of FIG. 1 has three zones.
For low compression ratios PR, there is a horizontal zone 11 of maximum exhaust temperature TX, due to limits on the materials of the exhaust pipe. As the compression ratio PR increases, the curve descends with a zone 13 where the limit due to the maximum TFire is applicable.
The curve continues with a zone 15 where the limit of maximum Trise is the determining factor, and the temperature TX decreases further as the compression ratio PR increases.
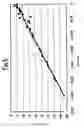
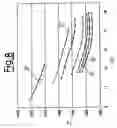
FIG. 2 shows two curves of maximum permissible exhaust temperature TX, as functions of the compression ratio PR.
More precisely, there is a curve 21 related to the maximum temperature TFire and a curve 23 related to the maximum Trise. The two curves 21 and 23 have a trend which is linear to a first approximation, with a negative slope; in particular, the two curves intersect at 25.
The control curve for the actual temperature TX is determined by selecting the minimum temperature TX from the curves 21 and 23, for each compression ratio PR.
Thus at low compression ratios PR the maximum TFire is the determining factor, while the limit of maximum Trise becomes decisive from the intersection 25 onwards.
The curve 21 related to the maximum TFire protects the machine from damage caused by excess temperatures due to overheating, and is always active.
On the other hand, the curve 23 depends on the maximum permissible F/A ratio, and therefore on the maximum Trise, and can be modified to meet the specific requirements of the combustion system.
It is therefore useful to have the two curves 21 and 23 additionally available in two separate diagrams, so that two different reference points or set points can be established for the TX controller of the fuel control loop. A minimum selector will select the appropriate set point of exhaust temperature TX, by selecting the minimum from the values of TX obtained by entering the curve 21 and the curve 23 with the compression ratio PR.
Ultimately, each environmental condition and each load characteristic on the low pressure shaft requires a specific temperature control curve.
In order to take the different situations into account, the corrected parameter control method for a two-shaft gas turbine is implemented according to the following formula, in order to ensure that the gas turbine is always in an ideal configuration:
TX=TXbase+DeltaTX—DPin+DeltaTX—DPout+DeltaTX—Hum+DeltaTX—PCNLP
Clearly, a linear approximation is provided, in which:
-
- TXbase is the maximum exhaust temperature obtained at 100% of rotation speed of the low pressure shaft, pressure drops of 0 mmH2O in the exhaust and intake pipes and 60% relative humidity reference temperature (see FIG. 1); this is equivalent to the minimum value of TX found for the same PR from the curves 21 and 23 of FIG. 2;
- DeltaTX_Dpin is the correction of the temperature TX due to the variation of the pressure drops in the intake pipes with respect to the nominal value of 0 mmH2O (see FIG. 6);
- DeltaTX_Dpout is the correction of the temperature TX due to the variation of the pressure drops in the exhaust pipes with respect to the nominal value of 0 mmH2O (see FIG. 7);
- DeltaTX_Hum is the correction of the temperature TX due to the variation of the relative humidity of the air with respect to the nominal value of 60% (see FIG. 5);
- DeltaTX_PCNLP is the correction of the temperature TX due to the variation of the speed of the low pressure shaft with respect to the nominal value of 100%; this parameter is found as the difference between Txbase and the minimum value of TX found for the same PR from the curves of FIGS. 3 and 4.
In the above equation, therefore, the exhaust temperature TX is derived from a reference temperature TXbase, to which are added four corrections called DeltaTX_Dpin, DeltaTX_Dpout, DeltaTX_Hum and DeltaTX_PCNLP.
Each correction term relates to a single environmental or operating parameter which differs from the reference parameter, and is calculated by computer simulations of the gas turbine. The simulations are generated by setting the attainment of the maximum permissible temperatures Tfire or Trise, for each condition differing from the reference condition.
The exhaust temperature TX found by the above simulations is compared with the reference temperature TXbase, so that the correction terms can be evaluated appropriately as differences.
Since two control curves 21 and 23 have been defined, two temperatures TXbase are provided, and each correction term has to be added to both.
We will now describe the method of evaluating DeltaTX_PCNLP, in other words the exhaust temperature correction term due to differences between the speed of the low pressure turbine (to which the load is applied) and the reference speed.
The speed of the low pressure turbine is the most important parameter for the correction of the exhaust temperature TX, since it acts directly on the efficiency of the low pressure turbine and therefore also on Tfire.
So that this importance can be taken into account, a maximum exhaust temperature curve is generated for each speed considered.
The equation for evaluating the current exhaust temperature TX then becomes somewhat different from that stated above, in other words
TX=TXbase(PCNLP)+DeltaTX—DPin+DeltaTX—Dpout+DeltaTX—Hum
where TXbase(PCNLP) is the reference temperature found for the specific speed of the low pressure turbine.
Clearly, there will be two values of TXbase(PCNLP): this is because there is a curve 21 for the maximum temperature Tfire and a curve 23 for the maximum permissible Trise. Thus the following formulae are required, with additional allowance for the dependence of the base curves on the compression ratio PR:
TX_maxTfire=TXbase_maxTfire(PCNLP,PR)+DeltaTX—DPin+DeltaTX—Dpout+DeltaTX—Hum
TX_maxTrise=TXbase_maxTrise(PCNLP,PR)+DeltaTX—DPin+DeltaTX—Dpout+DeltaTX—Hum.
Both of the temperature curves TXbase_maxTfire and TXbase_maxTrise can also be provided in the form of two-dimensional tables, since there are two independent variables, namely the compression ratio PR and the low pressure turbine speed PCNLP.
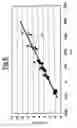
FIG. 3 shows a diagram of the maximum temperature TX, expressed in degrees Rankine, as a function of the compression ratio PR, which enables the maximum Tfire to be attained. It shows a set of curves 27, each for a specific value of speed PCNLP. More precisely, as this speed increases, the curve 27 generally has an increasingly negative slope, and is always of the type decreasing with a rise in the compression ratio PR.
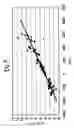
FIG. 4 shows a diagram of the maximum temperature TX, expressed in degrees Rankine, as a function of the compression ratio PR, which enables the maximum Trise to be attained. It shows a set of curves 29, each for a specific value of speed PCNLP. More precisely, as this speed increases, the curve 29 generally has an increasingly negative slope, and is always of the type decreasing with a rise in the compression ratio PR.
We will now describe the method of evaluating the term DeltaTX_Hum, in other words the correction of temperature TX which allows for the environmental humidity.
In fact, the significant parameter for characterizing atmospheric humidity is not the relative humidity (RH), which also depends on the temperature and on atmospheric pressure, but specific humidity (SH) which is the absolute water content of the atmosphere.
Additionally, according to current practice, the curves of maximum exhaust temperature TX are found by assuming a constant relative humidity of 60%.
For these two reasons, the most convenient parameter for expressing the moisture content of the air appears to be the difference DeltaSH, defined as the difference between the actual specific humidity and the specific humidity at a relative humidity of 60% (in the same conditions of temperature and atmospheric pressure), according to the formula:
DeltaSH=SH_current−SH—60% RH.
When DeltaTX_Hum is plotted on a diagram as a function of DeltaSH, a linear correlation appears between these two variables.
Therefore, in order to implement the correction due to atmospheric humidity in the corrected parameter control method for a two-shaft gas turbine according to the invention, it is necessary to use two correlations, namely:
-
- DeltaTX_Hum as a function of DeltaSH which is shown in FIG. 5;
- SH—60% RH as a function of atmospheric temperature, which can be found by interpolating the following values, where the temperature is expressed in degrees Rankine:
- SH—60% RH (T=419.67)=0.000070;
- SH—60% RH (T=428.67)=0.000116;
- SH—60% RH (T=437.67)=0.000188;
- SH—60% RH (T=446.67)=0.000299;
- SH—60% RH (T=455.67)=0.000464;
- SH—60% RH (T=464.67)=0.000707;
- SH—60% RH (T=473.67)=0.001059;
- SH—60% RH (T=482.67)=0.001560;
- SH—60% RH (T=491.67)=0.002263;
- SH—60% RH (T=500.67)=0.003324;
- SH—60% RH (T=509.67)=0.004657;
- SH—60% RH (T=518.67)=0.006367;
- SH—60% RH (T=527.67)=0.008670;
- SH—60% RH (T=536.67)=0.011790;
- SH—60% RH (T=545.67)=0.015966;
- SH—60% RH (T=554.67)=0.021456;
- SH—60% RH (T=563.67)=0.028552;
- SH—60% RH (T=572.67)=0.037585;
- SH—60% RH (T=581.67)=0.048949.
FIG. 5 shows the linear correlation, shown by the straight line 31, between DeltaTX_Hum, expressed in degrees Rankine, and DeltaSH.
We will now describe the parameter DeltaTX_Dpin, in other words the correction of temperature due to the pressure drop in the intake pipes.
Since a value of zero, in other words no drop, has been chosen as the reference for the drops in the intake pipes, the correction DeltaTX_Dpin can be expressed directly as a function of the measured pressure drop DPin.
By conducting various simulations, for which the attainment of max Tfire or max Trise with pressure drops different from zero had been specified, it was found that there was a correlation between Dpin and DeltaTX_Dpin. This correlation is linear to a first approximation and is shown in FIG. 6.
More precisely, FIG. 6 shows the linear correlation, shown by the straight line 33, between DeltaTX_Dpin, expressed in degrees Rankine, and Dpin, expressed in mm of water.
We will now examine DeltaTX_Dpout, in other words the correction of temperature due to the pressure drop in the exhaust pipes.
Since a value of zero, in other words no drop, has been chosen as the reference for the drops in the intake pipes, the correction DeltaTX_Dpout can be expressed directly as a function of the measured pressure drop DPout.
By conducting various simulations, for which the attainment of max Tfire or max Trise with pressure drops different from zero had been specified, it was found that there was a correlation between Dpout and DeltaTX_Dpout. This correlation is linear to a first approximation and is shown in FIG. 7.
More precisely, FIG. 7 shows the linear correlation, shown by the straight line 35, between DeltaTX_Dpout, expressed in degrees Rankine, and Dpout, expressed in mm of water.
2nd loop: we will now describe the control loop for controlling F/A (and consequently Trise) by controlling the opening of the bleed valve at partial loads. This valve is located between the atmosphere and the outlet of the axial compressor. The set point of the control loop controller is obtained from a set of TX-PR maps obtained for all operating conditions of the machine.
For each environmental condition, there is an infinite number of curves of exhaust temperature TX for attaining the nominal F/A (or nominal Trise): in particular, if other conditions remain constant, it is possible to define a control curve for each value of atmospheric temperature.
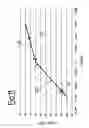
FIG. 8 shows a diagram of the maximum temperature TX for partial loads at a given speed of the low pressure shaft, expressed in degrees Rankine, as a function of the compression ratio PR. It shows a set of curves 37, each for a given value of atmospheric temperature. More precisely, as this temperature rises the curve 37 generally takes higher values, while always being of the type which decreases as the compression ratio PR increases.
According to the present invention, a corrected parameter method is used, in which all the aforementioned curves 37 are reduced to a single curve 39, shown in FIG. 9, to eliminate the dependence on the atmospheric temperature.
The curve 39 is obtained by the following mathematical transformation:
TTX=TX·(518.67/TCD)x
where
-
- TX is the actual exhaust temperature;
- 518.67 is a reference temperature which in this case is expressed in degrees Rankine;
- TCD is the exhaust temperature of the compressor, expressed in a unit of measurement compatible with that of the constant, and therefore in degrees Rankine in this case;
- X is a nondimensional exponent calculated in such a way as to minimize the mean quadratic deviation between the values of TTX calculated in this way and the interpolation curve 39;
- TTX is the exhaust temperature transformed by the preceding relation, referred to hereafter as the reduced temperature.
When the actual value of PR is known, and after application of the inverse of the above transformation, the curve 39 yields the set point for the TX controller of the control loop for F/A (and consequently for Trise).
Using the curve 39 makes it unnecessary to enter the large number of points which would be required to describe all the curves 37 of FIG. 8.
Even if the dependence on atmospheric temperature is removed, the curve of temperature TX for partial loads depends on the following conditions:
-
- pressure drop in the intake pipes;
- pressure drop in the exhaust pipes;
- atmospheric humidity;
- load characteristics (for example, by correlation between load and speed).
In a similar way to what has been described above in relation to the maximum exhaust temperature curve, the corrected parameter control method for gas turbines makes it possible to take into account operating conditions differing from the design conditions for the case of partial load control curves.
This is expressed by the formula:
TX=TXbase+DeltaTX—DPin+DeltaTX—Dpout+DeltaTX—RH+DeltaTX—PCNLP
where TXbase is obtained by inverting the formula given previously, thus:
TXbase=TTX/((518.67/TCD)x).
Each term of the above equation represents a correction to the reference temperature curve which takes the aforementioned parameters into consideration.
Each correction term is calculated by computer simulations of the gas turbine. The simulations are conducted by specifying the attainment of the desired F/A ratio (and consequently the attainment of the desired Trise), for each condition differing from the reference condition and at different partial loads.
The exhaust temperature TX found by the preceding simulations is compared with the reference temperature TXbase, in order to evaluate the correction terms in the appropriate way as differences.
We will now describe the method of evaluating the term DeltaTX_PCNLP, in other words the correction of exhaust temperature due to the speed of the low pressure turbine to which the load is applied.
As stated previously, the low pressure turbine speed is the most important parameter for the correction of the exhaust temperature TX, since it acts directly on the efficiency of the low pressure turbine and therefore also on Tfire.
To take this importance into account, a partial load exhaust temperature curve is generated for each speed considered.
The equation for evaluating the current exhaust temperature TX therefore becomes somewhat different from that given above, thus:
TX=TXbase(PCNLP)+DeltaTX—DPin+DeltaTX—Dpout+DeltaTX—RH
where TXbase(PCNLP) is the reference temperature found for the specific speed of the low pressure turbine.
FIG. 10 shows a diagram of the reduced temperature TTX, expressed in degrees Rankine, as a function of the compression ratio PR. It shows a set of curves 41, one for each given value of speed PCNLP. To find the true value of the parameter TXbase, the value of the exponent X must be known; this exponent is a function of the speed of the low pressure wheel, and typical values for a two-shaft turbine are given below by way of example:
-
- if PCNLP=105%, X=0.323
- if PCNLP=100%, X=0.33225
- if PCNLP=90%, X=0.34
- if PCNLP=80%, X=0.34425
- if PCNLP=70%, X=0.351
- if PCNLP=60%, X=0.348
- if PCNLP=50%, X=0.3505.
We will now describe the method of evaluating DeltaTX_RH, in other words the correction of temperature due to environmental humidity.
The reference value of environmental humidity is 60%. The current value of the water content in the air (specific humidity) is not constant, but depends on the atmospheric temperature.
To evaluate the effects of humidity in different conditions, the following were considered in the invention:
-
- three ambient temperatures (very cold day, ISO standard conditions, very hot day);
- three levels of relative humidity (0%, 60%, 100%);
- load characteristics according to a cubic law.
Thus nine simulations were conducted, specifying the attainment of the desired value of F/A and therefore of Trise, in order to achieve the reference level. The current values of TX were then plotted on a diagram as functions of PR.
The difference between the aforesaid diagram and the base curves yields DeltaTX_RH; this is expressed as a formula thus:
DeltaTX—RH=TX−TXbase.
The values of DeltaTX_RH, expressed in degrees Rankine, are plotted in FIG. 11 as a function of DeltaSH, where DeltaSH is defined as the difference between the current value of specific humidity SH_current and the specific humidity at RH=60%, SH—60% RH, which is the reference value. This is expressed as a formula thus:
DeltaSH=SH_current−SH—60% RH.
FIG. 11 shows two straight lines 43 and 45, rising with an increase in DeltaSH, in which the straight line 43, valid where DeltaSH is less than 0, has a greater slope than the straight line 45, valid where DeltaSH is greater than 0, the two straight lines 43 and 45 passing through a point near the origin of the axes. For example, the point 44 on the straight line 43 indicates various partial loads at an ambient temperature of 50° C. with RH=0%; the point 46 on the straight line 45 indicates various partial loads at an ambient temperature of 50° C. with RH=100%.
More particularly, FIG. 11 shows that:
-
- for a given DeltaSH, DeltaTX_RH is practically independent of the load and thus also of the compression ratio PR (a maximum deviation of 3° F. is observed at 50° C. with an RH of 0%);
- DeltaTX_TH is linearly proportional to DeltaSH, as shown by the two portions of straight line 43 and 45.
The relation between SH—60% RH and the ambient temperature has already been described.
We will now describe the parameter DeltaTX_Dpin, in other words the correction of exhaust temperature due to the pressure drop in the intake pipes.
Since the value of zero, in other words no drop, was chosen as the reference for the pressure drops in the intake pipes, the correction DeltaTX_Dpin can be expressed directly as a function of the measured pressure drop DPin.
To calculate the effects of the pressure drop in the intake pipes in different conditions, the following were considered in the invention:
-
- three ambient temperatures (very cold day, ISO standard conditions, very hot day);
- three pressure drops in the intake (0, 100 and 200 mm of water);
- load characteristics according to a cubic law.
The pressure drops considered were appropriately decreased at a partial load.
Thus nine simulations were conducted, specifying the attainment of the desired value of F/A, and therefore of Trise, in order to achieve the reference level. The current values of TX were then plotted on a diagram as functions of PR.
The difference between the aforesaid diagram and the base curves yields DeltaTX_Dpin; this is expressed as a formula thus:
DeltaTX—Dpin=TX−TXbase.
The values of DeltaTX_Dpin, expressed in degrees Rankine, are plotted in FIG. 12 as a function of Dpin.
FIG. 12 shows a straight line 47, rising with an increase in Dpin, expressed in mm of water.
More particularly, FIG. 12 shows that:
-
- for a given Dpin, the DeltaTX_Dpin is practically independent of the load and thus also of the compression ratio PR (a maximum deviation of 2° F. was observed);
- DeltaTX_Dpin is linearly proportional to Dpin.
We will now describe the parameter DeltaTX_Dpout, in other words the correction of temperature due to the pressure drop in the exhaust pipes.
Since the value of zero, in other words no drop, was chosen as the reference for the pressure drops in the exhaust pipes, the correction DeltaTX_Dpout can be expressed directly as a function of the measured pressure drop DPout.
To calculate the effects of the pressure drop in the exhaust pipes in different conditions, the following were considered in the invention:
-
- three ambient temperatures (very cold day, ISO standard conditions, very hot day);
- three pressure drops in the exhaust (0, 100 and 200 mm of water);
- load characteristics according to a cubic law.
The pressure drops considered were appropriately decreased at a partial load.
Thus nine simulations were conducted, specifying the attainment of the desired value of F/A, and therefore of Trise, in order to achieve the reference level. The current values of TX were then plotted on a diagram as functions of PR.
The difference between the aforesaid diagram and the base curves yields DeltaTX_Dpout; this is expressed as a formula thus:
DeltaTX—Dpout=TX−TXbase.
The values of DeltaTX_Dpout, expressed in degrees Rankine, are plotted in FIG. 13 as a function of Dpout.
FIG. 13 shows a straight line 49, rising with an increase in Dpout, expressed in mm of water.
In conclusion, in view of the above description, according to the corrected parameter control method for a two-shaft gas turbine according to the present invention, the correlation for calculating the maximum exhaust temperature TX is:
TX=TTX(PCNLP,PR)/((518.67/TCD)X(PCNLP))+DeltaTX—RH(DeltaSH)+DeltaTX—Dpin(Dpin)+DeltaTX—Dpout(Dpout).
The method according to the present invention can be applied advantageously in a two-shaft gas turbine with a dry nitrogen oxide (NOx) reduction system (also called a Dry Low NOx or DLN system).
The characteristics and the advantages of the corrected parameter control method for a two-shaft gas turbine according to the present invention are made clear by the above description.
It should be emphasized, in particular, that the introduction of corrected parameters into the control of DLN two-shaft turbines makes it possible to correct and eliminate effects due to disturbance factors by means of simple relations which can be implemented easily in existing control panels.
Finally, it is clear that the corrected parameter control method for a two-shaft gas turbine devised in this way can be modified and varied in numerous ways without departure from the invention; furthermore, all components can be replaced with equivalent elements or parameters.
The scope of protection of the invention is therefore delimited by the attached claims.
Claims
1. Corrected parameter control method for a two-shaft gas turbine, characterized in that protection of the said turbine is provided by a first control loop which controls the opening of the fuel valves to keep the temperature Tfire of the gas at the inlet of the first wheel of the said turbine and the fuel-air ration F/A within specified limits; the said control is provided in such a way that the set-point exhaust temperature TX is calculated as the sum of a reference temperature TXbase to which are added corrections relating to a single environmental or operating parameter which differs from the reference parameter.
2. Control method according to claim 1, characterized in that the said corrections are calculated by computer simulations of the said gas turbine, the said simulations being conducted by specifying the attainment of a maximum of the said temperature Tfire or a maximum of the said fuel-air ratio F/A, for each condition differing from the reference condition.
3. Control method according to claim 1, characterized in that there are four of the said corrections, the said exhaust temperature TX being expressed by the following formula:
TX=TXbase+DeltaTX—DPin+DeltaTX—DPout+DeltaTX—Hum+DeltaTX—PCNLP
where
DeltaTX_Dpin is the correction of the temperature TX due to the variation of the pressure drops in intake pipes with respect to a nominal value of 0 mmH2O,
DeltaTX_Dpout is the correction of the temperature TX due to the variation of the pressure drops in exhaust pipes with respect to a nominal value of 0 mmH2O,
DeltaTX_Hum is the correction of the temperature TX due to the variation of the relative humidity of the air with respect to a nominal value of 60%,
DeltaTX_PCNLP is the correction of the temperature TX due to the variation of the speed of the low pressure shaft with respect to a nominal value of 100%.
4. Control method according to claim 2, characterized in that the said exhaust temperature TX found by the said simulations is compared with the said reference temperature TXbase, in order to evaluate the said correction terms appropriately, as differences.
5. Control method according to claim 3, characterized in that a maximum exhaust temperature curve is generated for each considered speed of the said low pressure turbine.
6. Control method according to claim 5, characterized in that an equation for evaluating the said current exhaust temperature TX is:
TX=TXbase(PCNLP)+DeltaTX—DPin+DeltaTX—DPout+DeltaTX—Hum
where TXbase(PCNLP) is the reference temperature found for the said specific speed of the said low pressure turbine.
7. Control method according to claim 6, characterized in that there are two values of TXbase(PCNLP), one related to a curve (21) of maximum temperature Tfire and one related to a curve (23) of maximum increase of temperature Trise of the gas in the combustion chamber.
8. Control method according to claim 7, characterized in that the said two maximum values are, respectively,
TX_maxTfire=TXbase_maxTfire(PCNLP,PR)+DeltaTX—DPin+DeltaTX—Dpout+DeltaTX—Hum
TX_maxTrise=TXbase_maxTrise(PCNLP,PR)+DeltaTX—DPin+DeltaTX—Dpout+DeltaTX—Hum,
where a dependence on the compression ratio PR is also expressed.
9. Control method according to claim 8, characterized in that the said temperature curves TXbase_maxTfire and TXbase_maxTrise are provided in the form of two-dimensional tables, with the compression ratio PR and the low pressure turbine speed PCNLP as independent variables.
10. Control method according to claim 8, characterized in that a diagram of the said maximum temperature TX, shown as a function of the compression ratio PR which enables the maximum Tfire to be attained, shows a set of curves (27), each for a specific value of speed PCNLP, the said curve (27) generally having an increasingly negative slope as this speed increases, and being always of the type decreasing with a rise in the compression ratio PR.
11. Control method according to claim 8, characterized in that a diagram of the maximum temperature TX, shown as a function of the compression ratio PR, which enables the maximum Trise to be attained, shows a set of curves (29), each for a specific value of speed PCNLP, the said curve (29) generally having an increasingly negative slope as this speed increases, and being always of the type decreasing with a rise in the compression ratio PR.
12. Control method according to claim 3, characterized in that the said correction DeltaTX_Hum depends on the specific humidity SH and is expressed as a function of a difference DeltaSH, defined as the difference between the actual specific humidity and the specific humidity SH—60% RH at a relative humidity RH of 60% (in the same conditions of temperature and atmospheric pressure), according to the formula:
DeltaSH=SH_current−SH—60% RH.
13. Control method according to claim 12, characterized in that there is a linear correlation (31) between the said DeltaTX_Hum and the said DeltaSH.
14. Control method according to claim 13, characterized in that the said humidity SH—60% RH as a function of atmospheric temperature can be found by interpolating the following values, where the temperature is expressed in degrees Rankine:
SH—60% RH (T=419.67)=0.000070;
SH—60% RH (T=428.67)=0.000116;
SH—60% RH (T=437.67)=0.000188;
SH—60% RH (T=446.67)=0.000299;
SH—60% RH (T=455.67)=0.000464;
SH—60% RH (T=464.67)=0.000707;
SH—60% RH (T=473.67)=0.001059;
SH—60% RH (T=482.67)=0.001560;
SH—60% RH (T=491.67)=0.002263;
SH—60% RH (T=500.67)=0.003324;
SH—60% RH (T=509.67)=0.004657;
SH—60% RH (T=518.67)=0.006367;
SH—60% RH (T=527.67)=0.008670;
SH—60% RH (T=536.67)=0.011790;
SH—60% RH (T=545.67)=0.015966;
SH—60% RH (T=554.67)=0.021456;
SH—60% RH (T=563.67)=0.028552;
SH—60% RH (T=572.67)=0.037585;
SH—60% RH (T=581.67)=0.048949.
15. Control method according to claim 3, characterized in that the said correction DeltaTX_Dpin is expressed directly as a function of a measured pressure drop DPin.
16. Control method according to claim 15, characterized in that there is a linear correlation (33) between DeltaTX_Dpin and the said Dpin.
17. Control method according to claim 3, characterized in that the said correction DeltaTX_Dpout is expressed directly as a function of a measured pressure drop DPout.
18. Control method according to claim 17, characterized in that there is a linear correlation (35) between the said DeltaTX_Dpout and the said Dpout.
19. Corrected parameter control method for a two-shaft gas turbine, characterized in that the control of the said turbine at partial loads is provided by a second control loop which controls the opening of a vent valve to keep the temperature rise Trise of the gas in the combustion chamber (and consequently the fuel-air ratio F/A) within specified limits; the said control is provided by means of sets of maps of the exhaust temperature TX as a function of the compression ratio PR, obtained for each operating condition of the said gas turbine.
20. Control method according to claim 19, characterized in that a control curve is defined for each value of atmospheric temperature.
21. Control method according to claim 20, characterized in that there are diagrams showing the relation between the said temperature TX, for partial loads at a given speed of the low pressure shaft, and the compression ratio PR, each relation curve (37) being associated with a specified value of atmospheric temperature, the said curve (37) generally having higher values as this temperature rises, and being of the type which decreases as the compression ratio PR decreases.
22. Control method according to claim 21, characterized in that the said curves (37) are reduced to a single curve (39), thus eliminating the dependence on the atmospheric temperature.
23. Control method according to claim 22, characterized in that the said curve (39) is obtained by the following mathematical transformation:
TTX=TX·(518.67/TCD)x
where
TX is the actual exhaust temperature;
518.67 is a reference temperature;
TCD is the exhaust temperature of the compressor, expressed in a unit of measurement compatible with that of the constant;
X is a nondimensional exponent calculated in such a way as to minimize the mean quadratic deviation between the values of TTX calculated in this way and the interpolation curve (39);
TTX is the transformed exhaust temperature, in other words the reduced temperature.
24. Control method according to claim 23, characterized in that the said curve (39), when the actual value of PR is known and after the application of the inverse of the said transformation, yields the reference temperature TXbase, from which the set point is calculated for the controller of the said second F/A control loop.
25. Control method according to claim 24, characterized in that the said exhaust temperature TX is calculated by a linear approximation as the sum of the reference temperature TXbase to which are added corrections relating to a single environmental or operating parameter which differs from the reference parameter.
26. Control method according to claim 25, characterized in that there are four of the said corrections, the said exhaust temperature TX being expressed by the following formula
TX=TXbase+DeltaTX—DPin+DeltaTX—Dpout+DeltaTX—Hum+DeltaTX—PCNLP
where
TXbase is found by inverting the said transformation, thus: TXbase=TTX/((518.67/TCD)X);
DeltaTX_Dpin is a correction of the temperature TX due to the variation of pressure drops in intake pipes with respect to a nominal value of 0 mmH2O;
DeltaTX_Dpout is a correction of the temperature TX due to the variation of pressure drops in exhaust pipes with respect to a nominal value of 0 mmH2O;
DeltaTX_Hum is a correction of the temperature TX due to the variation of relative humidity of the air with respect to a nominal value of 60%;
DeltaTX_PCNLP is a correction of the temperature TX due to the variation of the low pressure shaft speed with respect to a nominal value of 100%.
27. Control method according to claim 26, characterized in that each correction term is calculated by computer simulations of the gas turbine, the desired F/A ratio being specified, for each condition differing from the reference condition and at different partial loads, the said exhaust temperature TX found by the said simulations being compared with the reference temperature TXbase, in order to evaluate the correction terms in the appropriate way as differences.
28. Control method according to claim 27, characterized in that a set of curves (41), one for each given value of speed PCNLP, is shown in a diagram of the said maximum temperature TX as a function of the compression ratio PR.
29. Control method according to claim 28, characterized in that an equation for evaluating the current exhaust temperature TX is:
TX=TXbase(PCNLP)+DeltaTX—DPin+DeltaTX—Dpout+DeltaTX—RH
where TXbase (PCNLP) is the reference temperature found for the specific speed of the low pressure turbine.
30. Control method according to claims 23 and 29, characterized in that the said exponent X is a function of the speed of the low pressure wheel.
31. Control method according to claim 30, characterized in that the exponent X, for intermediate speeds PCNLP, can be calculated by interpolation of the values of X calculated at the speeds PCNLP considered:
if PCNLP=105%, X=0.323
if PCNLP=100%, X=0.33225
if PCNLP=90%, X=0.34
if PCNLP=80%, X=0.34425
if PCNLP=70%, X=0.351
if PCNLP=60%, X=0.348
if PCNLP=50%, X=0.3505.
32. Control method according to claim 26, characterized in that the said correction DeltaTX_RH is calculated by considering:
three ambient temperatures (very cold day, ISO standard conditions, very hot day);
three levels of relative humidity (0%, 60%, 100%);
load characteristics according to a cubic law.
33. Control method according to claim 32, characterized in that nine simulations are conducted, the desired value of F/A being specified, in order to achieve the reference level, the current values of TX then being plotted on a diagram as functions of PR, while a difference between the said diagram and the base curves yields the said DeltaTX_RH, as expressed in the formula:
DeltaTX—RH=TX−TXbase.
34. Control method according to claim 33, characterized in that the said values of DeltaTX_RH are plotted on the diagram as a function of the difference DeltaSH between the current value of specific humidity SH_current and the specific humidity at RH=60%, SH—60% RH, which is the reference value, and thus
DeltaSH=SH_current−SH—60% RH.
35. Control method according to claim 34, characterized in that the said diagram shows two straight lines (43 and 45), rising with an increase in DeltaSH, in which a first straight line (43), valid where DeltaSH is less than 0, has a greater slope than the second straight line (45) which is valid where DeltaSH is greater than 0, the two straight lines (43 and 45) passing through a point near the origin of the axes.
36. Control method according to claim 26, characterized in that the said correction DeltaTX_Dpin is expressed directly as a function of the measured pressure drop DPin.
37. Control method according to claim 36, characterized in that the following are considered:
three ambient temperatures (very cold day, ISO standard conditions, very hot day);
three pressure drops in the intake (0, 100 and 200 mm of water);
load characteristics according to a cubic law.
38. Control method according to claim 37, characterized in that nine simulations are conducted, the attainment of the desired value of F/A being specified, in order to achieve the reference level, the current values of TX then being plotted on a diagram as functions of PR, the difference between the said diagram and the base curves yielding the said DeltaTX_Dpin, this being expressed in the formula
DeltaTX—Dpin=TX−TXbase.
39. Control method according to claim 38, characterized in that the said values of DeltaTX_Dpin are linearly correlated (47) with the said Dpin, the said values increasing with a rise in Dpin.
40. Control method according to claim 26, characterized in that the said correction DeltaTX_Dpout is expressed directly as a function of the measured pressure drop DPout.
41. Control method according to claim 40, characterized in that the following are considered:
three ambient temperatures (very cold day, ISO standard conditions, very hot day);
three pressure drops in the exhaust (0, 100 and 200 mm of water);
load characteristics according to a cubic law.
42. Control method according to claim 41, characterized in that nine simulations are conducted, the attainment of the desired value of F/A being specified, in order to achieve the reference level, the current values of TX then being plotted on a diagram as functions of PR, a difference between the said diagram and the base curves yielding the said DeltaTX_Dpout, as expressed in the formula:
DeltaTX—Dpout=TX−TXbase.
43. Control method according to claim 42, characterized in that the said values of DeltaTX_Dpout are linearly correlated (47) with the said Dpout, the said values increasing with a rise in Dpout.
44. Control method according to claims 35, 39 and 43, characterized in that a correlation for calculating the maximum exhaust temperature TX is:
TX=TTX(PCNLP,PR)/((518.67/TCD)X(PCNLP))+DeltaTX—RH(DeltaSH)+DeltaTX—Dpin(Dpin)+DeltaTX—Dpout(Dpout).
45. Control method according to claim 1 or 19, characterized in that the said two-shaft gas turbine is provided with a dry nitrogen oxide (NOx) reduction system.
Images & Drawings included:


Sources:
- United States Patent and Trademark Office - verify current appl. status at the USPTO↗
Recent applications in this class:
- » 20240209751 2024-06-27
Method of evaluating performance of gas turbine and device executing this method - » 20240191633 2024-06-13
Thermal soak-back mitigation - » 20230287802 2023-09-14
LEAK DETECTION SYSTEM FOR ANTI-ICE DUCTS - » 20230193779 2023-06-22
Method for quickly stopping the rotor of a helicopter after landing - » 20230184132 2023-06-15
OPERATION OF A GAS TURBINE AT A HIGH TEMPERATURE AND GAS TURBINE ASSEMBLY - » 20230108788 2023-04-06
ASSEMBLY COMPRISING TWO CONCENTRIC TUBULAR PORTIONS AND A SET OF SENSORS FOR SENSING THERMAL FLOW INSIDE THE OUTER TUBULAR PORTION - » 20220307385 2022-09-29
Non-optical flame detector and method for a combustor of a turbine engine - » 20220195886 2022-06-23
SYSTEM AND METHOD FOR MITIGATING BOWED ROTOR IN A GAS TURBINE ENGINE - » 20220136405 2022-05-05
SYSTEMS AND METHODS OF SERVICING EQUIPMENT - » 20220127971 2022-04-28
Methods and systems for determining a synthesized engine parameter
Recent applications for this Assignee:
- » 20100161285 2010-06-24
Method and device for acoustic length testing of compressor - » 20090016888 2009-01-15
Disk of a disk rotor for a gas turbine - » 20080314046 2008-12-25
Procedure for controlling the useful life of the gas turbines of a plant - » 20070169483 2007-07-26
Combustion system with low polluting emissions - » 20070166149 2007-07-19
Vane system equipped with a guiding mechanism for centrifugal compressor - » 20070153870 2007-07-05
Assembly system of a thermocouple for gas turbine - » 20070122273 2007-05-31
Multistage centrifugal compressor - » 20070110569 2007-05-17
Multistage centrifugal compressor having a tank which can be opened horizontally - » 20060153692 2006-07-13
Method and system for monitoring a reciprocating compressor - » 20060057305 2006-03-16
Method for treating organs subject to erosion by liquids and anti-erosion coating alloy