METHOD FOR DETECTION OF PATHOGENIC ORGANISMS
US20140018445A1
2014-01-16
13/732,625
2013-01-02
Abstract:
A method for detection of pathogenic organisms wherein the method includes differentiation between species. The method is especially suitable to detect and to diagnose infection by pathogenic organisms which are hard and/or laborious to detect with conventional methods. The method relies upon analysis of specific variable regions of the RNase P RNA gene, namely the P3 and/or P19 region(s).
Inventors:
- Björn HERRMANN 1 🇸🇪 UPPSALA, Sweden
- Leif KIRSEBOM 6 🇸🇪 UPPSALA, Sweden
- Pelle STOLT 1 🇸🇪 UPPSALA, Sweden
Interested in similar patents?
Get notified when new applications in this technology area are published.
Classification:
C12Q1/689 » CPC main
Measuring or testing processes involving enzymes, nucleic acids or microorganisms ; Compositions therefor; Processes of preparing such compositions involving nucleic acids; Nucleic acid products used in the analysis of nucleic acids, e.g. primers or probes for detection or identification of organisms for bacteria
C12Q1/68 IPC
Measuring or testing processes involving enzymes, nucleic acids or microorganisms ; Compositions therefor; Processes of preparing such compositions involving nucleic acids
Description
FIELD OF THE INVENTION
The present invention relates to a method for detection of pathogenic organisms wherein the method includes differentiation between species. The method is especially suitable to detect and to diagnose infection by pathogenic organisms which are hard and/or laborious to detect with conventional methods. The method relies upon analysis of specific variable regions of the RNase P RNA gene.
BACKGROUND OF THE INVENTION
RNase P is an enzyme present in all living cells. It catalyses the removal of 5′ leader sequences from tRNA precursor molecules. In bacteria, RNase P consists of an RNA molecule of some 400 nt in length (11, 28) and a small (about 120 aa) protein (33). In the division bacteria, the RNA moiety has been shown to function as an efficient catalyst in vitro (12); hence at least in these organisms, RNase P is a ribozyme (an RNA molecule catalysing chemical reactions). Bacterial RNase P RNAs have been separated into two main structural classes. Type A is the most common structural class and type B is found in the low G+C Gram-positive Bacteria (50). The secondary structure of RNase P RNA has been characterised for many bacterial lineages and variation among the helices provides useful phylogenetic information (51).
The RNase P RNA gene sequences are not very well preserved between bacterial groups, (5) but within a genus, genes can be quite similar. Several hundreds of RNase P RNA sequences are present in the RNase P RNA database ((http://jwbrown.mbio.ncsu.edu/RNaseP/home.html).
The order Chlamydiales is a group of obligately intracellular bacteria which have a unique developmental cycle and pathogenicity. They are parasites of humans and a wide variety of animals. Species in the Chlamydiaceae family have recently been reclassified into two genera, Chlamydia and Chlamydophila, that include nine species (43). In addition, new families now also belong to Chlamydiales, and they include Parachlamydiaceae and Simkaniaceae (43). The type species of Parachlamydiaceae is Parachlamydia acanthamoebae, a symbiont of the amoebae Acanthamoeba castellani and an occasional pathogen of people who acquire this amoebae (34). Simkania negevensis is the type species of Simkaniaceae and, like many other chlamydiae, also causes human infection (56, 57, 61).
It has previously been shown that the RNase P RNA genes in the genus Clamydia differ sufficiently between species to be useful as a diagnostic tool (13); thus the gene is potentially useful for strain differentiation. The differences between sequences also give hints to which parts of the molecule are important for catalytic activity, complementing mutational and structural studies.
Another important family of pathogens, where fast and sensitive diagnostic methods are vital, are the mycobacteria. Traditional diagnostic methods have relied on the demonstration of acid-fast bacilli in clinical samples following cultivation. This is reliable but time consuming, since slow-growing species such as Mycobacterium tuberculosis may need six to eight weeks to form a sufficiently large population. In the last few years, many PCR-based detection assays have been developed based on eg the hsp60 gene (16) or the variable interspersing region between the 16S and 23S rRNA genes (15, 24, 30) and this trend continues.
The RNase P RNA gene sequence from M. tuberculosis is known (6) as well as that from M. bovis BCG and M. leprae. The M. bovis sequence is identical to that from M. tuberculosis, while there are differences to M. leprae. The regions in the RNase P RNA gene which have been indicated by other means as important for catalytic activity, were almost totally conserved between the mycobacteria. The close relationship within microbial genuses, such as mycobacteria, has rendered differentiation between species of the same genus very difficult or impossible.
SUMMARY OF THE INVENTION
The present invention solves the problem of differentiation between species within the same genus, such as mycobacteria and chlamydia. Furthermore, the present invention solves the problem of detecting pathogens which are hard and/or laborious to detect with conventional methods.
The inventive method may in principle be used for diagnosing infection by any kind of pathogenic organism.
Thus the pathogens include archaebacteria and eubacteria. The latter contains as its principal groups gliding bacteria, spirochetes, rigid bacteria and mycoplasmas. Rigid bacteria include actinomycetes and simple unicellular bacteria. The latter group consists of obligate intracellular parasites and free-living bacteria. Among the free-living variants there are (1) gram-positive bacteria in which group there are (a) cocci, (b) non-sporulating rods, (c) sporulating rods that can be further subdivided into obligate aerobes and obligate anaerobes; and (2) gram-negative bacteria in which there are (a) cocci, (b) non-enteric rods with spiral forms and straight rods, and (c) enteric rods with facultative anaerobes, obligate aerobes and obligate anaerobes. For specific bacteria species see further Medical Microbiology, (Brooks et al, eds., 19th ed. (1991), Prentice-Hall International, USA).
The pathogens include also fungi, including pathogenic yeasts and molds. Examples are Apergillus, Candida, Absidia, Mucor, Rhizopus, Cryptococcus, Hisoplasma, Blastomyces, Coccidiodes, Paracoccidiodes, Sporotrichosis, Chromoblastomycosis, Mycetoma, Microsporum, Trichophyton and Epidermophyton.
Other pathogens that may be diagnosed may be found among the protozoa and algae.
Of course, the method of the invention can also be used for detection of non-pathogenic bacteria.
The following bacteria are especially interesting for the purposes of the present invention: Bacteria of phylum II—Green bacteria; Phylum III—Deinobacteria (Thermus/Deinococcus); Phylum IV—Spirochetes; Phylum VI—Gram negative anaerobes and gliding bacteria (Bacteroides/Flavobacterium); Phylum VIII—Chlamydia; Phylum IX—Gram positives with the three lineages: lineage A (“Gram negatives”), lineage B (G+C-rich bacteria), lineage C (G+C-poor bacteria); Phylum X—cyanobacteria; Phylum XI—proteobacteria with the five lineages alpha, beta, gamma, delta and E.
The present inventors detected differences in the RNase P RNA gene which were sufficient to enable species determination.
In a first aspect, the invention relates to a method for detection of pathogenic organisms including inter-species differentiation, comprising using the P3 and/or P19 hypervariable region(s) of the RNase P RNA gene as a diagnostic target.
The purpose of the method of the invention may be, for example, diagnose of infection caused by pathogenic bacteria and epidemic investigation of the spreading of drug resistant bacteria.
Preferably, the region(s) is/are amplified, such as by PCR (Polymerase Chain reaction) and sequenced or otherwise fingerprinted for species identification, such as by heteroduplex analysis, size determination, RFLP (Restriction Fragment Length Polymorphism), melting point determination etc.
In a second aspect the invention relates to a method for detection of bacteria including inter-species differentiation, comprising amplification of nucleic acids of hypervariable region(s) of the RNase P RNA gene from the pathogens; forming a heteroduplex with related nucleic acid; and analysis thereof.
An example of a method according to the invention involving a heteroduplex analysis, comprises of an amplification reaction, a hybridisation step and a non-denaturing gel electrophoresis analysis. The whole process can be carried out in less than 24 hours.
In a third aspect, the invention relates to use of the P3 and/or P19 variable regions(s) in the RNAse P RNA gene as a drug target in the production of a medicament for the treatment of microbial infection.
BRIEF DESCRIPTION OF THE DRAWINGS
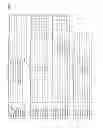
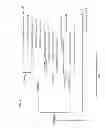
FIG. 1 depicts the sequence alignment of the RNase P RNA genes from mycobacteria;
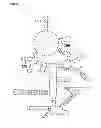
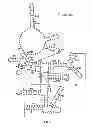
FIG. 2 depicts the secondary structure of M. tuberculosis RNase P RNA;
FIG. 3 depicts the sequence alignment of the RNase P RNA gene from M. gastri (identical sequence from two different strains) and six strains of M. kansasii;
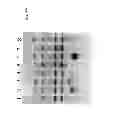
FIG. 4A depicts the Heteroduplex analysis of the first 280 bp from RNase P RNA gene regions from different mycobacteria;
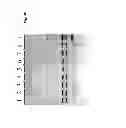
FIG. 4B depicts the Heteroduplex analysis of DNA amplified from clinical samples of bacteria believed to be either M. intracellulare or M. avium;
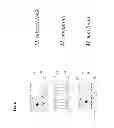
FIG. 5 depicts the suggested structure for the P18 loop of RNase P from mycobacteria, based on sequence variations within the genus;
FIG. 6 depicts the DNA sequence comparison of rnpB from the 9 Chlamydiaceae species, P. acanthamoebae and S. negevensis;
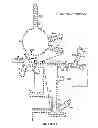
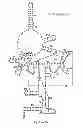
FIG. 7 depicts the deduced secondary structures of RNase P RNA in C. psittaci, P. acanthamoebae and S. negevensis; and
FIG. 8 depicts the neighbour-joining tree based on rnpB, showing the relationships among members of the family Chlamydiaceae. P. acanthamoebae, strain Bn9T and S. negevensis, strain ZT were chosen as outgroups.
DETAILED DESCRIPTION OF THE INVENTION
The invention will now be described in greater detail in relation to two non-limiting examples.
Example 1
Mycobacteria
Materials and Methods
Bacterial Strains.
Mycobacteria used in this study are listed in Table 1 below. Clinical strains were already typed by 16S RNA gene sequencing in their respective institutes of provenance.
The RNase P RNA sequences for M. tuberculosis, M. bovis BCG and M. leprae were retrieved from the GenBank sequence database.
| TABLE 1 | ||
| Strain | ||
| Species | description | Provenance |
| M. gastri | ATCC 15754 | ATCC |
| M. kansasii | ATCC 12748 | ATCC |
| M. intracellulare | D673 | Trudeau Mycobacterial |
| Collection | ||
| M. xenopi | ATCC 19276 | ATCC |
| M. smegmatis | mc2 155 | Ref. 26 |
| M. avium | D702 | Trudeau Mycobacterial |
| Collection | ||
| M. marinum | clinical strain | Research Centre Borstel |
| M. fortuitum | clinical strain | Research Centre Borstel |
| M. malmoense | clinical strain | Research Centre Borstel |
| M. paratuberculosis | 6783 | G-F Gerlach School of |
| Veterinary Medicine, | ||
| Hanover Germany | ||
| M. gordoniae | clinical strain | Research Centre Borstel |
| M. celatum | clinical strain | Research Centre Borstel |
PCR Amplification of the RNase P RNA Genes.
Based on the published sequences of M. tuberculosis and M. leprae, (GenBank Accession Numbers Z70692 and L78818 respectively) a primer pair was designed which hybridised close to the ends of the gene. The forward primer tbf (5′ CGGATGAGTTGGCTGGGCGG 3′) and reverse primer tbr (5′ GTTGGCCTGTAAGCCGGATT 3′) both show one mismatch to the M. leprae sequence. Using this primer pair, the RNase P gene could be amplified from all mycobacteria tested. Most reactions were run on untreated mycobacteria from cultures, without previous isolation and purification of chromosomal DNA. PCR was done in 50 μl reactions in a Rapidcycler capillary PCR apparatus (Idaho technology, Idaho Falls USA) with the following parameters: 94° C. 10″; 50° C. 10″ 72° C. 15″.
Sequencing.
PCR products were purified over 1 percent agarose gels to remove the primers. Approximately 1/20 of the purified DNA was used for automated sequencing with the same primers as were used in the amplification reaction. Sequencing was done on an Applied Biosystems model 310 capillary sequencer.
Heteroduplex Analysis.
For heteroduplex analysis of the RNase P P3 loop region, DNA was amplified (50 μl reactions) with the oligonucleotides tbf and 280r (5′ CTTGCTTGCCCTCCCTTTGCC 3′) which give a product of about 250 bp. The products were gel purified and approximately 1/10 of the products used in each analysis. DNA was mixed with equal amounts of DNA from M. tuberculosis, heated to 95° C. for 1′ and allowed to cool to room temperature. The products were separated on 10 percent non-denaturing polyacrylamide gels run at 15 mA for 14 hrs. Bands were visualised by silver staining.
Silver Staining of DNA Gels.
Gels were fixated in 10 percent ethanol for 5′, and incubated in 1 percent nitric acid for 5′. Staining was in a 1 mg/ml solution of silver nitrate for 30′. Bands were developed in a sodium carbonate/formaldehyde solution (15 g anhydrous sodium carbonate and 300 μl 37 percent formaldehyde in 500 ml water) until clearly visible. The reaction was stopped with 10 percent acetic acid.
Results
The results from Example 1 will be presented below in association with the accompanying drawings, FIGS. 1-5:
FIG. 1. Sequence alignment of the RNase P RNA genes from mycobacteria. Dashes indicate sequence identities; stars mark bases missing in a sequence.
FIG. 2. Secondary structure of M. tuberculosis RNase P RNA. Regions diverging between mycobacterial species are shaded. Minor variable regions are not shown.
FIG. 3. Sequence alignment of the RNase P RNA gene from M. gastri (identical sequence from two different strains) and six strains of M. kansasii. Bases unique to the M. gastri sequence are boldfaced.
FIG. 4 A. Heteroduplex analysis of the first 280 bp from RNase P RNA gene regions from different mycobacteria. DNA from diverse mycobacterial species was hybridised with M. tuberculosis DNA and the resulting duplexes separated on a 10 percent polyacrylamide gel. Lane 1, control DNA from M. tuberculosis; lane 2, M. avium; lane 3, M. intracellulare; lane 4, M. malmoense; lane 5, M. celatum; lane 6, M. kansasii; lane 7, M. vaccae; lane 8, M. xenopii.
FIG. 4B. Heteroduplex analysis of DNA amplified from clinical samples of bacteria believed to be either M. intracellulare or M. avium. Lane 1, control DNA from M. tuberculosis; lanes 2, 3, 6, DNA from suspected M. avium; lanes 4, 5, 7, DNA from suspected M. intracellulare; lane 8, control DNA from M. avium; lane 9, control DNA from M. intracellulare.
FIG. 5. Suggested structure for the P18 loop of RNase P from mycobacteria, based on sequence variations within the genus. The sequences are from A) M. tuberculosis; B) M. smegmatis; C) M. marinum
In PCR amplifications of the RNase P RNA gene from mycobacteria using the oligonucleotides tbf and tbr, each reaction yielded a single fragment in the range of 387 (M. celatum) to 428 (M. tuberculosis) by depending on mycobacterial species.
Using these oligonucleotides it was possible to amplify the RNase P RNA genes from all mycobacteria tested, using untreated cells from culture or plates. No previous purification of chromosomal DNA was necessary. An alignment of the sequences (FIG. 1) shows very well conserved nucleotide sequences along most of the gene, with the exception of three major regions where the similarities break down and no adequate alignment is possible. The overall similarity of the genes was between 80 and 85 percent. This is not a very informative figure however, since the similarity within the well conserved regions is close to 100 percent, while the divergent regions are too dissimilar to be aligned at all.
If the divergent regions are localised on a two-dimensional representation of the RNase P RNA molecule (FIG. 2), it is conspicuous how most of the differences fall into regions which belong to ends of stem-loop structures. The major divergent regions are the P3, P16 and P19 loops. In addition, there is a deletion in the P12 loop in M. smegmatis and M. fortuitum, comprising several unpaired nucleotides of this loop. The major interspecies differences are within the P3 and P19 loops.
All species analysed had specific RNase P RNA gene sequences. Several closely related species could be differentiated on basis of the RNase P RNA sequences. The members of the MAI complex M. avium and M. intracellulare differed in several positions, including a deletion in the P19 loop in M. avium (FIG. 2). The very closely related (subspecies) M. paratuberculosis and M. avium were indistinguishable on basis of RNase P RNA gene sequences.
As far as our analysis went, within a species, sequences are identical. We sequenced clinical samples from all members of the M. tuberculosis complex (M. tuberculosis, M. bovis, M. bovis BCG, M. africanum, M. microti and M. tuberculosis ssp asiaticum) without detecting any deviations from the published M. tuberculosis sequence (6). Thus, members of this group could not be differentiated on the basis of RNase P RNA gene differences. The possibility of sequence differences between different serovars of mycobacteria was investigated for some species. In the case of M. avium and M. intracellulare, the RNase P RNA gene from five clinical isolates (animal) of M. avium and five M. intracellulare (human) was amplified and sequenced. No differences between serovars could be detected.
The one species where heterogenous RNase P RNA gene sequences were observed between different serovars was M. kansasii (FIG. 3). The differences were mainly C-to-T transitions. Two strains of M. gastri were sequenced as well, but in this species the gene sequences were identical between isolates. In four positions, all RNase P RNA gene sequences from M. kansasii strains differed from those of M. gastri. Three of these differences were C-to-T transitions, while the fourth was a C-to-A transversion.
The interspecies differences found in the P3 and P19 loops were considered to be large enough for an attempt at a simple diagnostic application through heteroduplex analysis. The hypervariable P3 region was chosen for this analysis and amplified using the tbf and 280r oligonucleotides. Each PCR reaction yielded single bands of about 250 bp. The region from M. tuberculosis was used as a standard and was mixed in equal amounts with the products from different species. After separating the fragments on non-denaturing polyacrylamide gels, the bands were silver stained. There were clear differences in the heteroduplex pattern between all species tested (FIG. 4A).
This analysis was taken further by applying it to clinical samples (from the Swedish Institute of Infectious Disease Control) which had or had not been previously typed. On the resulting gel (FIG. 4B) the samples in lanes 2, 3 and 6 can be attributed to M. avium (compare to lane 8), while samples 4, 5 and 7 seem to be M. intracellulare (compare to lane 9). Sequencing the RNase P RNA gene in each case confirmed the results obtained from heteroduplex analysis.
DISCUSSION
Compared with the case of Clamydia, the RNase P genes from mycobacteria are better preserved between species, with overall similarities of 80-85 percent. This overall value is misleading, however, since most differences cluster in specific regions, where the variability is of a degree that makes an unambiguous alignment impossible. All mycobacterial RNase P RNAs show a P15-P17 region of the Clamydia and cyanobacteria type, (13, 31) which is hardly surprising given the close relatedness of the organisms.
All species studied had their own conspicuous sequence characteristics. Within a species, no differences were seen except for M. kansasii, a species which has on other grounds been described as heterogeneous (1, 14, 32). Even though several of the variant positions were shared between M. kansasii and M. gastri, there are enough M. kansasii-specific bases in the gene to enable differentiation from the closely related M. gastri through microsequencing or heteroduplex analysis. M. kansasii is an important cause of pulmonary disease resulting from non-tuberculous mycobacteria.
The combination of very well conserved regions and hypervariable sites in the RNase P RNA gene sequence enables fast typing of unknown mycobacterial samples. Oligonucleotides will hybridise with perfect or close to perfect match to conserved regions allowing for a reliable amplification of the variable parts in between.
The M. avium complex (MAI) which includes M. avium and M. intracellulare, is a major opportunistic infection in AIDS patients (21, 22). Differentiating between the members of this complex requires molecular methods and our heteroduplex analysis of PCR products from the RNase P RNA gene offers a rapid and fairly inexpensive alternative to current methods (7, 8, 10, 18, 19, 23, 27, 29).
Sequence variances in the RNase P RNA gene between species can also yield clues to the molecular structure of the RNA. In the case of the mycobacteria (FIG. 2), almost all variances in the sequences were in unpaired regions, or in structures which seem unimportant for catalytic activity in vitro.
For instance, in two species, M. smegmatis and M. fortuitum, the bases 160-164 corresponding to the end of the P12 loop, (FIG. 2) are not present in the RNase P RNA gene sequence. The P12 loop is missing in the gene from some other organisms, such as Mycoplasma fermentans (4, 25) and thus does not seem necessary for ribozyme activity.
The alignment also supports conclusions about RNase P structure drawn from other experiments. Suggested important regions such as the motif by 75-85 and pairing nt 409-417 (FIG. 2) are preserved throughout all analysed mycobacterial species. In all probability, these two regions base pair, since matching sequences are well conserved between organisms. The most variable regions between mycobacterial species were the P3 and P19 loops respectively. The P19 structure is not necessary for RNase P activity in vitro (25) and there is considerable variability in the P3 loop between organisms, but their role in vivo is unclear.
The suggested structure of M. tuberculosis RNase P RNA could still be improved upon with the help of sequence variations between species. A structure which is believed to be of importance is the P18 stem-loop, (the region nt 330-351) which has a well-preserved stem in the Escherichia coli and Clamydia RNase P RNAs. The suggested mycobacterial structure has a far less convincing stem structure. (See FIG. 2, which is based on the old structure prediction.) However, in M. smegmatis and M. marinum there are variations from the consensus sequence. (FIG. 1) A slightly different stem-loop structure would accommodate for these exchanges while keeping a consensus secondary structure intact, at the same time allowing for a more convincing base-paring pattern (FIG. 5). This also strengthens the argument for the importance of this stem-loop for RNase P function.
Example 2
Chlamydia
Materials and Methods
Bacterial Strains.
DNA of analysed organisms were released by standard Proteinase K treatment of cell culture grown organisms and phenol extracted or were provided as purified DNA-preparations (Table 2).
| TABLE 2 |
| Strains, host of origin, references, sources and accession numbers |
| Strain | Host of origin | Reference | Source* | Accession no. |
| Chlamydophila psittaci | ||||
| 6BCT (VR-125T)† | Psittacine | Golub & Wagner (1947) | Storey | AJ012169 |
| GD | Duck | Illner (1960) | NADC | |
| NJ1 | Turkey | Page (1959) | NADC | |
| WC | Cattle | Page (1967) | NADC | |
| VS225 | Psittacine | NADC | ||
| 360 | Duck | Storey | ||
| N352 | Duck | Richmond et al. (1982) | Storey | |
| Cal10 | Human | Francis & Magill (1938) | Storey | |
| CP3 (VR-574) | Pigeon | Page & Bankowski (1960) | NADC | |
| M56 (VR-630) | Muskrat | Spalatio et al. (1966) | NADC | |
| Chlamydophila abortus | ||||
| B577T (VR-656T) | Ovine, abortion | Perez-Martinez & Storz (1985) | Denamur | AJ131092 |
| EBA | Bovine, abortion | Perez-Martinez & Storz (1985) | NADC | |
| OSP | Ovine | Andersen & Van Deusen (1988) | NADC | |
| EAE/Lx | Ovine, abortion | Storey | ||
| AB7 | Ovine, abortion | Rodolakis et al. (1989) | Rodolakis | |
| OC1 | Ovine, conjunctivitis | Rodolakis et al. (1989) | Rodolakis | |
| AV1 | Bovine, abortion | Rodolakis et al. (1989) | Rodolakis | |
| AC1 | Caprine, abortion | Rodolakis et al. (1989) | Rodolakis | |
| IC1 | Ovine | Rodolakis et al. (1989) | Rodolakis | |
| Chlamydophila felis | ||||
| F P BakerT | Feline | Baker (1942) | NADC | AJ012171 |
| Cello | Feline | Cello (1967) | Storey | |
| Pring | Feline | Wills et al. (1984) | Storey | |
| Chlamydophila caviae | ||||
| GPICT (VR-813T) | Guinea pig | Murray (1964) | Storey | AJ012172 |
| Chlamydophila pecorum | ||||
| E58T (VR-628T) | Bovine | McNutt & Waller (1940) | NADC | AJ012173 |
| IB1 | Ovine | Rodolakis et al. (1989) | Rodolakis | AJ131091 |
| IC4 | Ovine | Rodolakis et al. (1989) | Rodolakis | |
| AB10 | Ovine, abortion | Rodolakis et al. (1989) | Rodolakis | |
| IPA (VR-629) | Ovine | Page & Cutlip (1968) | NADC | AJ131090 |
| H3 | Koala | Storey | AJ131089 | |
| Chlamydophila pneumoniae‡ | ||||
| TW183T (VR-2282T) | Human | Grayston et al. (1989) | ATCC | AJ012174 |
| CM1 (VR-1360) | Human | Black et al. (1992) | Black | |
| CWL011 | Human | Black et al. (1992) | Black | |
| CWL029 (VR-1310) | Human | Black et al. (1992) | Black | |
| CWL050 | Human | Black et al. (1992) | Black | |
| FML16 | Human | Black et al. (1992) | Berdal | |
| P1 | Human | Herrmann et al. (1996) | UHU | |
| JG915 | Human | Herrmann et al. (1996) | UHU | |
| JG954 | Human | Herrmann et al. (1996) | UHU | |
| TWAR 2023 (VR-1356) | Human | Chirgwin et al. (1989) | ATCC | |
| Chlamydia trachomatis | ||||
| A/Har-13T (VR-571 BT)§ | Human | Wang & Grayston (1962) | Persson | AJ131088 |
| L1/440/LN (VR-901B)§ | Human | Schachter & Meyer (1969) | Persson | AJ012175 |
| Chlamydia suis | ||||
| S45T (VR-1474T) | Swine | Kaltenboeck et al. (1993) | NADC | AJ012176 |
| R22 | Swine | Rogers et al. (1993) | NADC | |
| Chlamydia muridarum | ||||
| MoPnT (VR-123T) | Mouse | Nigg (1942) | NADC | AJ012177 |
| SFPD | Hamster | Stills et al. (1991) | NADC | |
| Simkania negevensis | ||||
| ZT (VR-1471T) | Cell culture | Kahane el al. (1995) | Kahane | AJ012178 |
| Parachlamydia acanthamoebae | ||||
| Bn9T | Amoeba/human | Amann et al. (1997) | Michel | AJ012179 |
| Berg1T | Amoeba/human | Amann et al. (1997) | Michel | |
| Superscript ‘T’ indicates the type species |
PCR Amplification and DNA Sequence Determination.
The rnpB gene in species of Chlamydiaceae was amplified by PCR with the primer pair BH1-BH2, which was designed based on the C. trachomatis sequence (13) (Table 3).
| TABLE 3 |
| Primer used for amplification of the rnpB gene |
| Nucleotide | ||
| positions | ||
| in rnpB of | ||
| Chlamydia | ||
| trachomatis | ||
| Primer | Sequence | (see FIG. 6) |
| BH1 | 5′CGGACTTATAAGAAAAGAT-3′ | 64 to 83 |
| (upper) | ||
| BH2 | 5′-(A/G)TAAGCCGGGTTCTGT-3′ | 392 to 377 |
| (lower) | ||
| BM1 | 5′-(A/G)(A/G)(C/A)G(A/G) | 48 to 64 |
| (A/G)GAGGAAAGTCC-3′ | ||
| (upper) | ||
| JB1 | 5′-CGAACTAATCGGAAGAGTAAG | −8 to 15 |
| GC-3′ (upper) | ||
| JB2 | 5′-GAGCGAGTAAGCCGG(A/G)TTC | 398 to 377 |
| TGT-3′ (lower) | ||
The reaction mixture contained 0.2 μM of each primer, 200 μM dNTP, 1.5 mM MgCl2, 10 mM Tris-HCl (pH 8.3), 50 mM KCl, 15% glycerol and 2 U Taq polymerase. Amplification conditions consisted of 7 cycles with 45 s at 94° C., 45 s at 42° C., 1 min at 72° C. followed by 35 cycles where the annealing temperature was increased to 58° C. If not otherwise stated, all PCR-products mentioned in the text refer to the use of the primer pair BH1-BH2, which amplified 82% of the full-length gene. To generate the 5′-flanking region from type strains of the nine Chlamydiaceae species we used the primer pair JB1-JB2 which was obtained from the complete RNase P RNA gene sequence of C. trachomatis (kindly provided by Dr J. Brown). Amplification conditions were as described for the BH1-BH2 primer pair, except that glycerol was omitted and the annealing temperatures were 53° C. and 58° C., respectively. For amplification of S. negevensis and P. acanthamoebae the BH 1 primer was replaced by BM 1, which included highly conserved nucleotides as previously described (13), but did not permit sequencing of the 5′ end of rnpB. The resulting PCR products were sequenced by using a terminator labelled cycle sequencing chemistry and sequence reactions were analyzed on a 310 Genetic Analyzer (Perkin-Elmer). Sequences were submitted to EMBL and all accession numbers listed in Table 2 are from the present study.
Sequence Alignment and Phylogenetic Analysis.
Sequence alignment required secondary structure modelling of each RNase P RNA molecule which was performed manually by using comparative sequence analysis. The predicted structures were subsequently used in the alignment procedure as an aid for the identification of loop and stem regions. The alignment was used to study molecular phylogeny. The calculated distance matrix was corrected for multiple base changes at single locations by the one parameter model of Jukes & Cantor (1969)(55). This matrix was subsequently used to compute a phylogenetic tree by using the neighbor-joining program (77), implemented under the name NEIGHBOR in the Phylogenetic Inference Package, PHYLIP version 3.51c (44). Maximum parsimony trees were inferred using the DNAPARS program. The SEQBOOT program was used to bootstrap the trees based on neighbor-joining and maximum parsimony by resampling the data sets 1000 times. The construction of the maximum likelihood tree was performed with the DNAML program using the F84 model of molecular evolution applying empirical base frequencies, global rearrangement and the jumble option.
Preparation of RNase P RNA and Substrates.
To test rnpB catalytic activity, the full-length C. trachomatis rnpB was PCR amplified, cloned behind a T7 promoter, and assayed for tRNA precursor cleavage. We designed a PCR primer matching the 5′ end (5′ TTGAATTCGAAATTAATACGACTCACTATAGCGAACTAATCGGAAGAGTA). Underlined residues match the C. trachomatis rnpB while the remaining part of the primer corresponds to the T7 promoter. We designed a primer complementing the 3′ end (5′TTTAAGCTTGGATGGTACCTTGAAAAGCTCGGAAGAGCGAGTAA). Underlined residues are complementary to the C. trachomatis rnpB and the unmarked residues were incorporated in order to be able to cleave the resulting plasmid with FokI). The PCR amplified C. trachomatis rnpB was cut with EcoRI and HindIII and inserted into pUC19 which had been cut with the same enzymes. The recombinant plasmid was transformed in Escherichia coli strain DH5a following standard protocols.
The E. coli RNase P RNA, the C. trachomatis RNase P RNA and the precursor tRNATYrSu3 were generated using the T7 DNA dependent RNA polymerase as described elsewhere (59 and references therein).
RNase P RNA Assay.
The RNase P RNA activity was monitored at 37° C. in our standard reaction buffer (50 mM Tris-HCl (pH 7.5), 5% (w/v) PEG 6000, 100 mM NH4Cl (or 1M NH4Cl as indicated) and 100 mM MgCl2) as previously described (59 and references therein) and the final concentration of C. trachomatis RNase P RNA was ≈2.4 pmol·mL−1 and of precursor tRNATYrSu3≈0.052 pmol·mL−1.
Nucleotide Sequence Accession Numbers.
Representative nucleotide sequences for examined species have been submitted to EMBL. Accession numbers are listed in Table 2.
Results
The results from Example 2 will be discussed below in association with the accompanying drawings FIGS. 6-8:
FIG. 6: DNA sequence comparison of rnpB from the 9 Chlamydiaceae species, P. acanthamoebae and S. negevensis. Dots indicate identity with the C. trachomatis A/Har-13T sequence and dashes indicate gaps in the alignment. The hypervaribale regions P3, P12, P17 and P19 are indicated. Numbering is according to Brown (39).
FIG. 7: Deduced secondary structures of RNase P RNA in C. psittaci, P. acanthamoebae and S. negevensis. The nucleotides in the primer sequences are in lower case type, m indicates an adenine-cytosine mixture, and r indicates adenine-guanine mixture at this position. N denotes tentative nucleotides in the flanking regions of the primer based on the minimum consensus bacterial RNase P RNA (39).
FIG. 8: Neighbour-joining tree based on rnpB, showing the relationships among members of the family Chlamydiaceae. P. acanthamoebae, strain Bn9T and S. negevensis, strain ZT were chosen as outgroups. Parsimony and ML analyses produced an identical branch order. However, two taxa branched slightly different in the ML tree and this node is marked with an asterisk. Bootstrap support values at the nodes were obtained from 1000 resamplings of the data set using neighbor-joining and maximum parsimony. The scale bar indicates 5 substitutions per 100 nucleotides.
Comparison of rnpB Sequences
PCR products that included 82% of the full-length rnpB gene were obtained from 60 chlamydial strains. The products from P. acanthamoebae strain Bn9T and Berg17 were 313 bases long and their sequences were identical. The sequence of the 299-bp product from the ZT strain of S. negevensis was 68.9% similar to the P. acanthamoebae sequence. The Chlamydiaceae PCR products were between 63.8% and 69.3% similar to the segments available from P. acanthamoebae and S. negevensis. The rnpB sequences from Chlamydia and Chlamydophila, which are the 2 genera in the Chlamydiaceae, were 75.9%-83.3% similar. The 18 strains belonging to Chlamydia were >89.9% similar; the 38 strains belonging to Chlamydophila were >84.8% similar. The 14 C. trachomatis sequences differed by only a single base substitution in the LGV biovar compared to the Trachoma biovar. The 2 Chlamydia suis strains differed in only two nucleotide positions. The 6 Chlamydia pecorum strains were identical or differed by only 1 or 2 bases. Sequences were identical within species for 10 Chlamydia psittaci strains (except strain M56, see below), 10 Chlamydia pneumoniae TWAR biovar sequences, 9 Chlamydia abortus sequences, 3 Chlamydia felis sequences and the 2 Chlamydia muridarum sequences.
Nearly full-length gene segments (98% of the rnpB gene) were generated by PCR using primers JB1 and JB2 from a subset of 14 strains that included all of the 9 Chlamydiaceae species. Comparison of these sequences reduced the inter-species similarity as much as 2.6% as because they included the variable P3 region. The diversity in rnpB was large enough to clearly distinguish species groupings in the Chlamydiaceae. Unlike ompA gene products, which differ by up to 50%, and ribosomal RNA genes, which differ by <10%, this diversity will readily permit the design of genus- and group-specific PCR probes.
The strains MoPnT (mouse) and SFPD (hamster) of the species C. muridarum have been shown to differ in their MOMP gene sequences (85). In contrast, the rnpB genes in the two C. muridarum strains were identical, as also has been found in the ribosomal 16S/23S intergenic spacers and 23S domain I segments (42). Evolutionary pressure on the surface exposed protein has clearly been greater than on the genes involved in the translation process.
Twenty two strains which were classified as C. psittaci until recently have now been separated into C. psittaci, C. abortus, C. felis and C. caviae.
Our study separated these strains into the 4 species groupings by rnpB gene sequence differences of up to 6.7% (data not shown). These species have been isolated from host groups of distant origin and they cause a wide spectrum of diseases (Table 2). Only C. psittaci strain M56 conflicted with its classification as C. psittaci and PCR of this strain produced an rnpB sequence that matched the feline sequences analyzed in this study. M56 history provides some insight why this may have occurred. M56 was isolated in 1961 from a muskrat in Canada (79), then stocked and distributed to ATCC from the USDA National Animal Disease Center in Ames, Iowa, USA. In cell culture, the ATCC preparation of M56 grew out as M56 serotype in one cell line and as the feline serotype in another (Andersen, unpublished). Fukushi & Hirai (1989)(46) reported a feline serotype for M56 obtained from ATCC. PCR of M56 cultured at NADC on Aug. 1, 1990 in the yolk sacs of embryonating eggs gave C. psittaci-avian-like ribosomal and full-length major outer membrane protein gene sequences (42). M56 DNA used in the current study was an aliquot from the 1997 study (Table 2). In view of this history, our rnpB analysis suggests that M56 cultures were contaminated with feline chlamydiae during the 1960's and that uncontaminated isolates may no longer be available.
Secondary Structures of the RNase P RNA
Alignment of the sequences of the rnpB gene derived from the nine Chlamydiaceae species indicated four hypervariable regions located in distinct stem loops, denoted as P3, P12, P17 and P19 in the suggested secondary structures (FIG. 7).
The P15 loop (see FIG. 7) is of interest since in most bacterial RNase P RNA molecules it harbours a GGU-motif that interacts with tRNA precursors by base pairing with the 3′-terminal RCCA motif of the tRNA (60). The absence of this sequence motif from all members of the Chlamydiales is striking and an ATAA-bulge is seen in all nine Chlamydiaceae species (positions 291 to 294 in C. psittaci, FIG. 7), except in C. pneumoniae (GAAA) and in C. felis (ACAA). Furthermore, a different structure in the P15 region of Chlamydiaceae species is rationalized by the finding that none of the identified tRNA genes encode the 3′ terminal CCA sequence (80).
Interestingly, the P15 region in P. acanthamoebae harbours a purine rich bulge carrying a GGU-motif. This might indicate that these RNase P RNAs interact with the 3′ terminal RCCA sequence as does E. coli RNase P RNA, given that the CCA sequence is encoded in the tRNA genes in this species. By contrast, the P15 loop structure of RNase P RNA derived from S. negevensis is similar to that observed in most cyanobacteria (87) and it carries a GGAU-motif in the P15 loop as does RNase P RNA derived from Thermus thermophilus (53). It has been suggested that this loop of RNase P RNA in T. thermophilus carries a high-affinity binding site for the 3′ end of a tRNA precursor (52) and it may therefore also be valid for S. negevensis.
The RNase P RNA in Chlamydiaceae species harbour a P18 helix while P. acanthamoebae and S. negevensis appears to lack this element. It has previously been shown that the P18 helix can be deleted without losing catalytic activity, suggesting that it is not directly involved in catalysis (49). The P18 helix, when present, is associated with a phylogenetically conserved GNRA tetra loop which docks into its suggested receptor in P8 (the G83C93 base pair in C. psittaci; FIG. 2; (38, 62). Furthermore, bacterial RNase P RNAs that lack the P18 helix have an extended P8 helix and it has been suggested that this compensates for the loss of P18 (38). Since neither P. acanthamoebae nor S. negevensis have an extended P8 or an apparent P18 with a GNRA tetra loop, perhaps the nucleotides in the P18 region form an alternative structural element that interacts with P8.
A long range interaction has also been suggested between the GNRA tetra loop in the P14 helix and the P8 stem (38, 62). This is supported by our present data in all nine species of Chlamydiaceae (the U82A94 base pair and G201 in C. psittaci, FIG. 7) and by the presence of an A in the P14 loop and the GC base pair in P8 in P. acanthamoebae and S. negevensis (FIG. 2). Given the presence of this interaction, it is surprising that in the three serovars L1 to L3 of C. trachomatis the G205 nucleotide (corresponding to G201 in C. psittaci in FIG. 7) is substituted by an A, but without a corresponding base pair shift in the P8 helix.
In the minimum consensus bacterial RNase P RNA certain positions have 100% conserved nucleotide bases (39). Our data showed that the well-conserved cytosine at position 60 has been replaced by a uracil in all examined species of the Chlamydophila genus (FIG. 7), while no change was observed for the Chlamydia genus. This generates either a UG wobble base pair or a UA base pair, depending on the residue at position 376 (numbering refers to C. psittaci). The region of the RNase P RNA derived from these species could not be examined with the primers used in the present study.
Cleavage of tRNA Precursors by C. Trachomatis RNAse P RNA
Bacterial RNase P RNA is catalytically active in the absence of the RNase P protein moiety (33 and references therein). To investigate whether Chlamydia RNase P RNA alone is able to cleave its substrate we generated C. trachomatis RNase P RNA and analysed the cleavage pattern using the E. coli tRNATYrSu3 (pSu3) precursor as substrate. This RNase P RNA was indeed able to cleave pSu3 at the expected position only when using NH4Cl at high concentration, as described in Methods. This is in keeping with a previous observation of cleavage by C. trachomatis RNase P RNA (51). Taken together with the structural observations this demonstrates that RNase P RNA does not require a P15 internal loop (or a P15 hairpin loop) for catalytic activity. However, we note that the extent of cleavage by C. trachomatis RNase P RNA was significantly reduced compared to cleavage by E. coli RNase P RNA.
Phylogeny of the Family Chlamydiaceae
The secondary structures of the helices P15, P16, P17, P18, and P19 were the most difficult regions to resolve for the members of the Chlamydiaceae. Consequently, two of these regions, namely P17 and P19, were removed from the final data set that was used for phylogenetic calculations. This was due to the high nucleotide variability in the locale of P17 and the apparent absence of the helix P19 in the rnpB gene of P. acanthamoebae (FIGS. 6 & 7). Also, the ambiguously aligned positions 94, 150, 151, 153, 286 and 298 (according to the numbering of the rnpB gene of C. trachomatis in FIG. 6) were removed prior to phylogenetic analysis. Gapped positions were generally not omitted from the final alignment except for the termini of the 5′-end, since the positions 1 to 68 were not determined for S. negevensis and P. acanthamoebae. Consequently, the corrected final alignment comprised 271 positions.
Different algorithms were used to calculate evolutionary trees to reveal the phylogenetic relationships among the species of the family Chlamydiaceae. Virtually identical tree topologies were obtained by using distance matrix and character based methods. A representative phylogenetic tree derived by using neighbor-joining (NJ) (Saitou & Nei, 1987) is shown in FIG. 3. The stability of the branching order was evaluated statistically by the determination of bootstrap percentage values. These values as obtained by NJ and maximum parsimony are given at the nodes. The branching order supported by the maximum likelihood tree (ML) has also been added to each branching point in FIG. 3. Two taxa branched somewhat differently in the dendrogram constructed by ML and the actual node displaying this instability has been furnished with an asterisk. Identical tree topologies to those shown in FIG. 3 were also obtained when only using rnpB data from the species belonging to Chlamydophila and Chlamydia but extending the data set to comprise the nucleotide information of the 5′-end. Therefore, the branching order in this part of the tree was not resolved.
The tree in FIG. 8 shows that the genera Chlamydophila and Chlamydia can readily be distinguished from one another by comparing rnpB gene sequences. These findings are consistent with recently published phylogenies based on full-length 16S and 23S ribosomal RNA genes, and on their intergenic spacer regions (42, 43, 73). However, this conflicts with the results presented for the 16S rRNA gene by Pettersson et al. (1997). A plausible explanation is that the 16S rRNA study was based on only 4/5 of the full-length nucleotide information for these genes and that some of the sequences used for comparison were rather distantly related. Therefore, some phylogenetic information was lost in the final data set. In a subsequent 16S rRNA analysis using almost complete 16S rRNA gene sequences and only close relatives as outgroups, there was limited correlation with other branching orders. Thus it can be concluded that 16S rRNA genes provide low resolution in describing the evolutionary interrelationships of the members of the Chlamydiaceae family.
Analysis of the rnpB gene demonstrated that chlamydial phylogeny need not rely entirely on genes for which there is only weak branch support. While 16S rRNA analyses show numerous long branches with clusters attached, the rnpB analysis has evenly distributed sequence differences that distinguish chlamydial groups at family, genus, and species levels. The sequence diversity of the rnpB gene in the species of the order Chlamydiales will make it possible to use this gene for the discrimination of chlamydial species. Moreover, this specificity reveals a functional isolation of each grouping that is consistent with the species-specific ecological niches as described (70). The conservation is also consistent with previously identified groupings. The specificity found in so basic a function as tRNA processing, suggests that the species groupings in the Chlamydiaceae have been evolutionarily isolated for a very long period of time. The presented phylogenetic analysis supports the revision of the classification of the Chlamydiaceae family as previously described (43).
In summary, the sequence of the RNase P RNA gene (rnpB) was determined for 60 strains representing all nine species in the Chlamydiaceae family and for the related Chlamydiales species, Parachlamydia acanthamoebae and Simkania negevensis. These sequences were used to infer evolutionary relationships among the Chlamydiaceae. The analysis separated Chlamydophila and Chlamydia into two lineages, with Chlamydophila forming three distinct clusters: the Chlamydophila pneumoniae strains, the Chlamydophila pecorum strains and a third cluster comprising the species Chlamydophila psittaci, Chlamydophila abortus, Chlamydophila caviae and Chlamydophila felis. The Chlamydia line of descent contained two clusters, with the Chlamydia suis strains distinctly separated from strains of Chlamydia trachomatis and Chlamydia muridarum. This analysis indicated that the rnpB sequence and structure are distinctive markers for species in the Chlamydiaceae. We also demonstrated that the RNase P RNA derived from C. trachomatis is able to cleave a tRNA precursor in the absence of protein. Our findings are discussed in relation to the structure of Chlamydia RNase P RNA.
REFERENCES
- 1. Abed, Y., C. Bollet, and P. De Micco 1995. Demonstration of Mycobacterium kansasii species heterogeneity by the amplification of the 16S-23S spacer region. J. M. Microbiol. 43: 156-158
- 2. Alcaide F., I. Richter, C. Bernasconi, B. Springer, C. Hagenau R. Schulze-Robbecke, E. Tortoli, R. Martin, E. C. Böttger, and A. Telenti. 1997. Heterogeneity and clonality among isolates of Mycobacterium kansasii: Implications for epidemiological and pathogenicity studies. J. Clin. Microbiol. 35:1959-1964
- 3. Bascunana C. R. and K. Belak K. 1996. Detection and identification of mycobacteria in formalin-fixed, paraffin-embedded tissues by nested PCR and restriction enzyme analysis. J. Clin. Microbiol. 10:2351-2355.
- 4. Brännvall, M., J. G. Mattsson, S. G. Svärd S. G., and L. A. Kirsebom. 1998. RNase P RNA structure and cleavage reflect the primary structure of tRNA genes. J. Mol. Biol. 283:771-83
- 5. Brown J. W. and N. R. Pace. 1992. Ribonuclease P RNA and protein subunits from bacteria. Nucleic Acids Res. 20:1451-1456.
- 6. Cole S. T., R. Brosch, J. Parkhill, T. Garnier, C. Churcher, D. Harris, S. V. Gordon, K. Eiglmeier, S. Gas, C. E. 3rd Barry, F. Tekaia, K. Badcock,
- D. Basham, D. Brown, T. Chillingworth, R. Connor, R. Davies, K. Devlin, T. Feltwell, S. Gentles, N. Hamlin, S. Holroyd, T. Hornsby, K. Jagels, B. G. Barrell, et al., 1998. Deciphering the biology of Mycobacterium tuberculosis from the complete genome sequence. Nature 393:537-44.
- 7. Crawford J. T. 1994. Development of rapid techniques for identification of M. avium infections. Res. Microbiol. 145:177-181.
- 8. Devallois A., M. Picardeau, K. S. Goh, C. Sola, V. Vincent, and N. Rastogi. 1996. Comparative evaluation of PCR and commercial DNA probes for detection and identification to species level of Mycobacterium avium and Mycobacterium intracellulare. J. Clin. Microbiol. 34:2756-2759.
- 9. Devallois A., M. Picardeau, C. N. Paramasivan, V. Vincent, and N. Rastogi. 1997 Molecular characterization of Mycobacterium avium complex isolates giving discordant results in AccuProbe tests by PCR-restriction enzyme analysis, 16S rRNA gene sequencing, and DT1-DT6 PCR. J. Clin. Microbiol. 35:2767-2772.
- 10. Frothingham R., and K. H. Wilson. 1994. Molecular phylogeny of the Mycobacterium avium complex demonstrates clinically meaningful divisions. J. Infect. Dis. 169:305-312.
- 11. Gardiner K. and N. R Pace. 1980. RNase P of Bacillus subtilis has an RNA component. J. Biol. Chem. 255:7507-7509
- 12. Guerrier-Takada, C., K. Gardiner, T. L. Marsh, N. R. Pace, and S. Altman. 1983. The RNA moiety of RNase P is the catalytic subunit of the enzyme. Cell 35:849-857
- 13. Herrmann B., O. Winqvist, J. G. Mattsson, and L. A. Kirsebom L A. 1996. Differentiation of Chlamydia spp. by sequence determination and restriction endonuclease cleavage of RNase P RNA genes. J. Clin. Microbiol. 34:1897-1902.
- 14. Iinuma Y., S. Ichiyama, Y. Hasegawa, K. Shimokata, S. Kawahara, and T. Matsushima. 1997. Large-restriction-fragment analysis of Mycobacterium kansasii genomic DNA and its application in molecular typing. J. Clin. Microbiol. 35: 596-599
- 15. Ji-e Y., K. E. Kempsell, M. J. Colston and R. A. Cox. 1994 Nucleotide sequences of the spacer-1, spacer-2 and trailer regions of the rrn operons and secondary structures of precursor 23S rRNAs and precursor 5S rRNAs of slow-growing mycobacteria Microbiology 140:1763-1773.
- 16. Kapur V., L.-L. Li, M. R. Hamrick, B. B. Plikaytis, T. M. Shinnick, A. Telenti,
- Jr W. R. Jacobs, A. Banerjee, S. Cole, K. Y. Yuen, J. E. Clarridge III, B. N. Kreiswirth, and J. M. Musser. 1995. Rapid Mycobacterium species assignment and unambiguous identification of mutations associated with antimicrobial resistance in Mycobacterium tuberculosis by automated DNA sequencing. Arch. Pathol. Lab. Med. 119:131-138.
- 17. Kole R. M. F. Baer, B. C. Stark, and S. Altman. 1980. E. coli RNAase P has a required RNA component in vivo. Cell 19:881-887
- 18. Kulski J. K., C. Khinsoe, T. Pryce, and K. Christiansen. 1995. Use of a multiplex PCR to detect and identify Mycobacterium avium and M. intracellulare in blood culture fluids of AIDS patients. J. Clin. Microbiol. 33:668-674.
- 19. Nishimori K., M. Eguchi, Y. Nakaoka, Y. Onodera, T. Ito, and K. Tanaka. 1995. Distribution of IS901 in strains of Mycobacterium avium complex from swine by using IS901-detecting primers that discriminate between M. avium and Mycobacterium intracellulare. J. Clin. Microbiol. 8:2102-2106.
- 20. Picardeau M., G. Prod'hom, L. Raskine, M. P. LePennec, and V. Vincent. 1997. Genotypic characterization of five subspecies of Mycobacterium kansasii. J. Clin. Microbiol. 35 25-32.
- 21. Rastogi N., W. W. Barrow, J. O. Falkinham III, C. O. Thoen, J. T. Crawford, B. T. Mangura, L. B. Reichman, L. B Heifets, B. Dautzenberg, L. S. Young, L. E. Bermudez, C. D. Inderlied, A. E. Suzuki, J. M. Inamine, P. R. J. Gangadharam, M. V. Reddy, M. Denis, H. Shiratsuchi, J., L. Johnson, J. J. Ellner, J. T. Belisle, and P. J. Brennan. 1994. 11th Forum in Microbiology, “Laboratory and clinical aspects of the Mycobacterium avium epidemic: contributing factors associated with variability of drug susceptibility and immune responsiveness, and the multifaceted nature of pathogenicity”. Res. Microbiol. 145:167-261.
- 22. Rastogi N., J. J. McFadden, M. L. Gourgeon, L. Montagnier, F. M. Collins, C. R. Horsburgh, R. J. Coker, T. J. Hellyer, I. N. Brown, J. N. Weber, I. M. Orme, D. Chatterjee, J. D. A. Van Embden, D. Van Soolingen, P. M. Small, P. W. M. Hermans, S. E. Hoffner, G. Källenius, S. B. Svenson, R. S. Wallis, J. J. Ellner, H. Shiratsuchi, G. A. W. Rook, A. Vyakarnam, D. M. Yajko, L. S. Young, L. E. M. Bermudez, C. B. Inderlied, Z. M. Kunze, F. Portaels, and V. Labrousse. 1992. 8th Forum in Microbiology, “Mycobacteria and AIDS: epidemiological and genetic markers, virulence factors and interactions with the immune system.” Res Microbiol. 143:357-440.
- 23. Richter E., S, Niemann, S. Rusch-Gerdes, and S. Hoffner. 1999 Identification of Mycobacterium kansasii by using a DNA probe (AccuProbe) and molecular techniques. J. Clin. Microbiol. 37: 964-970
- 24. Roth A., M. Fischer, M. E. Hamid, S. Michalke, W. Ludwig, and H. Mauch. 1998 Differentiation of phylogenetically related slowly growing mycobacteria based on 16S-23S rRNA gene internal transcribed spacer sequences. J. Clin. Microbiol. 36:139-147.
- 25. Siegel, R. W., A. B. Banta, E. S. Haas, J. W. Brown, and N. R. Pace. 1996. Mycoplasma fermentans simplifies our view of the catalytic core of ribonuclease P RNA. RNA 2: 452-62.
- 26. Snapper, S. B., R. E. Melton, S. Mustafa, T. Kieser, and Jacobs WR Jr. 1990. Isolation and characterization of efficient plasmid transformation mutants of Mycobacterium smegmatis. Mol. Microbiol. 4:1911-1919
- 27. Sritharan V., J. V. Iralu, and R. H. Barker Jr. 1995. Specificity of diagnostic PCR amplification for M. avium using the probe pMAV22. Mol. Cell. Probes 9:71-74.
- 28. Stark, B. C., R. Kole, E. J. Bowman and S. Altman. 1978. Ribonuclease P: an enzyme with an essential RNA component. Proc. Natl. Acad. Sci. USA 3717-3721
- 29. Telenti, A. F. Marchesi, M. Balz, F. Bally E. C. Böttger, and T. Bodmer. 1993. Rapid identification of mycobacteria to the species level by polymerase chain reaction and restriction enzyme analysis. J. Clin. Microbiol. 31:175-178.
- 30. Van der Giessen J. W. B., R. M. Haring, and B. A. M. Van der Zeijst. 1994 Comparison of the 23S ribosomal RNA genes and the spacer region between the 16S and 23S rRNA genes of the closely related Mycobacterium avium and Mycobacterium paratuberculosis and the fast-growing Mycobacterium phlei. Microbiology. 140:1103-1108.
- 31. Vioque A. 1992. Analysis of the gene encoding the RNA subunit of ribonuclease P from cyanobacteria. Nucleic Acids Res. 20:6331-37
- 32. Woolford A. J., R. G. Hewinson, M. Woodward, and J. W. Dale 1997. Sequence heterogeneity of an mpb70 gene analogue in Mycobacterium kansasii. FEMS Microbiol. Lett. 148:43-48)
- 33. Altman, S. & Kirsebom, L. A. (1999). Ribonuclease P. In The RNA world: Second edition (Gesteland, R. F., Cech, T. & Atkins, J. F., eds.), pp. 351-380. Cold Spring Harbour Laboratory Press, New York.
- 34. Amann, R., Springer, N., Schonhuber, W., Ludwig, W., Schmid, E. N., Muller, K. D., Michel R. (1997). Obligate intracellular bacterial parasites of acanthamoebae related to Chlamydia spp. Appl Environ Microbiol 63, 115-121.
- 35. Andersen, A. A. & Van Deusen, R. A. (1988). Production and partial characterization of monoclonal antibodies to four Chlamydia psittaci isolates. Infect Immun 56, 2075-2079.
- 36. Baker, J. A. (1942). A virus obtained from a pneumonia of cats and its possible relation to the cause of atypical pneumonia in man. Science 96, 475-476.
- 37. Black, C. M., Tharpe, J. A. & Russell, H. (1992). Distinguishing Chlamydia species by restriction analysis of the major outer membrane protein gene. Mol Cell Probes 6, 395-400.
- 38. Brown, J. W., Nolan, J. M., Haas, E. S., Rubio, M-A. T., Major, F., Pace, N. (1996). Comparative analysis of ribonuclease P RNA using gene sequences from natural microbial populations reveals tertiary structural elements. Proc Natl Acad Sci 93, 301-3006.
- 39. Brown, J. W. (1998). The Ribonuclease P Database. Nucl Acids Res 26, 351-352.
- 40. Cello, R. M. (1967). Ocular infections with PLT (Bedsonia) group agents. Am J Ophthalmol 63, 1270-1273.
- 41. Chirgwin, K., Roblin, P. M. & Hammerschlag, M. R. (1989). In vitro susceptibilities of Chlamydia pneumoniae (Chlamydia sp. strain TWAR). Antimicrob Agents Chemother 33, 1634-1635.
- 42. Everett, K. D. & Andersen, A. A. (1997). The ribosomal intergenic spacer and domain I of the 23S rRNA gene are phylogenetic markers for Chlamydia spp. Int J Syst Bacteriol, 47, 461-473.
- 43. Everett, K. D. E., Bush R. M. & Andersen, A. A. (1999). Emended description of the order Chlamydiales, proposal of Parachlamydiaceae fam. nov. and Simkaniaceae fam. nov., each containing one monotypic genus, revised taxonomy of the family Chlamydiaceae including a new genus and five new species, and standards for the identification of organisms. Int J Syst Bacteriol 49, 415-440.
- 44. Felsenstein, J. (1993). PHYLIP (Phylogeny inference package) (version 3.51c). Distributed by the author. University of Washington, Seattle, Department of Genetics.
- 45. Francis, T., Jr., & Magill, T. P. (1938). An unidentified virus producing acute meningitis and pneumonia in experimental animals. J Exp Med 68, 147-160.
- 46. Fukushi, H. & Hirai, K. (1989). Genetic diversity of avian and mammalian Chlamydia psittaci strains and relation to host origin. J Bacteriol 171, 2850-2855.
- 47. Golub, O. J. & Wagner, J. C. (1947). Studies on the interference phenomenon with certain members of the psittacosis-lymphogranuloma group of viruses. J Immunol, 59, 59-70.
- 48. Grayston, J. T., Kuo, C.-C., Campbell, L. A. & Wang, S. P. (1989). Chlamydia pneumoniae sp nov for Chlamydia sp strain TWAR. Int J Syst Bacteriol, 39, 88-90.
- 49. Haas, E. S., Brown, J. W., Pitulle, C. & Pace, N. R. (1994). Further perspective on the catalytic core and secondary structure of ribonuclease P RNA. Proc Natl Acad Sci 91, 2527-2531.
- 50. Haas, E. S., Banta, A. B., Harris, J. K., Pace, N. R. & Brown, J. W. (1996). Structure and evolution of ribonuclease P RNA in Gram-positive bacteria. Nucl Acids Res 24, 4775-4782.
- 51. Haas, E. S. & Brown, J. W. (1998). Evolutionary variation in bacterial RNase P RNAs. Nucl Acids Res 26, 4093-4099.
- 52. Hardt, W-D., Schlegl, J., Erdmann, V. A. & Hartmann, R. K. (1995). Kinetics and thermodynamics of the RNase P RNA cleavage reaction: Analysis of tRNA 3′-end variants. J Mol Biol 247, 161-172.
- 53. Hartmann, R. K. & Erdmann, V. A. (1991). Analysis of the gene encoding the RNA subunit of ribonuclease P from T. thermophilus HB8. Nucl Acids Res 19, 5957-5964.
- 54. Illner, V. F. (1960). Zur Frage der Uebertragung des Ornithosevirus durch das Ei. Monatsh Veterinaermed 17, 116-117.
- 55. Jukes, T. & Cantor, C. R. (1969). Evolution of protein molecules. In Mammalian protein metabolism, pp. 21-132. Edited by H. N. Munro, New York: Academic Press.
- 56. Kahane, S., Metzer, E. & Friedman, M. G. (1995). Evidence that the novel microorganism ‘Z’ may belong to a new genus in the family Chlamydiaceae. FEMS Microbiol Lett 126, 203-207.
- 57. Kahane, S., Greenberg, D., Friedman, M. G., Haikin, H., & Dagan, R. (1998). High prevalence of “Simkania Z,” a novel chlamydia-like bacterium, in infants with acute bronchiolitis. J Infect Dis 177, 1425-1429.
- 58. Kaltenboeck, B., Kousoulas, K. G. & Storz, J. (1993). Structures of and allelic diversity and relationships among the major outer membrane protein (ompA) genes of the four chlamydial species. J Bacteriol, 175, 487-502.
- 59. Kirsebom & Svärd (1992). The kinetics and specificity of cleavage by RNase P is mainly dependent on the structure of the amino acid acceptor stem. Nucl Acids Res 20, 425-432.
- 60. Kirsebom, L. A. & Svärd, S. G. (1994). Base pairing between Escherichia coli RNase P RNA and its substrate. EMBO J. 13, 4870-4876.
- 61. Lieberman, D., Kahane, S., Lieberman, D., & Friedman, M. G. (1997). Pneumonia with serological evidence of acute infection with the chlamydia-like microorganism “Z”. Am. J. Respir. Crit. Care. Med. 156, 578-82).
- 62. Massire, C., Jaeger, L. & Westhof, E. (1998). Derivation of the three-dimensional architecture of bacterial ribonuclease P RNAs from comparative sequence analysis. J Mol Biol 279, 773-793.
- 63. McNutt, S. H. & Waller, E. F. (1940). Sporadic bovine encephalomyelitis (Buss disease). Cornell Vet 30, 437-448.
- 64. Murray, E. S. (1964). Guinea pig inclusion conjunctivitis virus. I. Isolation and identification as a member of the psittacosis-lymphogranuloma-trachoma group. J Infect Dis 114, 1-12.
- 65. Nigg, C. (1942). Unidentified virus which produces pneumonia and systemic infection in mice. Science 95, 49-50.
- 66. Page, L. A. (1959). Experimental ornithosis in turkeys. Avian Dis., 3, 51-66.
- 67. Page, L. A. (1967). Comparison of “pathotypes” among Chlamydial (psittacosis) strains recovered from diseased birds and mammals. Bull Wildl Dis Assoc, 2, 166-175.
- 68. Page, L. A. & Bankowski, R. A. (1960). Factors affecting the production and detection of ornithosis antibodies in infected turkeys. Am J Vet Res., 21, 971-978.
- 69. Page, L. A. & Cutlip, R. C. (1968). Chlamydial polyarthritis in Iowa lambs. Iowa Vet 39, 10-18.
- 70. Palys, T., Nakamura, L. K. & Cohan, F. M. (1997). Discovery and classification of ecological diversity in the bacterial world: the role of DNA sequence data. Int J Syst Bacteriol 47, 1145-1156.
- 71. Perez-Martinez, J. A. & Storz, J. (1985). Antigenic diversity of Chlamydia psittaci of mammalian origin determined by microimmunofluorescence. Infect Immun 50, 905-910.
- 72. Pettersson, B., Andersson, A., Leitner, T., Olsvik, O., Uhlén, M., Storey, C., Black, C. M. (1997). Evolutionary relationships among members of the genus Chlamydia based on 16S ribosomal DNA analysis. J Bacteriol 179, 4195-4205.
- 73. Pudjiatmoko, Fukushi, H., Ochiai, Y., Yamaguchi, T. & Hirai, K. (1997). Phylogenetic analysis of the genus Chlamydia based on 16S rRNA gene sequences. Int J Syst Bacteriol 47, 425-431.
- 74. Richmond S. J., Sterling, P., Ashley, C. R. (1982). Virus infecting the reticulate bodies of an avian strain of Chlamydia psittaci. FEMS Microbiol. Letters, 14, 31-36.
- 75. Rogers, D. G., Andersen, A. A., Hogg, A., Nielsen, D. L. & Huebert, M. A. (1993). Conjunctivitis and keratoconjunctivitis associated with chlamydiae in swine. J Am Vet Med Assoc 203, 1321-1323.
- 76. Rodolakis, A., Bernard, F. & Lantier, F. (1989). Mouse models for evaluation of virulence of Chlamydia psittaci isolated from ruminants. Res Vet Sci 46, 34-39.
- 77. Saitou, N. & Nei, M. (1987). The neighbor-joining method: a new method for reconstructing phylogenetic trees. Mol Biol Evol 4, 406-425.
- 78. Schachter, J. & Meyer, K. F. (1969). Lymphogranuloma venereum. II. Characterization of some recently isolated strains. J Bacteriol 99, 636-638.
- 79. Spalatin, J., Fraser, C. E. O., Connell, R. P. & Berman, D. T. (1966). Agents of psittacosis-lymphogranulomavenereum group isolated from muskrats and snowshoe hares in Saskatchewan. Can J Comp Med Vet Sci 30, 225-420.
- 80. Stephens, R. S., Kalman, S., Fenner, C., Davis, R. (1998) Chlamydia Genome Project.
- 81. Stills, H. F. J., Fox, J. G., Paster, B. J. & Dewhirst, F. E. (1991). A “new” Chlamydia sp. strain SFPD isolated from transmissible proliferative ileitis in hamsters. Microbiol. Ecol Health Dis 4, S99.
- 82. Vioque, A. (1997). The RNase P RNA from cyanobacteria: short tandemly repeated repetitive (STRR) sequences are present within the RNase P RNA gene in heterocyst-forming cyanobacteria. Nucl Acids Res 25, 3471-3477.
- 83. Wang, S.-P. & Grayston, J. T. (1962). Classification of trachoma virus strains by protection of mice from toxic death. J Immunol 90, 849-856.
- 84. Wills, J. M., Gruffydd-Jones, T. J., Jones T, Richmond, S., Paul, I. D. (1984). Isolation of Chlamydia psittaci from cases of conjunctivitis in a colony of cats. Vet Rec 114, 344-346.
- 85. Zhang, Y. X., Fox, J. G., Ho, Y., Zhang, L., Stills, H. J. & Smith, T. F. (1993). Comparison of the major outer-membrane protein (MOMP) gene of mouse pneumonitis (MoPn) and hamster SFPD strains of Chlamydia trachomatis with other Chlamydia strains. Mol Biol Evol 10, 1327-42.
Claims
1. A method for detection of a pathogenic organism, comprising analyzing a P3 and/or P19 hypervariable region of an RNase P RNA gene.
2. The method according to claim 1, wherein the pathogenic organism is mycobacteria or chlamydia.
3. The method according to claim 1, wherein said analyzing comprises amplifying nucleic acid corresponding to the P3 and/or P19 hypervariable region.
4. The method according to claim 3, wherein said analyzing further comprises sequencing the nucleic acid for species identification.
5. The method according to claims 3, wherein said analyzing further comprises fingerprinting the nucleic acid for species identification.
6. The method according to claim 5, wherein the nucleic acid is fingerprinted by a technique selected from the group consisting of Restriction Fragment Length Polymorphism (RFLP), heteroduplex analysis, size determination, melting point determination and combinations thereof.
7. The method according to claim 3, wherein the pathogenic organism is chlamydia and primers used for amplification are JB1 (SEQ ID NO: 7) and JB2 (SEQ ID NO: 8).
8. A method for detection of a pathogenic organism, comprising amplifying nucleic acids of at least one hypervariable region of the RNase P RNA gene from the pathogenic organism; forming a heteroduplex with related nucleic acid; and analyzing thereof.
9. The method according to claim 8, wherein the hypervariable region is P3 and/or P19.
10. The method according to claim 8, wherein the pathogenic organism is mycobacteria or chlamydia.
11. The method according to claim 10, wherein the pathogenic organism is chlamydia and primers used for amplification are JB1 (SEQ ID NO: 7) and JB2 (SEQ ID NO: 8).
12. A method of treating a microbial infection comprising administering an effective amount of a medicament that targets the P3 and/or P19 variable region in the RNAse P RNA gene.
Images & Drawings included:


Sources:
- United States Patent and Trademark Office - verify current appl. status at the USPTO↗
Similar patent applications:
Recent applications in this class:
- » 20250163523 2025-05-22
METHODS FOR DETECTING BACTERIAL NUCLEIC ACID - » 20250163522 2025-05-22
METHODS FOR PRESERVING HEALTHY INTESTINAL MICROBIOME DURING GROWTH PROMOTER ADMINSTRATION - » 20250163521 2025-05-22
PRIMER SET, REAGENT COMPOSITION AND METHOD FOR THE DETECTION OF NEISSERIA MENINGITIDIS - » 20250154609 2025-05-15
IMPROVED METHODS AND DEVICES FOR ACCURATE DIAGNOSIS OF INFECTIONS - » 20250154608 2025-05-15
SYSTEM AND METHODS FOR EARLY DETECTION OF VIABLE MICROORGANISMS - » 20250154607 2025-05-15
ISOTHERMAL AMPLIFICATION OF PATHOGENS - » 20250146087 2025-05-08
TUMOR MICROBIOME ANALYSIS AS A PROGNOSTIC INDICATOR OF PROSTATE CANCER - » 20250137074 2025-05-01
ADDITIVE FOR PCR AMPLIFICATION, MULTIPLEX PCR AMPLIFICATION KIT, AND USE THEREOF - » 20250137073 2025-05-01
DIAGNOSTIC METHODS AND MARKERS FOR BACTERIAL VAGINOSIS - » 20250129437 2025-04-24
ANALYSIS OF MICROBIAL DNA FOR DISEASE CLASSIFICATION