Mathematical musical orchestral method for predicting classes of patients for medical treatment
US20160055309A1
2016-02-25
14/774,177
2014-03-14
✅ Patent granted
US 10,114,929 B2
2018-10-30
WO; PCT/US2014/026982; 20140314
WO; WO2014/152129; 20140925
Joseph D Burgess
Licata & Tyrrell P.C.
2034-12-27
Abstract:
Methods for classifying patients as responders or non-responders to treatment of a disease and predicting recurrence of disease in a patient using audio tunes are provided.
Assignee:
- RUTGERS, THE STATE UNIVERSITY OF NEW JERSEY 1,185 🇺🇸 New Brunswick, NJ, United States
Applicant:
Interested in similar patents?
Get notified when new applications in this technology area are published.
Classification:
C12Q1/68 IPC
Measuring or testing processes involving enzymes, nucleic acids or microorganisms ; Compositions therefor; Processes of preparing such compositions involving nucleic acids
C12Q1/6886 » CPC further
Measuring or testing processes involving enzymes, nucleic acids or microorganisms ; Compositions therefor; Processes of preparing such compositions involving nucleic acids; Nucleic acid products used in the analysis of nucleic acids, e.g. primers or probes for diseases caused by alterations of genetic material for cancer
G01N33/57423 » CPC further
Investigating or analysing materials by specific methods not covered by groups -; Biological material, e.g. blood, urine ; Haemocytometers; Chemical analysis of biological material, e.g. blood, urine; Testing involving biospecific ligand binding methods; Immunological testing; Immunoassay; Biospecific binding assay; Materials therefor for cancer; Specifically defined cancers of lung
G01N33/6893 » CPC further
Investigating or analysing materials by specific methods not covered by groups -; Biological material, e.g. blood, urine ; Haemocytometers; Chemical analysis of biological material, e.g. blood, urine; Testing involving biospecific ligand binding methods; Immunological testing involving proteins, peptides or amino acids related to diseases not provided for elsewhere
G06F3/165 » CPC further
Input arrangements for transferring data to be processed into a form capable of being handled by the computer; Output arrangements for transferring data from processing unit to output unit, e.g. interface arrangements; Sound input; Sound output Management of the audio stream, e.g. setting of volume, audio stream path
G16H50/30 » CPC further
ICT specially adapted for medical diagnosis, medical simulation or medical data mining; ICT specially adapted for detecting, monitoring or modelling epidemics or pandemics for calculating health indices; for individual health risk assessment
C12Q2600/112 » CPC further
Oligonucleotides characterized by their use Disease subtyping, staging or classification
G01N2800/52 » CPC further
Detection or diagnosis of diseases Predicting or monitoring the response to treatment, e.g. for selection of therapy based on assay results in personalised medicine; Prognosis
G01N33/574 IPC
Investigating or analysing materials by specific methods not covered by groups -; Biological material, e.g. blood, urine ; Haemocytometers; Chemical analysis of biological material, e.g. blood, urine; Testing involving biospecific ligand binding methods; Immunological testing; Immunoassay; Biospecific binding assay; Materials therefor for cancer
G01N33/68 IPC
Investigating or analysing materials by specific methods not covered by groups -; Biological material, e.g. blood, urine ; Haemocytometers; Chemical analysis of biological material, e.g. blood, urine; Testing involving biospecific ligand binding methods; Immunological testing involving proteins, peptides or amino acids
A61B10/02 » CPC further
Other methods or instruments for diagnosis, e.g. instruments for taking a cell sample, for biopsy, for vaccination diagnosis ; Sex determination; Ovulation-period determination ; Throat striking implements Instruments for taking cell samples or for biopsy
C12Q1/6883 » CPC further
Measuring or testing processes involving enzymes, nucleic acids or microorganisms ; Compositions therefor; Processes of preparing such compositions involving nucleic acids; Nucleic acid products used in the analysis of nucleic acids, e.g. primers or probes for diseases caused by alterations of genetic material
G06F3/16 IPC
Input arrangements for transferring data to be processed into a form capable of being handled by the computer; Output arrangements for transferring data from processing unit to output unit, e.g. interface arrangements Sound input; Sound output
Description
This patent application claims the benefit of priority from U.S. Provisional Application Ser. No. 61/782,033 filed Mar. 14, 2013, the content of which is hereby incorporated by reference in its entirety.
FIELD OF THE INVENTION
The present invention relates to a novel method of predicting classes of patients for medical treatment.
BACKGROUND OF THE INVENTION
Gene expression analysis provides the foundation for studying thousands of individual alterations in gene function. These alterations in mRNA expression can be viewed as biomarkers. Whole genome gene expression assays are routinely used to predict treatment responses in human diseases (Xiang et al. Curr Opin Drug Discov Devel. 2003; 6:384-95; and Lee J. S. and Thorgeirsso, S. S. Gastroenterology 2004; 127:S51-55). A major limitation with the gene expression data analysis methods is the low prediction accuracy with small sample size (Roepman P. Bioanalysis 2010; 2:249-62). Studies have indicated that the prediction accuracy can be increased by increasing the sample size. For example, Ein-Dor et al. reported that ˜3000 samples are needed to get good prediction accuracy necessary for the clinical applications in lung cancer (Proc Natl Acad Sci USA 2006; 103:5923-5928). It has also been proposed that gene expression data can be supplemented with copy number variation and Single Nucleotide Polymorphism (SNP) information to obtain the accuracy required for class prediction (Kalia M. Metabolism 2013; 62:S11-14). Using more than one technique, however, will increase the cost of the test and also the complexity associated with the present data analysis methods.
Currently, a supervised clustering method is used to analyze microarray data to classify a patient for treatment response (Speed, T. (Ed.) 2003 Statistical analysis of gene expression microarray data. Chapman and Hall/CRC, NewYork).
The goal of these approaches is to relate gene expression to different target classes and to use this new information to produce a prediction model. Often, this approach is called pattern recognition. There are many different algorithms, such as linear predictors, neural nets, etc. These are very powerful tools, but each has its own advantages and disadvantages. One would need to know how to select the right method, structure, and definition for a given problem. This approach may not provide accurate results to take clinical decision. For example, a prediction model developed by Gordon et al. could reach only 74% predicting accuracy with ˜400 samples; a good outcome but not excellent result (Gordon et al. Can Epidemiol Biomarkers Prey 2003; 12: 905-910).
Musical algorithms have been widely used to compose tunes for entertainment purposes. There is a limited usage in medical musical therapy applications (Carr et al. PLoS One 2013; 8:e70252).
SUMMARY OF THE INVENTION
The present invention relates to a method of using a mathematical musical orchestral algorithm, referred to herein as MMOA, to predict response of a patient suffering from a disease to a selected treatment for the disease. As demonstrated herein, this novel MMOA is suitable for small sample size with high prediction accuracy.
Accordingly, an aspect of the present invention relates to a method of classifying a patient suffering from a disease as a responder or a non-responder to a selected treatment for the disease.
In one embodiment, the disease is cancer.
In one embodiment, the disease is lung cancer.
This method comprises first analyzing a tissue sample from the patient with a microarray. The data set generated from the microarray is then filtered using a standard microarray data analysis method and an audio tune and/or sound frequency pattern capturing the filtered data from the microarray is then established via the MMOA. The patient is then classified as a non-responder or responder to the selected treatment based upon the assigned audio tune and/or sound frequency pattern being similar to an audio tune and/or sound frequency pattern already previously identified for known responders or known non-responders.
In one embodiment of the present invention, the MMOA is manually operated.
In another embodiment, a web based program converted from the manually operated MMOA and referred to as sound frequency pattern generation and recognition algorithm or SFPGRA is used.
The classification method of the present invention is also useful in predicting recurrence of a disease such as cancer in a patient.
Unless otherwise defined, all technical and scientific terms used herein have the same meaning as commonly understood by one of ordinary skill in the art to which this invention belongs. Although methods and materials similar or equivalent to those described herein can be used in the methods and materials are described herein. All publications, patent applications, patents and other references mentioned herein are incorporated by reference in their entirety. In the case of conflict, the present specification, including definitions, will control. In addition, the materials, methods and examples are illustrative only and are not intended to be limiting.
Other features and advantages of the invention will be apparent from the detailed description, and from the claims.
BRIEF DESCRIPTION OF THE FIGURES
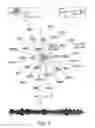
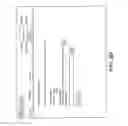
FIG. 1 provides a schematic of the mathematical musical orchestral algorithm protocol used in the method of the present invention for class prediction. In this embodiment of the present invention, mRNA molecules are considered as the vibrating macromolecules and their vibrations/sound frequency patterns (SFPs) are indirectly estimated from a microarray based gene expression analysis. The fluorescent intensity values obtained from DNA microarrays were converted to musical notes/sound frequencies, and the notes were used to compose class specific tunes/SFPs. Patients suffering from cancer are classified into responder or non-responder based on the tunes/SFPs.
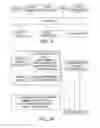
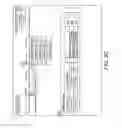
FIG. 2 provides a flow diagram of the steps involved in the development of the class prediction model of the present invention. The model was trained and tested with retrospective clinical samples. The model was built with non-responders and responders training data set and fine-tuned with known test data sets. A double blind test was conducted to test and validate the prediction accuracy of the model.
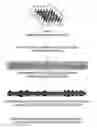
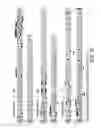
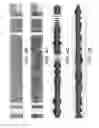
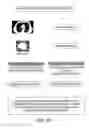
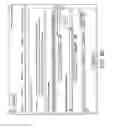
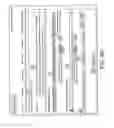
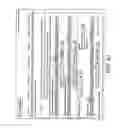
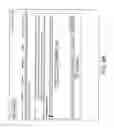
FIGS. 3A through 3F are musical compositions prepared by SFP generation. Normalized gene expression intensity of top 50 biomarkers was converted into musical notes/sound frequencies. A coherent music/SFP specific to each group (FIG. 3A) and patient (FIGS. 3B and 3C) were composed/generated to train the model. Eight data sets were treated as the “unknowns” and the tunes/SFPs were used to validate the model (FIGS. 3D-3F). A double blind test was conducted to test and validate the prediction accuracy of the model. FIG. 3A is an example of a Reference/Theme/Framework tune/SFP specific to non-responders and responders patients composed/generated using non-responders/responders mean value. The tunes/SFPs were used as the reference tunes/SFPs to compose/generate known tunes/SFPs (training set). FIG. 3B shows examples of known non-responder (training set) tunes/SFPs. Three non-responder tunes/SFPs were composed/generated and used as the training set. FIG. 3C shows examples of known responder (training set) tunes/SFPs. Three responder tunes/SFPs were composed/generated and used as the training set. FIGS. 3D-3F show examples of unknown (test set) tunes. Eight tunes/SFPs (4R and 4NR) were composed/generated to validate the MMOA.
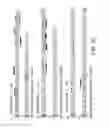
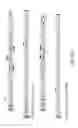
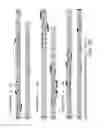
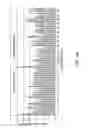
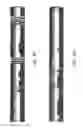
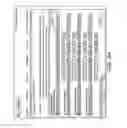
FIGS. 4A through 4G show class specific sound frequency pattern generation and recognition (SFPGR). Steps involved in sound frequency pattern generation and recognition are shown with sample data sets obtained from two unknown patients. Unknown 1 data were obtained from responder patient 8 and Unknown 2 data were obtained from non-responder patient 5. FIG. 4A shows the random distribution of microarray signal intensities/numbers. Randomness was observed in the distribution of signal intensities of the top 50 biomarkers obtained by the conventional microarray data analysis. FIGS. 4B and 4C show random distribution of sound frequencies observed in unknown patient 1 data obtained from responder patient 8 and unknown patient 2 data obtained from non-responder patient 5, respectively. Only one patient in each group is shown as an example. Randomness was also observed in the distribution of signal intensities of the top 50 biomarkers after we converted the signal intensities into sound frequencies. FIGS. 4D and 4E show class specific sound frequency patterns of unknown patient 1 data obtained from responder patient 8 and unknown patient 2 data obtained from non-responder patient 5, respectively. A unique sound frequency pattern (SFP) specific to each class was generated after the class specific tunes with the top 50 biomarkers were composed. These patterns were stored in a data base and compared with the SFPs of unknowns to assist in making clinical decisions with respect to a patient. FIGS. 4F and 4G are spectrograms converted from the sound frequency patterns from unknown patient 1 data obtained from responder patient 8 and unknown patient 2 data obtained from non-responder patient 5, respectively, which are useful for further pattern recognition purposes.
FIG. 5 is a schematic of a deconvolution program. As shown, the musical notes/sound frequencies can be readily converted to gene symbol/ID and intensity information and linked to public databases and/or pathway analysis tools.
FIG. 6 shows an overview of an embodiment of a data base structure for the present invention. In this embodiment, the data base comprises deidentified patients' clinical information, tissue specification, sample (RNA/DNA) details, microarray data, composed tunes, reference SFPs, and known and unknown SFPs.
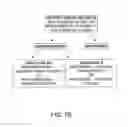
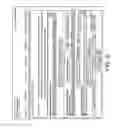
FIGS. 7A through 7C show class prediction and data integration capabilities of MMOA. Flow charts showing the steps involved in the MMOA to discriminate the major classes and sub-classes for personalized medicine applications are depicted in FIGS. 7A and 7B, respectively. In FIG. 7A class prediction was done with top 50 biomarkers specific for surgical treatment response (one parameter). FIG. 7B shows use of the algorithm in subclass predictions such as chemotherapy response or radiotherapy or targeted therapy response in non-responder patients who are eligible for adjuvant chemotherapy or radio or targeted therapy. FIG. 7C shows use of MMOA in the integration of gene expression data with 3-dimensional voxel intensity obtained from computed tomography (CT) scan image data to discriminate malignant nodules from benign nodules in patients at high risk for lung cancer.
FIG. 8 provides an example of final data output from this method. As shown, clinical decision information can be obtained from a first level of the program. Gene list and the pathway information can be obtained from the next level. The details about SFPs are available in the third level. The raw data obtained from the entire gene expression/microarray data can be found in the last level.
FIGS. 9A through 9L provide an example of the wire frames used to develop the web-based sound frequency pattern generation and recognition algorithm (SFPGRA). Tables A through K in Example 1 further describe the numbered elements and type as well as additional notations for the wireframes depicted in FIGS. 9A-9L.
DETAILED DESCRIPTION OF INVENTION AND EMBODIMENTS
Musical algorithms are used widely to compose tunes for entertainment purposes. Usage in medical musical therapy applications has been quite limited.
Since conventional machine learning algorithms cannot achieve the prediction accuracy required in a clinical setting for classifying patients suffering from a disease as responders or non-responders to a selected treatment, in the present invention a mathematical musical orchestral algorithm, referred to herein as MMOA, was integrated into the machine learning process. The MMOA is capable of handling complete gene expression data obtained from whole human genome microarray comprised of ˜30,000 human genes. It can be used to analyze more than one clinical parameter such as stage, age, gender and smoking history etc. for class/sub-class predication purposes. It can be also used to predict responses such as, but not limited to, chemotherapy or radiology or targeted therapy response in patients suffering from late stage cancers.
The MMOA can be used for sub-class identification as well. For example, in the first step it can be used to discriminate non-responder from responder after, for example, a surgical treatment. The same algorithm can be used to prediction adjuvant chemotherapy response or radiotherapy or targeted therapy response in non-responder patients who are eligible for adjuvant chemotherapy or radio or targeted therapy.
As shown herein, the combination of mathematical machine learning and MMOA can greatly improve the prediction accuracy of the treatment response in patients suffering from cancer.
In the method of the present invention, a patient suffering from a disease is classified as a responder or a non-responder to a selected treatment for the disease by analyzing a sample from the patient using an RNA, DNA or protein microarray. In one embodiment, if the patient is suffering from cancer, the tumor or a portion thereof is excised from the patient for analysis. Core needle biopsy samples, fine needle aspirations as well as fresh, frozen and formalin-fixed paraffin-embedded tissues samples may also be used.
The data set generated from the microarray is then filtered. An audio tune and/or sound frequency pattern capturing the filtered data from the microarray is then assigned to the patient and the patient is classified as a responder or a non-responder to a selected treatment for the disease based upon the assigned audio tune and/or sound frequency pattern.
The method of the present invention was tested using a Non-Small Cell Lung Cancer (NSCLC) model. At present most of the Stage Ia NSCLC patients are not treated with adjuvant chemotherapy (Qi-Zhu et al. J Clin Onco 2010; 28: 4417-4424). Early identification of stage Ia patients likely to recur following surgery will allow the physician to target adjuvant chemotherapy to those patients for whom it is necessary. In stage Ib diseases, most of the patients are treated with adjuvant chemotherapy. However, a subgroup of patients do not recur and hence might not require adjuvant chemotherapy. In stage Ib patients, physician can avoid adjuvant chemotherapy to those who do not require it. Conventional detection and follow-up methods based on the clinical staging and clinic-pathological findings are insufficient to predict recurrence (Sriram et al. Respirology 2011; 16: 257-263).
In the present invention, the MMOA was used to convert mRNA signal intensities into musical notes/sound frequencies and class specific tunes/SFPs were composed/generated with the harmonized musical notes/SFPs. By listening and observing the class specific tunes/SFPs, one can discriminate the responders from non-responders of surgical treatment in these NSCLC patients.
While tests were performed on lung cancer patients, as will be understood by the skilled artisan upon reading this disclosure, the method of the present invention provides a simple, sensitive and cost-effective method which can be routinely used in any kind of human disease.
It is important to note that present gene expression data analysis methods considered mRNAs as the inert molecules and use their concentration information (signal intensity) to predict treatment response. In contrast, the present invention considers mRNAs as the vibrating molecules, and uses their macromolecular vibrations/SFPs extracted (from their signal intensity values) for class prediction.
Accordingly, the method of the present invention utilizes what is believed to be the first gene expression algorithm that involves two human senses (i.e. visual and listening) to predict treatment response in human disease. This is believed to also be the first medical laboratory test that uses two human senses for diagnostics applications.
Since the MMOA predictions are based on the tunes/SFPs, it can be effectively used to predict mRNA extracted from Formalin Fixed Paraffin Embedded (FFPE) samples. Even in the absence of some biomarkers, the tunes/SFPs obtained from the remaining expressed genes can be used to identify the clinical outcome of the patient.
The preferred methods and materials are described below in examples which are meant to illustrate, not limit, the invention. Skilled artisans will recognize methods and materials that are similar or equivalent to those described herein, and that can be used in the practice or testing of the present invention.
EXAMPLES
Example 1
Experiments
Conventional gene expression data analysis program uses the concentration/signal intensity information of mRNA to identify the differentially expressed genes for class prediction (Wong et al. Bioinformatics 2007; 23:998-1005). In the present invention, an algorithm referred to herein as MMOA was used to convert the signal intensities (numbers) into macromolecular vibrations/sound frequency patterns (SFPs). Class specific tunes/SFPs were composed/generated using coherent music/SFPs. The class specific tune/SFP was used to predict the clinical outcome of unknown patients. The principle of MMOA is shown in FIG. 1. The MMOA was tested and validated using samples obtained from NSCLC patients and showed that this application is central to personalized onco-medicine. The functionality specifications of the class prediction model are shown in FIG. 2.
Comparison with Conventional Microarray Data Analysis
Initially, a conventional microarray data analysis method was used to find out its prediction accuracy. The prediction accuracy of the conventional microarray data analysis was then compared with the MMOA.
Based on the clinical information, patients were classified as a Responder (R) if no recurrence was detected within 5 years after surgery. Otherwise, the patient was considered a Non-responder (NR). Twenty three non-responders and 13 responders were used to build and test the model, and 8 samples were treated as the “unknowns”. Total RNA was amplified and hybridized onto human whole genome microarrays (Affymetrix HGU-133 Plus 2.0). The microarray data was normalized using Robust Multi-array Average (RMA) procedure on Affymetrix GeneChip Operating Software (GCOS). For further analysis, the data was filtered and the probes that do not change were removed from the analysis.
Standard clustering procedures (e.g. hierarchical or sammon map) did not group the samples according to their status of responders or non-responders. Also, according to the limma analysis there were no differentially expressed genes between responders and non-responders group. This indicated that the differences between the two groups is more subtle and has to be addressed using more sophisticated and sensitive analysis. Analysis was performed in R statistical language using standard Bioconductor packages and custom-written code (see http: with the extension //bioconductor.org/ of the world wide web).
The classification model was learned on filtered data from responders (R) and non-responders (NR) using penalized regression procedure. The resulting classifier has a leave one out cross-validation accuracy of 0.89. In other words, the error of misclassification in training data is 0.11 implying that 9 out of 10 patients/samples are predicted correctly.
A confusion matrix of the classifier is given by the following:
| True |
| Object | NR | R | |
| NR | 22 | 3 | |
| R | 1 | 10 | |
One out of 23 non-responders (NR) 1 was incorrectly predicted, and 3 out of 13 responders (R) were incorrectly classified in a leave-one-out cross-validation procedure.
Classifier built on the training dataset was applied to predict the clinical outcome of the 8 unknown patients.
Mathematical Musical Orchestral Algorithm (MMOA)
A conversion rule was formulated to decipher the numbers (gene expression data/signal intensities) into musical notes/sound frequencies (see Table 1). After converting the numbers into pitches with rhythms, the notes were looked as a whole group. A pattern generation algorithm was created to generate sound frequency patterns (SFPs) ex: a string of eight notes from G to E or recurring notes ex: a lot of G or F. A key/tonal center i.e. G major and F minor respectively were selected to compose the music/generate SFPs. A coherent piece of music/SFP was composed/generated by observing and listening to the music. A reference/theme/framework tune or reference SFP was composed/generated using the NR and R mean values (see FIG. 3A). Known NR and R tunes/SFPs were composed/generated to fine tune the reference SFPs to train the model (FIGS. 3B and 3C). The tunes/SFPs were finalized by listening and observing to the composition/patterns, and fine tuned to match with the reference SFP/theme music by adjusting the location of the note or tempo etc. Microarray data from 8 patients were considered as the “unknown” test data set. A double blind test was performed to identify clinical outcome of 8 unknowns after fine tuned the model (FIGS. 3D-F). Steps involved in sound frequency pattern generation and recognition are shown with sample data set obtained from two unknown patients (unknown 1/responder patient 8 and unknown 2/non-responder patient 5) (see FIGS. 4A-4G). The tunes/SFPs are readily converted back to signal intensity and gene symbol/ID using a deconvolution program and can be linked to other public data bases (FIG. 5). A data base was created with reference and known SFPs and were compared with unknown SFPs for class prediction (see FIG. 6). The MMOA is a very versatile program and can handle more than one clinical parameter to classify a patient (see FIG. 7A). The application of MMOA to discriminate sub-classes for personalized medicine is shown in FIG. 7B. In addition MMOA can be used to integrate data obtained from two or more technologies. An example of an integration approach for radiogenomic application is shown in FIG. 7C. Final data structure obtained from MMOA is shown in FIG. 8. Clinical decision (responder or non-responder) can be obtained from the first level. Gene list, signal intensity and pathway information can be obtained from the second level. The details about SFPs are available in the third level. The raw data obtained from all the genes can be found in the last level. The manually operated MMOA program was converted into cloud/web based computer program which was named Sound Frequency Pattern Generation and Recognition Algorithm (SFPGRA). The wire frames used for the SFPGRA are shown in FIGS. 9A-9L. Tables A through K below further describe the numbered elements and type as well as additional notations for the wireframes depicted in FIGS. 9A-9L.
| TABLE A |
| Corresponds to the Wireframe of FIG. 9A |
| Title | Home | |
| Version | 1.0 |
| Note: | |
| No. | Element | Type | Description | ||
| 1 | Forgot? | Link | Redirect the user to | ||
| forgot username page | |||||
| 2 | Forgot? | Link | Redirect the user to | ||
| forgot password page | |||||
| 3 | Login | Button | Authenticate the user's | ||
| credentials | |||||
| TABLE B |
| Corresponds to the Wireframe of FIG. 9B |
| Title | Home |
| Version | 1.0 |
| Note: |
| No. | Element | Type | Description |
| 1 | Username | Text | From database |
| 2 | Secret | Text | From database |
| question | |||
| 3 | Secret | Input box | User will enter the secret |
| answer | answer to their question. | ||
| Secret question will be | |||
| asked only when user logs | |||
| in and the cookie dropped | |||
| during the last visit is | |||
| not found. | |||
| TABLE C |
| Corresponds to the Wireframe of FIG. 9C |
| Title | Compose home page |
| Version | 1.0 |
| Note: This page is available to users with composer role. |
| No. | Element | Type | Description |
| 1 | Welcome | Text | Compose username will have |
| username | an option of dropdown list | ||
| 2 | Dropdown | Dropdown | From Settings user can |
| list | list | change username, password | |
| and email address | |||
| 3 | Link | Link | This is landing page for |
| composer | |||
| 4 | Dropdown | Dropdown | On the rollover of My |
| list | list | Tunes options list will | |
| come. | |||
| 5 | Data grid | Data grid | List of Reference tunes. |
| 6 | Select | Dropdown | This will list the version |
| Data | list | of data set uploaded | |
| version | A data set is a collection | ||
| 3 files uploaded by the | |||
| admin or site user. These | |||
| three files are “mean NR | |||
| and R”, known NR and R” | |||
| and “Unknowns” | |||
| Changing the value from | |||
| the list will load the | |||
| data from selected data | |||
| set. | |||
| TABLE D |
| Corresponds to the Wireframe of FIG. 9D |
| Title | Composer Reference |
| Non-Responder | |
| OncoTune | |
| Version | 1.0 |
| Note: Composer will compose the Reference Non-Responder |
| OncoTune. The Reference Non-Responder OncoTune will be |
| used in class prediction. |
| No. | Element | Type | Description |
| 1 | Last | Text/ | Date on which this version |
| updated | Date time | was last updated. This | |
| value gets updated when | |||
| composer clicks Save this | |||
| version button. | |||
| 2 | Comments | Text | Comments about tune |
| 3 | Mean NR | Staff | Notes generated from the |
| notes | Mean NR data uploaded. | ||
| Using these notes composer | |||
| will create reference NR | |||
| tune. | |||
| 4 | Player | Music player | Play the notes from Mean |
| NR notes | |||
| 5 | Reference | Staff | On this staff composer |
| NR | will create new music by | ||
| OncoTune | Double clicking to copy | ||
| the note. | |||
| Deleting notes from | |||
| Tunes. | |||
| 6 | Copy all | Button | Copy all notes from Mean |
| Notes from | NR to Ref NR OncoTune. | ||
| Mean NR to | |||
| NR Tune | |||
| 7 | Clear NR | Button | Clear Ref NR OncoTune |
| Tune | staff | ||
| 8 | Bin | Image | Select a note and click |
| bin delete it. | |||
| 9 | Save | Button | Saves the Reference NR |
| Changes | Tune | ||
| TABLE E |
| Corresponds to the Wireframe of FIG. 9E |
| Title | Composer Reference |
| Non-Responder | |
| OncoTune | |
| Version | 1.0 |
| Note: |
| No. | Element | Type | Description |
| 10 | Plays | Player | Plays all the tunes on the |
| Together | page | ||
| 11 | Check to | Checkbox | When checked the |
| apply | composition rules will be | ||
| composition | applied and notes will be | ||
| rules | highlighted. When | ||
| unchecked composition | |||
| rules will be removed and | |||
| notes will come in | |||
| normal/default colors. | |||
| 12 | Check to | Checkbox | When checked and composer |
| track the | rollovers mouse cursor on | ||
| gene | a notes it will show a | ||
| popup at the mouse | |||
| position with Gene | |||
| information. When | |||
| unchecked this feature | |||
| will be turned off. | |||
| TABLE F |
| Corresponds to the Wireframe of FIG. 9F |
| Title | Composer Reference |
| Responder OncoTune | |
| Version | 1.0 |
| Note: Composer will compose the Reference Responder |
| OncoTune. The Reference Responder OncoTune will be used in |
| class prediction. |
| No. | Element | Type | Description |
| 1 | Last | Text/ | Date on which this version |
| updated | Date time | was last updated. This | |
| value gets updated when | |||
| composer clicks Save this | |||
| version button. | |||
| 2 | Comments | Text | Comments about tune |
| 3 | Mean R | Staff | Notes generated from the |
| notes | Mean R data uploaded. | ||
| Using these notes composer | |||
| will create reference R | |||
| tune. | |||
| 4 | Player | Music player | Play the notes from Mean R |
| notes | |||
| 5 | Reference | Staff | On this staff composer |
| R OncoTune | will create new music by | ||
| Double clicking to copy | |||
| the note. | |||
| Deleting notes from | |||
| Tunes. | |||
| 6 | Copy all | Button | Copy all notes from Mean R |
| Notes from | to Ref R OncoTune. | ||
| Mean R to | |||
| R Tune | |||
| 7 | Clear R | Button | Clear Ref R OncoTune staff |
| Tune | |||
| 8 | Save | Button | Saves the Reference R Tune |
| Changes | |||
| TABLE G |
| Corresponds to the Wireframe of FIG. 9G |
| Title | Compose Known NR tune |
| from NR Reference tune | |
| Version | 1.0 |
| Note: |
| On this page composer will compose known NR tunes from |
| Reference Non-Responder OncoTune |
| Composer can change either of the four tunes on this |
| page. |
| Composer can select known NR from the dropdown list 1 |
| No. | Element | Type | Description |
| 1 | Known NR | Dropdown | List of all known NR. By |
| list | list | default first items will | |
| be selected | |||
| 2 | Ref NR | Staff | Ref NR notes. This is read |
| notes | only. | ||
| 3 | Known NR | Staff | Known NR notes. These are |
| for the known NR selected | |||
| from the dropdown list 1 | |||
| 4 | Compose | Staff | Initially this will be |
| Known NR | blank. Composer will | ||
| create a new tune from | |||
| known NR here. | |||
| 5 | Save | Button | Save changes |
| Changes | |||
| 6 | Show All | Button | Open or Pop up a new |
| Known Non- | screen that will list all | ||
| Responders | the Known Non-Responders | ||
| TABLE H |
| Corresponds to the Wireframe of FIG. 9H |
| Title | Known NR or R list |
| Version | 1.0 |
| Note: | ||
| No. | Element | Type | Description |
| 1 | Close | Button | This will take the user |
| back to the previous | |||
| screen, which are Know | |||
| Non-Responder or Known | |||
| Responder | |||
| 2 | Pagination | Pagination | Pagination will come only |
| where there are more than | |||
| 10 Known Non-Responders | |||
| TABLE I |
| Corresponds to the Wireframe of FIG. 9I |
| Title | Compose Known R tune from |
| R Reference tune | |
| Version | 1.0 |
| Note: |
| On this page composer will compose known R tunes from |
| Reference Responder OncoTune |
| Composer can compose one known R tune at a time. |
| Composer can select known R from the dropdown list 1 |
| No. | Element | Type | Description |
| 1 | Known R | Dropdown | List of all known R. By |
| list | list | default first items will | |
| be selected | |||
| 2 | Ref R | Staff | Ref R notes. This is read |
| notes | only. | ||
| 3 | Known R | Staff | Known R notes. These are |
| for the known R selected | |||
| from the dropdown list 1 | |||
| 4 | Compose | Staff | Initially this will be |
| Known R | blank. Composer will | ||
| create a new tune from | |||
| known R here. | |||
| 5 | Save | Button | Save changes |
| Changes | |||
| TABLE J |
| Corresponds to the Wireframes of FIG. 9J and 9K |
| Title | Class prediction of |
| Unknown patients | |
| Version | 1.0 |
| Note: |
| On this page composer will predict the unknown patients |
| based on Reference tunes. |
| No. | Element | Type | Description |
| 1 | Unknowns | Dropdown | List of all Unknown |
| list | biomarkers | ||
| Change the value will load | |||
| that biomarkers in 5 | |||
| 2 | Result | Radio | This will a three values |
| buttons | Not know yet | ||
| Non-Responder | |||
| Responder | |||
| 3 | Reference | Staff | Reference Non-Responder |
| Non- | tune | ||
| Responder | |||
| 4 | Reference | Staff | Reference Responder tune |
| Responder | |||
| 5 | Unknown | Staff | Unknown notes that |
| composer will compose to | |||
| match either with | |||
| Reference Non-Responder or | |||
| Reference -Responder tunes | |||
| 6 | Save | Button | Save changes |
| Changes | |||
| TABLE K |
| Corresponds to the Wireframe of FIG. 9L |
| Title | Tracking |
| Version | 1.0 |
| Note: This page will track the changes made to the |
| uploaded data |
| No. | Element | Type | Description |
| 1 | Tracking | Data grid | List the original |
| biomarkers and changes | |||
| made to them to create a | |||
| tune | |||
| 2 | Select | Dropdown | List of all the unknowns |
| Unknown | list | and All option to list all | |
| the unknowns | |||
Example 2
Methods
In step 1, a conversion rule was formulated to decipher the numbers (gene expression data) into musical notes/sound frequencies (see Table 1 below).
| TABLE 1 |
| The conversion rule used for the transfer of gene expression data |
| (log 2 signal intensity) in to sound frequencies/musical notes. |
| Intensity value | Intensity value | ||
| (whole number) | Note | (Decimal) | Rhythm |
| 1 | Tonic | 0 | Sixteenth |
| 2 | Supertonic | 1 | Sixteenth |
| 3 | Mediant | 2 | Sixteenth |
| 4 | Subdominant | 3 | Eight |
| 5 | Dominant | 4 | Eight |
| 6 | Sudmediant | 5 | Quarter |
| 7 | Leading Tone | 6 | Quarter |
| 8 | Tonic{acute over ( )} | 7 | Half |
| 9 | Supertonic{acute over ( )} | 8 | Half |
| 10 | Mediant{acute over ( )} | 9 | Whole |
| 11 | Subdominant{acute over ( )} | ||
| 12 | Dominant{acute over ( )} | ||
| Other: Sharps (#) and Flats (b) as well as rests may be at Composer's discretion |
In step 2, after converting the numbers into pitches with rhythms, the notes were looked at as a whole group.
In step 3, a composition/pattern generation algorithm was created to generate SFPs with the notes/sound frequencies and the rules for composition as follows:
-
- a) Conversion vertical data into horizontal format.
- b) Search a set of data for any patterns (ex: 5.4, 6.4, 7.4, 6.4) that are apparent without changing the order of the set.
- c) Search for any outliers and mark them to not be used in composition.
- d) Figure out which number(s) occur most often and use that number/note as a tonic or a reciting tone.
- e) With the tonic note in mind, use any patterns discovered in #2 to create small sets of pitch orders (4-12 notes) with which to work with
- f) Use the pitch orders to create a motif or theme that can be used or repeated throughout the composing process
- g) Add rhythms and rests into the motif to make a more musical (sing-able) melody.
- h) If a common chord progress (IV-V-I) becomes apparent or is useful as a basis for the melody, it is a good option to use this when available.
- i) Always attempt to end a melody on a tonic or dominant
- j) Repeat steps a-i for each data set, being sure to relate all of the melodies to the main theme composed from the average data set.
A coherent piece of music/SFP was composed/generated by observing the SFPs and listening to the music.
In step 4, a reference/theme/framework music/SFP specific to each group (NR reference and R reference) was composed/generated using non-responders and responders mean values (see FIG. 3A), respectively.
In step 5, the theme/framework tune/SFP was used as the reference music/SFP to compose/generate the training sets (i.e. known non-responder and responder tunes/SFPs) to train the model (see FIGS. 3B and 3C).
In step 6, the tunes/SFPs were finalized by listening to the composition and observing the SFPs, and further refined to match with the reference/theme music/SFP by adjusting the location of the note or tempo, etc.
In step 7, data from 8 patients were considered as the test data set (i.e. unknowns). A double blind test was performed to identify clinical outcome of the unknowns after composing/generating the tune/SFP (see FIGS. 3D-3F). The clinical outcome was predicted correctly by observing the SFPs and listening to the musical notes. 100% prediction accuracy was achieved using the current model of the present invention.
In step 8, initially the entire gene expression data were converted into musical notes using excel program and with the help of a music composer. Manual MMOA took a longer time for class prediction. The manually operated MMOA program was converted into cloud/web based software (SFPGRA). The program can be operated using any of the following programs. The wire frames used for the SFPGRA are listed in FIGS. 9A through 9L and their numbered elements and type as well as additional notations for the wireframes depicted in FIGS. 9A-9L are provide in Tables A through K above.
| Microsoft Internet Explorer | 7.x+ | ||
| Mozilla Firefox | 9.x+ | ||
| Google Chrome | 16.x+ | ||
| Apple Safari | 5.x+ | ||
Audio Files
The tunes/SFPs can be listened to by playing any musical instrument mode using any musical software. For these tests, the audios (midi files) were recorded in violin and piano playing mode. Two tunes/SFPs (NR reference and R ref) were composed as the reference/theme tunes/SFPs. Three NR tunes/SFPs and three R tunes/SFPs were composed/generated as the training set. Eight tunes (4NR and 4R) were composed/generated to test and validate the model.
Deconvolution of Musical Notes/Sound Frequencies to Signal Intensity and Gene Symbol/ID
The tunes/SFPs are readily converted back to signal intensity and gene symbol/ID using a deconvolution program. It can be linked to pathway analysis tools and public data bases. The schematic detail of the deconvolution program is shown in FIG. 5.
Example 3
Results
Conventional Microarray Data Analysis
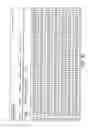
The microarray data was normalized using Robust Multi-array Average (RMA) procedure on Affymetrix GeneChip Operating Software (GCOS). For further analysis, the data was filtered and the probes that do not change were removed from the analysis. The data was further analyzed in R statistical language using standard Bioconductor packages and custom written codes. The top 50 biomarkers and their signal intensities used for class prediction are shown in Table 2.
Classifier built on the training dataset was applied to predict the clinical outcome of the 8 unknown patients (unknown test data set). The results are show in Table 3. To determine prediction accuracy, sample and data permutations were performed. Each sample was removed, and about 80% percent of genes were randomly sampled 1000 times from the filtered data-set. Each time the classifier learning procedure was repeated and then applied to unknown patients to predict the outcome. Prediction accuracies for 7 unknown patients are very high, around or higher than 95% (with about 2-3% confidence interval). The sample unknown 4 predicted as non-respondent with confidence accuracy within 61%-72%. The prediction accuracy was later compared with the original clinical outcome of the patients (Table 3). The prediction accuracy was found to be 62.5%. Three samples (marked *) out 8 samples were predicted incorrectly.
| TABLE 2 |
| Top 50 biomarkers differentially expressed in responders and non-responders of |
| surgical treatment. NR mean: Non-responders mean (n = 23); R mean: Responders mean |
| (n = 13); NR and R means were used to composed/generate reference tunes/reference SFPs. |
| KNR1, KNR2 and KNR4: Known non-responders testing set. KR3, KR6 and KR7: Known |
| responders testing set. UN1/R8: Unknown 1/Responder 8; UN2/NR5: Unknown 2/Non- |
| responder 5. Data for other 6 unknowns (3 NR and 3 R) samples are not shown. |
| Affy_Probe | NR | R | ||||||||
| ID | Mean | Mean | KNR1 | KNR2 | KNR4 | KR3 | KR6 | KR7 | UN1/R8 | UN2/NR5 |
| 201830_s_at | 10.07 | 9.69 | 7.78 | 8.83 | 9.97 | 8.95 | 6.83 | 7.78 | 9.12 | 10.33 |
| 215078_at | 3.91 | 4.25 | 5.14 | 3.80 | 3.99 | 8.05 | 8.10 | 8.74 | 6.98 | 4.17 |
| 241272_at | 4.13 | 4.36 | 4.33 | 4.00 | 4.19 | 4.06 | 7.14 | 8.04 | 6.91 | 5.39 |
| 200656_s_at | 10.91 | 10.70 | 10.97 | 11.14 | 10.01 | 10.95 | 8.77 | 8.68 | 8.56 | 8.83 |
| 213915_at | 6.41 | 6.61 | 6.12 | 7.01 | 7.02 | 8.63 | 10.86 | 7.45 | 5.77 | 7.59 |
| 243256_at | 6.50 | 6.70 | 6.72 | 6.87 | 7.18 | 7.28 | 9.25 | 8.60 | 8.45 | 8.09 |
| 243819_at | 3.78 | 3.98 | 3.75 | 4.00 | 4.51 | 4.07 | 6.62 | 5.10 | 4.53 | 5.45 |
| 240265_at | 3.43 | 3.62 | 3.51 | 3.63 | 4.26 | 3.08 | 6.38 | 5.62 | 4.72 | 5.62 |
| 232311_at | 5.48 | 5.67 | 5.90 | 5.62 | 6.05 | 6.17 | 10.18 | 9.52 | 8.77 | 9.49 |
| 236725_at | 5.61 | 5.80 | 5.48 | 5.51 | 5.56 | 6.59 | 9.00 | 7.77 | 7.62 | 7.29 |
| 211794_at | 5.82 | 6.00 | 6.40 | 6.20 | 6.03 | 6.58 | 8.99 | 8.33 | 6.81 | 7.43 |
| 244777_at | 5.25 | 5.43 | 5.22 | 5.37 | 5.90 | 5.58 | 7.72 | 6.44 | 5.11 | 5.49 |
| 238575_at | 4.16 | 4.35 | 3.75 | 4.08 | 4.10 | 3.68 | 8.81 | 4.67 | 3.92 | 5.14 |
| 204103_at | 7.83 | 7.99 | 7.25 | 7.93 | 8.62 | 9.82 | 11.78 | 9.70 | 8.43 | 8.69 |
| 242946_at | 5.35 | 5.51 | 5.53 | 5.55 | 6.56 | 5.75 | 8.60 | 7.71 | 6.63 | 7.19 |
| 224582_s_at | 9.04 | 8.88 | 8.66 | 8.61 | 8.88 | 8.94 | 5.57 | 5.60 | 6.17 | 6.77 |
| 230110_at | 5.50 | 5.66 | 5.29 | 5.93 | 6.31 | 5.94 | 8.73 | 6.91 | 6.47 | 6.55 |
| 238063_at | 5.82 | 5.97 | 6.31 | 6.04 | 5.95 | 6.01 | 8.42 | 7.91 | 6.82 | 6.64 |
| 236495_at | 3.87 | 4.02 | 4.58 | 3.73 | 3.68 | 4.80 | 7.88 | 8.82 | 6.90 | 5.64 |
| 230006_s_at | 7.87 | 7.73 | 7.40 | 7.82 | 7.58 | 8.38 | 5.23 | 5.68 | 7.70 | 7.40 |
| 227182_at | 5.48 | 5.62 | 5.10 | 5.50 | 5.87 | 5.23 | 7.59 | 5.59 | 5.05 | 5.42 |
| 240260_at | 4.86 | 5.00 | 4.62 | 5.22 | 5.38 | 4.73 | 7.12 | 7.19 | 5.79 | 5.65 |
| 201417_at | 11.61 | 11.48 | 11.26 | 11.40 | 11.78 | 11.25 | 8.22 | 10.48 | 11.57 | 10.75 |
| 240652_at | 3.97 | 4.10 | 3.76 | 4.05 | 4.30 | 4.21 | 6.17 | 6.07 | 5.35 | 4.83 |
| 1559037_a_at | 4.05 | 4.18 | 4.27 | 4.19 | 4.52 | 3.73 | 6.11 | 6.37 | 4.48 | 5.76 |
| 206296_x_at | 5.52 | 5.65 | 5.39 | 5.86 | 5.73 | 5.44 | 7.68 | 6.63 | 7.17 | 6.40 |
| 239205_s_at | 4.37 | 4.50 | 5.10 | 5.26 | 4.32 | 5.76 | 9.04 | 6.82 | 4.72 | 4.93 |
| 233204_at | 4.74 | 4.87 | 5.02 | 4.69 | 4.50 | 4.74 | 6.89 | 6.54 | 6.11 | 5.98 |
| 210549_s_at | 4.49 | 4.62 | 4.67 | 4.45 | 5.45 | 4.71 | 8.77 | 5.25 | 4.36 | 5.79 |
| 1569369_at | 4.02 | 4.14 | 3.83 | 4.43 | 3.64 | 6.06 | 7.20 | 5.60 | 4.67 | 5.83 |
| 1557797_a_at | 4.05 | 4.17 | 3.78 | 4.61 | 5.11 | 3.88 | 6.56 | 5.78 | 5.30 | 5.64 |
| 1557578_at | 2.92 | 3.05 | 2.80 | 2.56 | 3.40 | 3.12 | 6.31 | 6.04 | 3.69 | 3.33 |
| 213958_at | 7.14 | 7.26 | 7.07 | 7.41 | 7.57 | 7.25 | 8.45 | 7.51 | 7.34 | 7.54 |
| 244357_at | 4.28 | 4.40 | 4.31 | 4.43 | 4.37 | 4.10 | 7.37 | 6.75 | 6.43 | 6.31 |
| 227677_at | 6.80 | 6.91 | 6.56 | 7.07 | 7.08 | 6.98 | 9.26 | 8.32 | 7.63 | 7.68 |
| 214369_s_at | 4.25 | 4.37 | 4.79 | 4.68 | 4.69 | 4.04 | 6.03 | 5.50 | 4.52 | 4.98 |
| 204485_s_at | 9.27 | 9.16 | 9.77 | 9.36 | 8.57 | 9.44 | 6.60 | 7.03 | 8.62 | 8.64 |
| 234640_x_at | 3.43 | 3.54 | 4.09 | 3.45 | 3.69 | 3.84 | 4.80 | 6.02 | 3.62 | 3.57 |
| 236301_at | 5.19 | 5.31 | 4.67 | 5.39 | 5.73 | 5.73 | 8.06 | 5.88 | 5.17 | 6.21 |
| 241505_at | 4.53 | 4.64 | 4.19 | 4.61 | 5.26 | 4.53 | 6.38 | 6.25 | 6.26 | 5.31 |
| 1556472_s_at | 4.11 | 4.22 | 3.84 | 4.26 | 4.25 | 4.02 | 6.58 | 4.66 | 4.47 | 4.73 |
| 1560706_at | 4.70 | 4.81 | 4.70 | 4.49 | 5.32 | 5.25 | 6.84 | 5.56 | 5.81 | 5.53 |
| 235040_at | 6.38 | 6.27 | 6.62 | 6.30 | 5.75 | 6.19 | 5.03 | 5.60 | 6.13 | 5.94 |
| 201428_at | 8.83 | 8.72 | 6.94 | 8.50 | 8.99 | 6.81 | 4.74 | 7.06 | 8.48 | 9.67 |
| 224676_at | 9.53 | 9.42 | 9.86 | 9.13 | 9.48 | 8.87 | 7.96 | 7.91 | 8.59 | 8.54 |
| 214219_x_at | 5.51 | 5.61 | 5.37 | 5.74 | 5.91 | 5.35 | 7.45 | 6.55 | 6.78 | 6.33 |
| 1555259_at | 4.13 | 4.23 | 4.03 | 3.98 | 3.83 | 5.29 | 8.39 | 4.95 | 4.77 | 4.97 |
| 210988_s_at | 7.29 | 7.18 | 7.22 | 7.40 | 6.58 | 7.48 | 4.74 | 5.25 | 6.52 | 5.51 |
| 210225_x_at | 7.74 | 7.84 | 7.87 | 7.89 | 8.03 | 8.33 | 9.00 | 8.80 | 7.98 | 7.72 |
| 206804_at | 5.45 | 5.55 | 5.48 | 5.61 | 5.68 | 5.88 | 9.80 | 6.93 | 6.50 | 7.20 |
| TABLE 3 |
| Prediction accuracy of conventional data analysis |
| method was calculated by comparing the predicted |
| outcomes with the original clinical outcome. |
| S. No | Status | Clinical outcome | Predicted with Bio-Conductor |
| 1 | Unknown 1 | Responder | Non-Responder* |
| 2 | Unknown 2 | Non-Responder | Non-Responder |
| 3 | Unknown 3 | Non-Responder | Non-Responder |
| 4 | Unknown 4 | Responder | Non-Responder* |
| 5 | Unknown 5 | Responder | Responder |
| 6 | Unknown 6 | Responder | Responder |
| 7 | Unknown 7 | Non-Responder | Responder* |
| 8 | Unknown 8 | Non-Responder | Non-Responder |
| *Three samples out 8 were predicted incorrectly |
Prediction accuracy of MMOA is shown in Table 4. Eight tunes/SFPs were composed to validate the algorithm and they were predicted with 100% accuracy in double blind studies.
| TABLE 4 |
| Comparison of prediction accuracy of conventional |
| microarray analysis method with MMOA. |
| Clinical | Predicted with | Predicted with | ||
| S. No | Status | outcome | Bio-Conductor | MMOA |
| 1 | Unknown 1 | Responder | Non-Responder | Responder |
| 2 | Unknown 2 | Non-Responder | Non-Responder | Non-Responder |
| 3 | Unknown 3 | Non-Responder | Non-Responder | Non-Responder |
| 4 | Unknown 4 | Responder | Non-Responder | Responder |
| 5 | Unknown 5 | Responder | Responder | Responder |
| 6 | Unknown 6 | Responder | Responder | Responder |
| 7 | Unknown 7 | Non-Responder | Responder | Non-Responder |
| 8 | Unknown 8 | Non-Responder | Non-Responder | Non-Responder |
Claims
What is claimed is:1. A method of classifying a patient suffering from a disease as a responder or a non-responder to a selected treatment for the disease, said method comprising analyzing a sample from the patient using an RNA, DNA or protein microarray;
filtering a data set generated from the microarray;
assigning an audio tune and/or sound frequency pattern capturing the filtered data to the patient; and
classifying the patient as a responder or a non-responder utilizing the audio tune and/or sound frequency pattern.
2. The method of claim 1 wherein the patient is suffering from cancer.
3. The method of claim 1 wherein the patient is suffering from lung cancer.
4. The method of claim 1 wherein the audio tune capturing the filtered data from the microarray is assigned manually using a mathematical musical orchestral algorithm.
5. The method of claim 1 wherein the sound frequency pattern capturing the filtered data from the microarray is assigned using a web based sound frequency pattern generation and recognition algorithm.
6. The method of claim 1 further comprising obtaining a tissue sample from the patient for analysis.
7. A method of predicting recurrence of a disease in a patient, said method comprising:
analyzing a sample from the patient using an RNA, DNA or protein microarray;
filtering a data set generated from the microarray;
assigning an audio tune or sound frequency pattern capturing the filtered data to the patient; and
predicting recurrence of the disease in the patient utilizing the audio tune.
8. The method of claim 7 wherein the patient is suffering from cancer.
9. The method of claim 7 wherein the patient is suffering from lung cancer.
10. The method of claim 7 wherein the audio tune capturing the filtered data from the microarray is assigned manually using a mathematical musical orchestral algorithm.
11. The method of claim 7 wherein the audio tune capturing the filtered data from the microarray is assigned using a web based sound frequency pattern generation and recognition algorithm.
12. The method of claim 7 further comprising obtaining a tissue sample from the patient for analysis.
Images & Drawings included:


Sources:
- United States Patent and Trademark Office - verify current appl. status at the USPTO↗
Recent applications in this class:
- » 20210056176 2021-02-25
Healthcare information technology system for predicting or preventing readmissions - » 20190138694 2019-05-09
Automatic characterization of Agatston score from coronary computed tomography - » 20190130077 2019-05-02
SENSOR SYSTEM AND METHOD FOR COGNITIVE HEALTH ASSESSMENT - » 20190102522 2019-04-04
Pre-emptive asthma risk notifications based on medicament device monitoring - » 20190095588 2019-03-28
HEALTH TREND IDENTIFICATION - » 20190073449 2019-03-07
Computer implemented system for providing health care management - » 20190065692 2019-02-28
Method and System for Determining Individualized Heath Scores - » 20190065691 2019-02-28
Reducing the risk of potentially preventable events - » 20190034596 2019-01-31
Tool that analyzes image data and generates and displays a confidence indicator along with a cancer score - » 20190034595 2019-01-31
GENERATING ROBUST SYMPTOM ONSET INDICATORS
Recent applications for this Assignee:
- » 20250289907 2025-09-18
PHOSPHATIDYLSERINE TARGETING MOLECULE COMBINED WITH MEMORY T CELL ANTIGEN FOR THERAPEUTIC, DIAGNOSTIC AND ADJUVANT USE - » 20250268534 2025-08-28
Elastomers Enhanced with in situ Formation of 2D Nanoparticles from Layered Materials for Multifunctional Sensors - » 20250248379 2025-08-07
piRNA-BASED CONSTRUCTS FOR REGULATING GENE EXPRESSION AND METHODS OF USE THEREOF - » 20250243510 2025-07-31
CONTROLLED MUSCLE-SPECIFIC GENE DELIVERY - » 20250243249 2025-07-31
COMPOSITIONS AND METHODS FOR THE ISOLATION AND PURIFICATION OF ANTI-FUNGAL PROTEIN FROM EPICHLOE FESTUCAE AND USE THEREOF FOR REDUCING SYMPTOMS OF DOLLAR SPOT DISEASE IN TARGETED PLANT SPECIES - » 20250242404 2025-07-31
CASTING ELEMENTS AND METHODS OF MAKING THE SAME USING LOW TEMPERATURE SOLIDIFICATION - » 20250207396 2025-06-26
Anchorage System For Prestressing Non-Metallic Tendons - » 20250206755 2025-06-26
ANTIMICROBIAL AGENTS - » 20250200375 2025-06-19
SYSTEMS AND METHODS FOR TRAINING PHYSICS-INFORMED NEURAL NETWORK SURROGATE MODELS TO MODEL PHYSICAL PROBLEMS USING THE FINITE ELEMENT METHOD - » 20250188138 2025-06-12
CELL PENETRATING PEPTIDES THAT INHIBIT IRF5 NUCLEAR LOCALIZATION