Algorithm for constructing hypothetical evolutionary trees using common mutations similarity matrices
US20170076034A1
2017-03-16
14/852,483
2015-09-11
Abstract:
The present invention permits constructing hypothetical evolutionary trees for a set of genetically related DNA strings or a set of proteins within a protein family. The main novelty of the invention compared to other hypothetical evolutionary tree construction methods is the use of a common mutations similarity matrix.
Interested in similar patents?
Get notified when new applications in this technology area are published.
Classification:
Description
PRIOR PUBLICATION DATA
- Revesz, P. Z. (2013) An algorithm for constructing hypothetical evolutionary trees using common mutations similarity matrices, Proceedings of the 4th ACM International Conference on Bioinformatics and Computational Biology, ACM Press, pp. 731-734, Bethesda, Md., USA, September 22-25.
- Revesz, P. Z. (2013) An efficient algorithm for constructing evolutionary trees using common mutation matrixes, Proceedings of the 14th International Conference on Mathematics and Computers in Biology and Chemistry, WSEAS Press, pp. 107-113, Baltimore, Md., USA, September 17-19.
U.S. PATENT DOCUMENTS
- Muto. Isamu et al. (2005) Dendogram displaying method, U.S. Pat. No. 6,847,381.
- Sayood, K. et al. (2014) System and method for sequence distance measure for phylogenetic tree construction, U.S. Pat. No. 8,725,419.
OTHER REFERENCES
Please See at the End
PARENT CASE TEXT
Cross Reference to Related Applications
U.S. Provisional Patent Application 62/049,332 filed Sep. 11, 2014. No other applications.
DESCRIPTION
Background of the Invention
Understanding the evolutionary relationship of a set of biological organisms is an important part of many biological applications. Therefore constructing hypothetical evolutionary trees, also called phylogenetic trees, is a well-established topic with several prior algorithms proposed by other researchers (Baum and Smith [1], Hall [2], Lerney et al. [3]). Two of these algorithms, namely the neighbor joining (Saitou and Nei [7]) and the UPGMA (Sokal and Michener [9]) methods, are based on using a distance matrix for a set of nucleotide or amino acid sequences.
SUMMARY OF THE INVENTION
The main novelty and distinguishing feature of the proposed patent is that it uses common mutations similarity matrices instead of distance matrices. The motivation behind looking for common mutations is that in practice rare but shared features, such as rare mutations, often provide useful markers of similarity among a set of closely related items.
DETAILED DESCRIPTION OF THE INVENTION
Our hypothetical evolutionary tree construction algorithm based on common mutations similarity matrices (CMSMs) is summarized by the following pseudocode:
| ALGORITHM CMSM(S1 . . . Sn, n) |
| Input Data: S1 ... Sn are n aligned nucleotide sequences, each with the |
| same length l. The alignment may contain gaps. (If the original sequences |
| are not aligned, then preprocess the data by any well-known sequence |
| alignment algorithm [10].) |
| 1 | Form n clusters of sequences, each with a single sequence. |
| 2 | Find the putative common ancestor μ of the sequences. |
| 3 | Construct a graph T with a node for each n cluster and for μ. |
| 4 | Find the common mutations similarity matrix |
| 5 | While (there is more than one cluster) |
| 6 | If (exist distinct Si and Sj with non-0 common mutations) |
| 7 | Merge a closest distinct Si and Sj pair into a new cluster |
| Sij and create a node for Sij.and update the common | |
| mutations similarity matrix. |
| 8 | Connect the nodes for Si and Sj with parent node Sij. |
| 9 | Else |
| 10 | Connect the remaining clusters' nodes to parent μ. |
| 11 | Return T. |
| 12 | Return T. |
Next we illustrate the above algorithm using as the input data the following seven nucleotide sequences S1 . . . S7, each with a length fifteen nucleotides displayed by groups of five nucleotides per column in table below:
| S1 | AGCTA | CTAGT | AATCA | |
| S2 | AGCTA | CGAGT | AATCA | |
| S3 | ATCCA | CTAGT | ACACT | |
| S4 | ATCCA | CTAGT | ATACT | |
| S5 | CGGTA | TTTGT | AAGCT | |
| S6 | CGGTT | CATCA | AATGC | |
| S7 | AGGTA | CTTGA | AATCC |
Let Si[k] denote the kth nucleotide of the ith nucleotide sequence, Si.
Line 2: Find a Putative Common Ancestor μ of the Sequences:
In the case of nucleotide sequences, as in the current example, we find the hypothetical common ancestor sequence, denoted μ, as the mode of each column. If there is no most frequent nucleotide in a column, then we arbitrarily chose one of the most frequent nucleotides in it.
| S1 | AGCTA | CTAGT | AATCA | |
| S2 | AGCTA | CGAGT | AATCA | |
| S3 | ATCCA | CTAGT | ACACT | |
| S4 | ATCCA | CTAGT | ATACT | |
| S5 | CGGTA | TTTGT | AAGCT | |
| S6 | CGGTT | CATCA | AATGC | |
| S7 | AGGTA | CTTGA | AATCC | |
| μ | AGCTA | CTAGT | AATCT |
Line 4:
It can be assumed that in each sequence Si those nucleotides that do not match the corresponding nucleotide in μ were mutated at some point during evolution. In the above table those nucleotides are underscored. The common mutations similarity matrix is constructed by finding for each pair of sequences the number of underscored items, i.e., mutations with respect μ that they share. In our example, the result is the following:
| S1 | S2 | S3 | S4 | S5 | S6 | S7 | |
| S1 | 1 | 1 | 0 | 0 | 0 | 0 | 0 | |
| S2 | 1 | 2 | 0 | 0 | 0 | 0 | 0 | |
| S3 | 0 | 0 | 4 | 3 | 0 | 0 | 0 | |
| S4 | 0 | 0 | 3 | 4 | 0 | 0 | 0 | |
| S5 | 0 | 0 | 0 | 0 | 5 | 3 | 2 | |
| S6 | 0 | 0 | 0 | 0 | 3 | 9 | 4 | |
| S7 | 0 | 0 | 0 | 0 | 2 | 4 | 4 | |
Line 7: Merging Nodes and Updating the Common Mutations Similarity Matrix:
When we merge two sequences Si and Sj, in the merged sequence the kth element will be equal to the nucleotide in the two sequences if Si[k]=Sj[k] and will be equal to μ[k] otherwise. For example, according to the common mutations similarity matrix shown above, the closest pair of sequences is S6 and S7. When we merge these sequences, the matrix of sequences will be updated as follows:
| S1 | AGCTA | CTAGT | AATCA | |
| S2 | AGCTA | CGAGT | AATCA | |
| S3 | ATCCA | CTAGT | ACACT | |
| S4 | ATCCA | CTAGT | ATACT | |
| S5 | CGGTA | TTTGT | AAGCT | |
| S67 | AGGTA | CTTGA | AATCC | |
| μ | AGCTA | CTAGT | AATCT |
The WHILE loop is repeated until there are no more unmerged sequences or there are no similar sequences (that is, their common mutations value is simply zero). Therefore, after merging S6 and S7 into a cluster, in the next iteration of the while loop, the algorithm updates the common mutations matrix as follows:
| S1 | S2 | S3 | S4 | S5 | S67 | |
| S1 | 1 | 1 | 0 | 0 | 0 | 0 | |
| S2 | 1 | 2 | 0 | 0 | 0 | 0 | |
| S3 | 0 | 0 | 4 | 3 | 0 | 0 | |
| S4 | 0 | 0 | 3 | 4 | 0 | 0 | |
| S5 | 0 | 0 | 0 | 0 | 5 | 2 | |
| S67 | 0 | 0 | 0 | 0 | 2 | 4 | |
Next merging the closest pair, S3 and S4, yields:
| S1 | AGCTA | CTAGT | AATCA | |
| S2 | AGCTA | CGAGT | AATCA | |
| S34 | ATCCA | CTAGT | AAACT | |
| S5 | CGGTA | TTTGT | AAGCT | |
| S67 | AGGTA | CTTGA | AATCC | |
| μ | AGCTA | CTAGT | AATCT |
The updated common mutations matrix will be:
| S1 | S2 | S34 | S5 | S67 | |
| S1 | 1 | 1 | 0 | 0 | 0 | |
| S2 | 1 | 2 | 0 | 0 | 0 | |
| S34 | 0 | 0 | 3 | 0 | 0 | |
| S5 | 0 | 0 | 0 | 5 | 2 | |
| S67 | 0 | 0 | 0 | 2 | 4 | |
Next merging the closest pair, S5 and S67, yields:
| S1 | AGCTA | CTAGT | AATCA | |
| S2 | AGCTA | CGAGT | AATCA | |
| S34 | ATCCA | CTAGT | AAACT | |
| S567 | AGGTA | CTTGT | AATCT | |
| μ | AGCTA | CTAGT | AATCT |
The updated common mutations matrix will be:
| S1 | S2 | S34 | S567 | |
| S1 | 1 | 1 | 0 | 0 | |
| S2 | 1 | 2 | 0 | 0 | |
| S34 | 0 | 0 | 3 | 0 | |
| S567 | 0 | 0 | 0 | 2 | |
Next merging the closest pair, S1 and S2, yields:
| S12 | AGCTA | CTAGT | AATCA | |
| S34 | ATCCA | CTAGT | AAACT | |
| S567 | AGGTA | CTTGT | AATCT | |
| μ | AGCTA | CTAGT | AATCT |
The updated common mutations matrix will be:
| S12 | S34 | S567 | |
| S12 | 1 | 0 | 0 | |
| S34 | 0 | 3 | 0 | |
| S567 | 0 | 0 | 2 | |
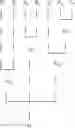
Finally, the remaining clusters S12, S34, and S567 can be interpreted as being separate branches that are all descendent from the common ancestor sequence μ. Hence in the else clause, the new algorithm connects the remaining clusters' nodes to μ and generates the following hypothetical evolutionary tree:
The above hypothetical evolutionary tree is different from the one that is generated by the UPGMA algorithm. Our publications [5] and [6] show the UPGMA result but is omitted from this patent application. U.S. Pat. No. 8,725,419 [8] is focused on a completely different similarity measure between genome sequences. U.S. Pat. No. 6,847,381 [4] is only tangentially related because it describes a method to visualize the phylogenetic tree instead of a method to generate the phylogenetic tree.
The CMSM algorithm can be easily adapted to a set of amino acid sequences. For amino acid sequences the μ is found by taking out of the twenty possible amino acids the one that is overall closest to the amino acids in the aligned column of amino acids. The overall closest is simply the amino acids for which the sum of similarity values to the amino acids is maximal.
REFERENCES
- [1] Baum, D. and Smith, S. (2012) Tree Thinking: An Introduction to Phylogenetic Biology, Roberts and Company Publishers.
- [2] Hall, B. G. (2011) Phylogenetic Trees Made Easy: A How to Manual, 4th edition, Sinauer Associates.
- [3] Lerney, P., Salemi, M. and Vandamme, A.-M, editors, (2009) The Phylogenetic Handbook: A Practical Approach to Phylogenetic Analysis and Hypothesis Testing, 2nd edition, Cambridge University Press.
- [4] Muto. Isamu et al. (2005) Dendogram displaying method, U.S. Pat. No. 6,847,381.
- [5] Revesz, P. Z., An algorithm for constructing hypothetical evolutionary trees using common mutations similarity matrices, Proceedings of the 4th ACM International Conference on Bioinformatics and Computational Biology, ACM Press, pp. 731-734, Bethesda, Md., USA, Sep. 22-25, 2013.
- [6] Revesz, P. Z., An efficient algorithm for constructing evolutionary trees using common mutation matrixes, Proceedings of the 14th International Conference on Mathematics and Computers in Biology and Chemistry, WSEAS Press, pp. 107-113, Baltimore, Md., USA, Sep. 17-19, 2013.
- [7] Saitou, N. and Nei, M. 1987. The neighbor-joining method: A new method for reconstructing phylogenetic trees. Molecular Biological Evolution, 4, 406-425.
- [8] Sayood, K. et al. (2014) System and method for sequence distance measure for phylogenetic tree construction, U.S. Pat. No. 8,725,419.
- [9] Sokal, R. R. and Michener, C. D. (1958) A statistical method for evaluating systematic relationships. University of Kansas Science Bulletin, 38, 1409-1438.
- [10] Jones, N. C. and Pevzner, P. A. (2004) An Introduction to Bioinformatics Algorithms, MIT Press
Claims
We claim:1. A computer implemented method comprising: receiving as input either a set of nucleic acid sequences or a set of protein sequences; generating an initial common mutations similarity matrix; in each successive steps merging the pair of sequences that are most similar according to the current common mutations similarity matrix and then updating the common mutations similarity matrix; repeating the merging steps until there is only sequence left; finally, from the sequence of merging steps reconstruct a hypothetical evolutionary tree.
2. The method in claim 1, wherein in case of nucleotide sequences the common mutations similarity matrix is computed by first identifying a hypothetical common ancestor sequence. In the case of nucleotide sequences the computation of the hypothetical common ancestor sequence comprises of the following two steps: first an alignment of the input nucleotide sequences and second in each column of the alignment finding the most frequent nucleotide. If there is more than one with the same maximum frequency than any one of those is selected by some random method.
3. The method in claim 1, wherein in case of amino acid sequences the common mutations similarity matrix is computed by first identifying a hypothetical common ancestor sequence. In the case of amino acid sequences the computation of the hypothetical common ancestor sequence comprises of the following two steps: first an alignment of the input nucleotide sequences and second in each column of the alignment finding the amino acid that is overall closest to all the amino acids in that column. Further, the overall closest amino acid is the amino acid that has the maximum sum of similarities between it and the amino acids in the column. If there is more than one with the same maximum value than any one of those is selected by some random method.
Images & Drawings included:
Sources:
- United States Patent and Trademark Office - verify current appl. status at the USPTO↗
Recent applications in this class:
- » 20200019674 2020-01-16
GRANULAR ELECTION OF PREDICTIVE POLYGENIC MODELS - » 20200004925 2020-01-02
Functional analysis of time-series phylogenetic tumor evolution tree - » 20190220572 2019-07-18
DETECTION AND VISUALIZATION OF MUTATIONAL EVOLUTION DEPENDENT GENE SET ALTERATION - » 20190130063 2019-05-02
Taxonomic annotation of variable length metagenomic patterns - » 20180365374 2018-12-20
POSITIVE OPERATIONAL TAXONOMIC UNIT IDENTIFICATION IN METAGENOMICS - » 20180365373 2018-12-20
POSITIVE OPERATIONAL TAXONOMIC UNIT IDENTIFICATION IN METAGENOMICS - » 20180330044 2018-11-15
Methods Associated With A Database That Stores A Plurality Of Reference Genomes - » 20180285519 2018-10-04
PHYLOGENY TREE GENERATION FROM MIXED SAMPLES - » 20180018422 2018-01-18
SYSTEMS AND METHODS FOR NUCLEIC ACID-BASED IDENTIFICATION - » 20170329891 2017-11-16
Ancestry finder