Colorimetric detection sensor and colorimetric detection method for detecting cyanide anion by etching of gold nanorods
US20170160205A1
2017-06-08
15/357,169
2016-11-21
✅ Patent granted
US 9,846,127 B2
2017-12-19
-
-
Jennifer Wecker
Goldilocks Zone IP Law
2036-11-21
Abstract:
Disclosed are a colorimetric detection sensor and colorimetric detection method of a cyanide anion (CN−) by etching of gold nanorods. The colorimetric detection sensor and colorimetric detection method use label-free nanorods having no modifier attached to a surface of gold nanorods (AuNRs), wherein the aspect ratio of nanorods, pH condition and/or amount of a surfactant are controlled to carry out selective etching and to cause a change in color only by CN− so that CN− contained or dissolved in poison, water-contaminated environmental samples and legal evidence samples may be detected with ease, and show excellent selectivity, sensitivity and quantitative analyzability to CN− to provide high usefulness.
Inventors:
- Yeonhee LEE 6 🇰🇷 Seoul, South Korea
- Kangbong LEE 2 🇰🇷 Seoul, South Korea
- Yunsik NAM 2 🇰🇷 Seoul, South Korea
- Inhwan OH 4 🇰🇷 Seoul, South Korea
- Sujin LEE 10 🇰🇷 Seoul, South Korea
Assignee:
- Korea Institute of Science and Technology 2,066 🇰🇷 Seoul, South Korea
Applicant:
Interested in similar patents?
Get notified when new applications in this technology area are published.
Classification:
G01N21/25 IPC
Investigating or analysing materials by the use of optical means, i.e. using sub-millimetre waves, infrared, visible or ultraviolet light; Systems in which incident light is modified in accordance with the properties of the material investigated Colour; Spectral properties, i.e. comparison of effect of material on the light at two or more different wavelengths or wavelength bands
G01N21/80 » CPC main
Investigating or analysing materials by the use of optical means, i.e. using sub-millimetre waves, infrared, visible or ultraviolet light; Systems in which material is subjected to a chemical reaction, the progress or the result of the reaction being investigated by observing the effect on a chemical indicator producing a change of colour Indicating pH value
G01N21/251 » CPC further
Investigating or analysing materials by the use of optical means, i.e. using sub-millimetre waves, infrared, visible or ultraviolet light; Systems in which incident light is modified in accordance with the properties of the material investigated; Colour; Spectral properties, i.e. comparison of effect of material on the light at two or more different wavelengths or wavelength bands Colorimeters; Construction thereof
G01N33/52 IPC
Investigating or analysing materials by specific methods not covered by groups -; Biological material, e.g. blood, urine ; Haemocytometers; Chemical analysis of biological material, e.g. blood, urine; Testing involving biospecific ligand binding methods; Immunological testing Use of compounds or compositions for colorimetric, spectrophotometric or fluorometric investigation, e.g. use of reagent paper and including single- and multilayer analytical elements
G01N31/224 » CPC further
Investigating or analysing non-biological materials by the use of the chemical methods specified in the subgroup; Apparatus specially adapted for such methods using chemical indicators for investigating presence of specific gases or aerosols for investigating presence of dangerous gases
G01N27/126 » CPC further
Investigating or analysing materials by the use of electric, electrochemical, or magnetic means by investigating impedance by investigating resistance of a solid body in dependence upon absorption of a fluid; of a solid body in dependence upon reaction with a fluid, for detecting components in the fluid; Composition of the body, e.g. the composition of its sensitive layer comprising organic polymers
G01N33/50 IPC
Investigating or analysing materials by specific methods not covered by groups -; Biological material, e.g. blood, urine ; Haemocytometers Chemical analysis of biological material, e.g. blood, urine; Testing involving biospecific ligand binding methods; Immunological testing
G01N27/12 » CPC further
Investigating or analysing materials by the use of electric, electrochemical, or magnetic means by investigating impedance by investigating resistance of a solid body in dependence upon absorption of a fluid; of a solid body in dependence upon reaction with a fluid, for detecting components in the fluid
G01N33/4925 » CPC further
Investigating or analysing materials by specific methods not covered by groups -; Biological material, e.g. blood, urine ; Haemocytometers; Physical analysis of biological material of liquid biological material; Blood measuring blood gas content, e.g. O, CO , HCO
G01N33/5014 » CPC further
Investigating or analysing materials by specific methods not covered by groups -; Biological material, e.g. blood, urine ; Haemocytometers; Chemical analysis of biological material, e.g. blood, urine; Testing involving biospecific ligand binding methods; Immunological testing involving human or animal cells for testing or evaluating the effect of chemical or biological compounds, e.g. drugs, cosmetics for testing toxicity
G01N33/5308 » CPC further
Investigating or analysing materials by specific methods not covered by groups -; Biological material, e.g. blood, urine ; Haemocytometers; Chemical analysis of biological material, e.g. blood, urine; Testing involving biospecific ligand binding methods; Immunological testing; Immunoassay; Biospecific binding assay; Materials therefor for analytes not provided for elsewhere, e.g. nucleic acids, uric acid, worms, mites
Y10T436/172307 » CPC further
Chemistry: analytical and immunological testing; Nitrogen containing Cyanide or isocyanide
G01N31/22 » CPC further
Investigating or analysing non-biological materials by the use of the chemical methods specified in the subgroup; Apparatus specially adapted for such methods using chemical indicators
G01N33/53 IPC
Investigating or analysing materials by specific methods not covered by groups -; Biological material, e.g. blood, urine ; Haemocytometers; Chemical analysis of biological material, e.g. blood, urine; Testing involving biospecific ligand binding methods; Immunological testing Immunoassay; Biospecific binding assay; Materials therefor
G01N33/49 IPC
Investigating or analysing materials by specific methods not covered by groups -; Biological material, e.g. blood, urine ; Haemocytometers; Physical analysis of biological material of liquid biological material Blood
B82Y30/00 » CPC further
Nanotechnology for materials or surface science, e.g. nanocomposites
G01N21/78 » CPC further
Investigating or analysing materials by the use of optical means, i.e. using sub-millimetre waves, infrared, visible or ultraviolet light; Systems in which material is subjected to a chemical reaction, the progress or the result of the reaction being investigated by observing the effect on a chemical indicator producing a change of colour
G01N33/84 » CPC further
Investigating or analysing materials by specific methods not covered by groups -; Biological material, e.g. blood, urine ; Haemocytometers; Chemical analysis of biological material, e.g. blood, urine; Testing involving biospecific ligand binding methods; Immunological testing involving inorganic compounds or pH
Description
CROSS-REFERENCE TO RELATED APPLICATION
This application claims priority to Korean Patent Application No. 10-2015-0170887, filed on Dec. 2, 2015, and all the benefits accruing therefrom under 35 U.S.C. §119, the contents of which in its entirety are herein incorporated by reference.
BACKGROUND
1. Field
The present disclosure relates to a colorimetric detection sensor and a colorimetric detection method of a cyanide anion (CN−) based on etching of gold nanorods.
More particularly, the present disclosure relates to a colorimetric detection sensor and a colorimetric detection method, which use label-free nanorods having no modifier attached to the surface of gold nanorods (AuNRs), wherein the aspect ratio of nanorods, pH condition and/or amount of a surfactant are controlled to carry out selective etching and to cause a change in color only by CN− so that CN− contained or dissolved in poison samples, water-contaminated environmental samples and legal evidence samples may be detected with ease, and show excellent selectivity, sensitivity and quantitative analyzability to CN− to provide high usefulness.
DESCRIPTION ABOUT NATIONAL SUPPORT RESEARCH AND DEVELOPMENT
This study is conducted by the support of Ministry of Science, ICT and Future Planning, and the subject title is Development of Efficient and Cutting-Edge Analysis Technique and Establishment of On-site Evidence Predictive Factor Data Base (Subject Identification No.: 1711018287).
2. Description of the Related Art
Many cyanide compounds are toxic, because CN− functions as a reaction inhibitor against cytochrome C oxidase that is an enzyme present in an electron transfer chain in cellular mitochondria. When CN− is bound with the enzyme, electron transfer from cytochrome C to oxygen is interrupted. As a result, the electron transfer chain is broken and the cell cannot produce ATP any more for energy. The most harmful cyanide compound is an inhalable hydrogen cyanide that exists in a gaseous state at room temperature. Human who eats a solid cyanide compound or cyanide solution in a small amount of 200 mg or inhales 270 ppm of cyanide gas may be dead within 1 minute.
Various detection methods and criteria have been suggested for CN− in an environmental sample, food or drinking water. The criterion for drinking water is 200 ppb according to EPA of USA and that of Europe is 50 ppb. In addition, the criterion for mineral water is 70 ppb or less. There have been suggested some official methods for analyzing CN−, including titration and spectrometry [US EPA, Titrimetric and manual spectrophotometric determinative methods for cyanide, Method 9014, 1996], potentiometric titration using a cyanide-selective electrode [US EPA, Potentiometric determination of cyanide in aqueous samples and distillates with ion-selective electrode, Method 9213, 1996], flow injection(FI)-amperometry [US EPA, Available cyanide by flow injection, ligand exchange and amperometry, Method OIA-1677, 2004], or the like.
Gold nanorods (AuNRs) are obtained by reducing chlorauric acid hydrate (HAuCl4.H2O) with NaBH4 in the presence of cetyltrimethyl ammonium bromide (CTAB) to provide gold nanoparticles and carrying out further reduction with ascorbic acid. Such nanorods have been applied widely in various industrial fields, including sensors, depending on their sizes and shapes.
Nanoparticle colorimetric sensor analysis using a surface plasmon resonance phenomenon of gold nanoparticles theoretically utilizes the principle of inducing free electron vibration of the surface of nanoparticles by the light waves absorbed thereto. Herein, a resonance phenomenon occurs to emit a specific wavelength and shows various colors depending on size, shape and type of the particles. Since gold nanorods (AuNRs) may have a variable color according to a change in dimension of width and length, they may be applied widely to sensors for determining and monitoring a specific material which etchs the nanorods (Chem Soc. Rev. 2013, 42, 2679-2724).
As a metal ion detection colorimetric sensor using gold nanorods known to date, Professor Jiaming Ryu (Jangchow Nomal University, China) has developed a sensor for detecting hexavalent chromium ion (Cr6+) by using Cr (VI) ions which can etch gold nanorods selectively [Sensors and Actuators B, 2011, 155, 817-822]. In addition, selective detection of Cu2+ ions has been disclosed wherein it uses a change in maximum peak wavelength of UV-Vis spectrum when poly(sodium-4-styrene sulfonate) and polyethylene imine (PEI) are adsorbed to gold nanorods and then bound with Cu2+ ions [J. of Colloid and Interface Science 439 (2015) 7-11]. Further, Professor Andres D. Campiglia of Central Florida University, USA has suggested a sensor for analyzing mercury by binding (3-mercaptopropyl)trimethoxysilane to gold nanorods [Talanta 99 (2012)180-185].
According to the inventors' observations, there is a need for a sensor technology for carrying out rapid detection and analysis of ON− in environmentally contaminated samples, forensic science samples, drinking water, medicine or industrial sites where chemicals are treated, etc., which may allow real time determination and continuous management, have high stability and enable downsizing.
SUMMARY
The present disclosure is directed to providing a colorimetric detection sensor and a colorimetric detection method of a cyanide anion (ON−) which, by using label-free nanorods having no specific compound bound thereto, may provide high selectivity to a material to be detected, ON−, and allow simple real-time monitoring and quantitative determination with ease even at a very low concentration.
In one aspect of example embodiments, there is provided a colorimetric detection sensor for detecting a cyanide anion (ON−), which includes gold nanorods having an aspect ratio of 0.29-1.
Herein, it is most suitable that the gold nanostructure for detecting a cyanide anion has a rod-like shape. As the difference in dimension between the width and the length becomes bigger, a red shift occurs, resulting in an increase in wavelength. As the difference is decreased, a blue shift occurs, resulting in a decrease in wavelength. The gold nanorods according to the embodiments of the present disclosure have an aspect ratio of 0.29-1, which corresponds to a blue shift, and may show a significant change in color. Therefore, it is the most suitable that the aspect ratio is 0.29-1, since it causes a change in color in a wavelength range of 700 nm-450 nm, particularly the aspect ratio is 0.7-0.8.
According to an example embodiment, the gold nanorods may have a size of 50 nm or less.
According to an example embodiment, in the colorimetric detection sensor, the rod-shaped gold nanorods are etched by CN− so that they may be changed into a spherical shape, and thus may show a change in color due to a surface resonance phenomenon.
According to an example embodiment, the change in color in the colorimetric detection sensor proceeds from a blue color to a purple color, a pink color or transparency.
According to an example embodiment, the colorimetric detection sensor includes cetyltrimethyl ammonium bromide (CTAB) which is a surfactant at a concentration of 1-3 mM.
According to an example embodiment, the colorimetric detection sensor detects CN− in a range of pH 6-8, detection at a pH of 6 being particularly advantageous.
According to an example embodiment, the colorimetric detection sensor may detect CN− at a temperature ranging from room temperature to 50° C.
According to an example embodiment, a detection reaction of CN− is carried out within 30 minutes.
According to an example embodiment, the concentration of detected CN− may be judged by the naked eyes, and the change in color of the colorimetric detection sensor may be quantitatively determined by using a spectrophotometer or colorimeter.
In another aspect of example embodiments, there is provided a colorimetric detection method for detecting CN−, which includes: introducing a sample to be detected to a colorimetric detection sensor; and detecting 0.01 ppm or higher of CN− in the sample to be detected by a change in color of the colorimetric detection sensor, wherein the colorimetric detection sensor includes gold nanorods having an aspect ratio of 0.29-1.
According to an example embodiment, before introducing the sample, the method may further include adjusting pH and temperature of the colorimetric detection sensor to enhance the stability and sensitivity of the nanorods.
According to an example embodiment, the colorimetric detection sensor shows color emission in a wavelength range of 450 nm-700 nm in the introducing, and it shows color emission in a wavelength range of 500 nm-600 nm when CN− is present in the sample to be detected in the detecting.
According to an example embodiment, the colorimetric sensor may have an absorbance ratio (A538/A679) of 0.5-10 in the detecting.
The colorimetric detection sensor for detecting a cyanide anion (CN−) according to the embodiments of the present disclosure has high selectivity to CN− and has a high sensitivity so as to have a detection limit of 0.01 ppm or less, and thus is very suitable for colorimetric detection. In addition, no interference effect with the other metal cations or anions occurs. As well, the colorimetric detection sensor is convenient to use for a simple determining the content of CN− on the spot, and requires a short reaction and detection time so that it may be used immediately on the spot. Therefore, the colorimetric detection sensor may be used widely for practical uses in environmentally contaminated samples, forensic science samples, drinking water, medicines, industrial sites where chemicals are treated, or the like.
BRIEF DESCRIPTION OF THE DRAWINGS
The above and other aspects, features and advantages of the disclosed example embodiments will be more apparent from the following detailed description taken in conjunction with the accompanying drawings in which:
FIG. 1 is a schematic view illustrating the process of etching of gold nanorods with CN− according to an example embodiment.
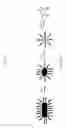
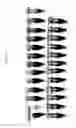
FIG. 2 is a transmission electron microscopic (TEM) image (portion (a)) of gold nanorods, TEM image (portion (b)) of modified gold nanorods in the presence of 0.2 mM CN−, and TEM image (portion (c)) of modified gold nanorods in the presence of 0.4 mM CN− according to an example.
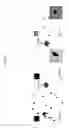
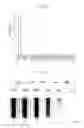
FIG. 3A is an image illustrating a change in color of a colorimetric sensor solution depending on CTAB concentration after adding CN− in Example 2.
FIG. 3B is an image illustrating an absorbance ratio (A538/A678) of a colorimetric sensor solution depending on CTAB concentration after adding CN− in Example 2.
FIG. 4A is an image illustrating a change in color of a colorimetric sensor solution depending on a change in pH in Example 3.
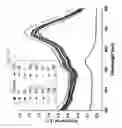
FIG. 4B is a graph illustrating an absorbance ratio (A538/A678) of a colorimetric sensor solution depending on a change in pH in Example 3.
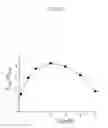
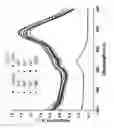
FIG. 5 is a graph illustrating an absorbance ratio (A538/A678) of a colorimetric sensor solution depending on reaction temperature after adding CN− in Example 4.
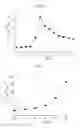
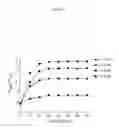
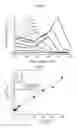
FIG. 6 is a graph illustrating an absorbance ratio (A538/A678) of a colorimetric sensor solution with time depending on CN− concentration in Example 5.
FIG. 7A is an image illustrating a change in color of a colorimetric sensor solution, when adding various anions and metal ions in Example 6.
FIGS. 7B and 7C are an image illustrating absorption spectra of a colorimetric sensor solution, when adding various anions and metal ions in Example 6.
FIG. 7D is a graph illustrating an absorbance ratio (A538/A678) of a colorimetric sensor solution, when adding various anions and metal ions in Example 6.
FIG. 8A is an image illustrating a change in color of a colorimetric sensor solution depending on CN− concentration in Example 7.
FIG. 8B is an absorption spectrum of a colorimetric sensor solution depending on CN− concentration in Example 7.
FIG. 8C is a calibration curve illustrating an absorbance ratio (A538/A678) of a colorimetric sensor solution depending on CN− concentration in Example 7.
FIG. 8D is a calibration curve illustrating a difference in maximum absorbance (AA) of a colorimetric sensor solution depending on CN− concentration in Example 7.
DETAILED DESCRIPTION
Example embodiments are described more fully hereinafter. The invention may, however, be embodied in many different forms and should not be construed as limited to the example embodiments set forth herein. Rather, these example embodiments are provided so that this disclosure will be thorough and complete, and will fully convey the scope of the invention to those skilled in the art. In the description, details of features and techniques may be omitted to more clearly disclose example embodiments.
The terminology used herein is for the purpose of describing particular embodiments only and is not intended to be limiting of the invention. As used herein, the singular forms “a,” “an” and “the” are intended to include the plural forms as well, unless the context clearly indicates otherwise. Furthermore, the use of the terms a, an, etc. do not denote a limitation of quantity, but rather denote the presence of at least one of the referenced item. The terms “first,” “second,” and the like do not imply any particular order, but are included to identify individual elements. Moreover, the use of the terms first, second, etc. do not denote any order or importance, but rather the terms first, second, etc. are used to distinguished one element from another.
Unless otherwise defined, all terms (including technical and scientific terms) used herein have the same meaning as commonly understood by one of ordinary skill in the art. It will be further understood that terms, such as those defined in commonly used dictionaries, should be interpreted as having a meaning that is consistent with their meaning in the context of the relevant art and the present disclosure, and will not be interpreted in an idealized or overly formal sense unless expressly so defined herein. All methods described herein can be performed in a suitable order unless otherwise indicated herein or otherwise clearly contradicted by context. The use of any and all examples, or exemplary language (e.g., “such as”), is intended merely to better illustrate the invention and does not pose a limitation on the scope of the invention unless otherwise claimed. No language in the specification should be construed as indicating any non-claimed element as essential to the practice of the invention as used herein.
According to example embodiments, the gold nanorods may be obtained as follows. When chlorauric acid hydrate (HAuCl4.H2O) is reduced with NaBH4 in the presence of cetyltrimethylammonium bromide (CTAB), Au(I) nanoparticle seeds having a size of at most 1.5 nm are produced from Au(III) ions. Then, the nanoparticle seeds are reduced into gold nanorods (AuNRs) with ascorbic acid in the presence of CTAB. Herein, AgNO3 may be added during the reduction to make the gold nanorods with a constant size and shape. The resultant gold nanorods show a surface plasmon resonance phenomenon as like nanoparticles.
According to example embodiments, it is possible to obtain a colorimetric sensor solution optimized for detection of a cyanide anion (CN−) by controlling the aspect ratio of nanorods, pH condition, and/or amount of a surfactant when producing gold nanorods in the above-described method.
FIG. 1 is a schematic view illustrating the process of etching gold nanorods with CN− according to an example embodiment.
Referring to FIG. 1, when adding a cyanide solution to gold nanorods surrounded with CTAB which is a surfactant, etching starts from the axial direction (i.e., the side having a shorter length) of nanorods by CN−, and thereby the rod-like shape is changed into an elliptical shape and then a spherical shape, and the gold nanorods are finally dissolved in the solution.
Herein, the color of the colorimetric sensor solution is changed, depending on etching degree, from a blue color to a purple, pink and a light pink color in turn with time, and finally becomes transparent.
Such a change in color is caused by the surface resonance phenomenon of the nanoparticles. The degree of a change in shape of the nanorods varies with the amount of CN−. For example, when CN− concentration is low, the nanorods are changed into an elliptical shape and do not undergo further etching reaction and a change in shape any longer.
The examples and experiments will now be described. It is intended that the present disclosure not be limited to the particular example embodiments disclosed, but that the present disclosure will include all embodiments, including modifications, equivalents and substitutes, falling within the scope of the appended claims.
Preparation Example 1: Preparation of Gold Nanorods
To 7.5 mL of 0.1 M CTAB, 0.25 mL of 0.01M HAuCl4 is added and the resultant mixture is agitated and stored with ice. To the mixture, 0.6 mL of 0.01M NaBH4 is added and mixed for 2 minutes, and the resultant mixture is stored at room temperature for 2 hours. At that time, the solution undergoes a change in color from a yellow color to a dark yellow color, and then to a light brown color. The resultant solution is used as a seed solution for forming nanorods.
Then, 0.2 mL of 10 mM AgNO3, 12 mL of 50 mM HAuCl4 and 95 mL of 0.1M CTAB are mixed at room temperature. To the resultant mixture, 0.48 mL of 0.2M ascorbic acid and 0.2 mL of the seed solution are added, and the mixture is allowed to stand for 20 minutes.
The photographic image of the resultant colorimetric sensor solution and TEM image of gold nanorods are shown in portion (a) of FIG. 2. The resultant gold nanorods have a size of at most 50 nm at the width and length. The solution has a dark blue color due to the surface resonance phenomenon of the nanorods.
Change in Color Caused by CN−
To the colorimetric sensor solution prepared in the above Preparation Example 1, CN− is added to a concentration of 0.2 mM. The photographic image of the resultant colorimetric sensor solution and TEM image of gold nanorods are shown in portion (b) of FIG. 2.
CN− is further added to the solution to a concentration of 0.4 mM. The photographic image of the resultant colorimetric sensor solution and TEM image of gold nanorods are shown in portion (c) of FIG. 2.
Referring to FIG. 2, the nanorods prepared in the Preparation Example 1 is etched after the addition of CN−, so that they are changed into an elliptical shape, and after CN− is further added, they are changed into a spherical shape.
Reactivity of Gold Nanoparticles Depending on Amount of CTAB
A colorimetric sensor solution is prepared in the same manner as the Preparation Example 1, except that the amount of CTAB is changed into 0 (control), 0.5, 1, 2, 3, 4, 5, 7.5, 10 and 20 mM. To each colorimetric sensor solution, CN− is added to a concentration of 0.35 mM and a reaction is carried out. FIG. 3A is a photographic image illustrating a change in color after the reaction.
As can be seen from FIG. 3A, when CTAB is added in an amount of 0-5 mM, etching of gold nanorods proceeds and the nanorods undergo a change in color from a blue color to a purple color. On the contrary, when CTAB is added in an amount of 20 mM, a blue color similar to the color of gold nanorods is observed, suggesting that etching is not carried out much. This is because CTAB surrounds the gold nanorods in most part thereof, and thus CN− etching cannot occur with ease even at the side of longitudinal direction as well as the side of axial direction. However, when the amount of the surfactant CTAB is low in the side of axial direction of the nanorods as shown in FIG. 1, contact with CN− occurs with ease.
FIG. 3B shows an absorbance ratio (A538/A678) depending on CTAB concentration in a range of CTAB concentration of 0-5 mM. Referring to FIG. 3B, the highest absorbance ratio appears at a CTAB concentration of 2 mM, which means the optimum reactivity.
Reactivity of Gold Nanoparticles Depending on pH
Samples having a pH of 1-13 are prepared by adjusting pH of the colorimetric sensor solution obtained in the Preparation Example 1. To adjust pH, 1M HCl and 1M NaOH are used. Then, CN− is added to each sample to a concentration of 0.35 mM. The photographic image of each sample is shown in FIG. 4A and the graph of absorbance ratio (A538/A678) determined by UV-Vis spectrometry is shown in FIG. 4B.
Referring to FIG. 4A, little change in color occurs at pH 4 or lower, which suggests that CN− does not react with gold nanorods. The reaction starts from pH 5 and a pink color is observed at pH 6-8, suggesting that the gold nanorods have a spherical shape.
Referring to the absorbance graph of FIG. 4B, the highest absorbance appears at pH 6 and then the absorbance is decreased gradually from pH 6. It can be seen from the above results that the colorimetric sensor solution shows the strongest reactivity at pH 6.
Reactivity of Gold Nanoparticles Depending on Reaction Temperature
After pH of the colorimetric sensor solution obtained in the Preparation Example 1 is adjusted to 6, six samples are prepared at a different temperature of 25° C. (room temperature), 30, 35, 40, 45 and 50° C. Then, CN− is added to each sample to a concentration of 0.35 mM, each sample is allowed to react for 25 minutes while maintaining the temperature, and then a change in color is observed. The absorbance ratio (A538/A678) of each sample is shown in FIG. 5.
After observing a change in color, it can be seen that the change in color as shown in FIG. 1 proceeds more rapidly, as the reaction temperature increases.
Referring to FIG. 5, a change in absorbance ratio at a temperature of 25-40° C. is not big but the absorbance ratio increases at 40° C. or higher. This is because the reactivity between nanorod particles and CN− increases. Therefore, it can be seen that a temperature of 40° C. or higher is suitable for increasing the reactivity between nanorods and CN−. In addition, since the absorbance ratio is 2.55 at 25° C. (room temperature) but the absorbance is 17.233 at 50° C., it can be seen that the reactivity at 50° C. is at least 6 times higher than the reactivity at room temperature. Therefore, in the example embodiments, it is possible to increase the reaction temperature adequately, if necessary for rapid detection of CN−.
Reaction Time Depending on CN− Concentration
The colorimetric sensor solution obtained in the Preparation Example 1 is adjusted to pH 6 and reaction is carried out at room temperature. After adding CN−to four samples to a concentration of 0.1, 0.2, 0.3 and 0.4 mM, the absorbance ratio (A538/A678) is measured continuously with time and the results are shown in FIG. 6.
Referring to FIG. 6, the absorbance increases rapidly by the time of 20 minutes at all concentrations of CN− and then increases gradually between 20 minutes and 30 minutes. Then, it can be seen that little reaction occurs from 30 minutes. Therefore, it is thought that under the above-mentioned condition, the reaction between gold nanorods and CN− is completed by the time of about 30 minutes, and the optimum time for CN− detection is 30 minutes.
Selectivity of Colorimetric Sensor Solution to Various Ions
The colorimetric sensor solution obtained in the Preparation Example 1 is adjusted to pH 6. To the colorimetric sensor solution at room temperature, 10 types of anions (ON−, F−, Cl−, Br−, I−, NO2−, NO3−, PO43−, SO42−, SCN−) and 14 types of cations (Ca2+, Cr6+, Li+, Na+, K+, Hg2+, Pb2+, Cd2+, Zn2+, Fe3+, Cr3+, Co2+, Cu2+, Mg2+) are added and reaction is carried out for 30 minutes, and then a change in color is observed. FIG. 7A is a photographic image of each sample after the reaction, FIGS. 7B and 7C are UV-Vis spectrum of each sample, and FIG. 7D is a graph of absorbance ratio (A538/A678).
In FIG. 7A, the colorimetric sensor solution to which ON− is added is changed into a pink color, which is significantly different from the colorimetric sensor solutions to which different anions and metal ions are added. This means that etching of gold nanorods occurs only by ON−.
In FIGS. 7B and 7C, the solutions to which different ions are added show absorbance spectra very similar to the absorbance spectrum of the colorimetric sensor solution, have absorption peaks at 524 nm, 584 nm and 680 nm, and show a very strong absorbance at 680 nm (blue). On the contrary, the solution to which ON− is added has no absorption peak at 680 nm and has an absorption peak at 538 nm (pink).
FIG. 7D shows spectrum of each sample in terms of an absorbance ratio. Unlike the other samples, the solution to which ON− is added shows an absorbance ratio at least 20 times higher as compared to the other samples. Such a high absorbance ratio means excellent selectivity to ON−.
Sensitivity and Calibration Curve of Colorimetric Sensor Solution
The colorimetric sensor solution obtained in the Preparation Example 1 is adjusted to pH 6, CN− is added to a concentration of 0.1, 0.2. 0.3 and 0.4 mM, and reaction is carried out at room temperature for 30 minutes.
FIG. 8A is a photographic image illustrating a change in color depending on CN− concentration and FIG. 8B is an absorption spectrum depending on CN− concentration. FIG. 8C is a calibration curve of absorbance ratio (A538/A678) and provides excellent results with a linear calibration equation of y=0.01172x+0.7538 and an absorption coefficient (r2) of 0.99182. The following Table 1 shows the values in the graph of FIG. 8C in more detail.
| TABLE 1 | ||||
| Equation | Y = a + b*x | — | — | |
| Weight | instrumental | — | — | |
| Residual sum of | 0.81538 | — | — | |
| squares (RSS) | ||||
| Pearson's r | 0.99631 | — | — | |
| Adj. R-Square | 0.99182 | — | — | |
| — | — | Value | Standard error | |
| B | Intercept | 0.7538 | 0.07473 | |
| Slope | 0.01172 | 3.36394 × 10⁻⁴ | ||
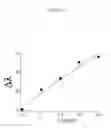
FIG. 8D is a calibration curve of the difference (Δλ) between the maximum absorbance of the colorimetric sensor solution (control) and the maximum absorbance of each sample having a different concentration. The maximum absorbance difference (Δλ) depending on ON− is 0-140 nm, and excellent results are obtained with a linear calibration equation of y=355x+9.6 and an absorption coefficient (r2) of 0.9619. The following Table 2 shows the detailed values regarding the graph of FIG. 8D.
| TABLE 2 | ||||
| Equation | Y = a + b*x | — | — | |
| Weight | instrumental | — | — | |
| Residual sum of | 370 | — | — | |
| squares (RSS) | ||||
| Pearson's r | 0.98561 | — | — | |
| Adj. R-Square | 0.9619 | — | — | |
| — | — | Value | Standard error | |
| B | Intercept | 9.6 | 8.61046 | |
| Slope | 355 | 35.152 | ||
Evaluation of Effectiveness of Colorimetric Sensor Solution
To carry out a test of ON− detection in mineral water, commercially available mineral water is purchased and is determined whether it contains ON− or not. Then, validation is carried out according to the present disclosure and mineral water free from ON− after the determination is used as a blank sample.
To a blank sample, CN− is added to 0.1 and 0.3 mM to provide samples. Then, the absorbance of each sample is determined by UV-Vis spectrometry and the calibration curve prepared in Example 7 is used to determine the detected amount, coefficient of variation (CV) and recovery (%). The results are shown in the following Table 3.
| TABLE 3 | ||||
| CN− | Detected | CV | Limit of | |
| addition | concentration | (Coefficient | Recovery | Detection |
| (mM) | (mM) | of Variation) | (%) | (nM) |
| 0.1 | 0.1024 ± 0.0035 | 0.0349 | 102.4 ± 3.577 | 0.5 |
| 0.3 | 0.302 ± 0.0052 | 0.0171 | 100.9 ± 1.731 | |
As shown in Table 3, the limit of detection (LOD) of CN− using the colorimetric sensor solution according to the example embodiments is 0.5 nM. In the samples to which CN− is added to a concentration of 0.1 and 0.3 mM, the detected amounts are 0.1024±0.0035 and 0.302±0.0052, respectively, which very nearly approach the actual addition amounts. In addition, excellent coefficients of variation of 0.0349 and 0.0171 are obtained along with high recovery ratios of 102.4±3.577 and 100.9±1.731. In general, there have been many hindrance factors in real-time on-site detection of CN− in products with various compositions, such as environmentally contaminated samples, forensic science samples, drinking water, medicines or industrial sites where chemicals are treated, etc. However, the colorimetric sensor solution including gold nanorods according to the example embodiments of the present disclosure shows excellent performance and has high selectivity.
While the example embodiments have been shown and described, many modifications can be made to adapt a particular situation or material to the teachings of the present disclosure without departing from the essential scope thereof. Therefore, it is intended that the present disclosure not be limited to the particular example embodiments disclosed herein, but that the present disclosure will include all embodiments falling within the scope of the appended claims.
Claims
What is claimed is:1. A colorimetric detection sensor for detecting a cyanide anion (CN−), comprising gold nanorods having an aspect ratio of 0.29-1.
2. The colorimetric detection sensor according to claim 1, wherein the aspect ratio of the gold nanorods is 0.7-0.8.
3. The colorimetric detection sensor according to claim 1, wherein the gold nanorods have a size of 50 nm or less.
4. The colorimetric detection sensor according to claim 1, wherein the rod-shaped gold nanorods are etched by CN− so that the rod-shaped gold nanorods are changed into a spherical shape, and thereby show a change in color due to a surface resonance phenomenon.
5. The colorimetric detection sensor according to claim 4, wherein the color of the colorimetric detection sensor changes from a blue color to a purple color, a pink color or transparency.
6. The colorimetric detection sensor according to claim 1, wherein the colorimetric detection sensor comprises cetyltrimethylammonium bromide (CTAB), which is a surfactant, at a concentration of 1-3 mM.
7. The colorimetric detection sensor according to claim 1, wherein the colorimetric detection sensor detects CN− in a range of pH 6-8.
8. The colorimetric detection sensor according to claim 1, wherein the colorimetric detection sensor detects CN− at pH 6.
9. The colorimetric detection sensor according to claim 1, wherein the colorimetric detection sensor detects CN− at a temperature ranging from room temperature to 50° C.
10. The colorimetric detection sensor according to claim 1, wherein a detection reaction of CN− is carried out within 30 minutes.
11. The colorimetric detection sensor according to claim 1, wherein a concentration of detected CN− is quantitatively determined by measuring a change in color of the colorimetric detection sensor with a spectrophotometer or colorimeter.
12. A colorimetric detection method for detecting CN−, which comprises:
introducing a sample to be detected to a colorimetric detection sensor; and
detecting 0.01 ppm or higher of CN− in the sample to be detected by a change in color of the colorimetric detection sensor,
wherein the colorimetric detection sensor includes gold nanorods having an aspect ratio of 0.29-1.
13. The colorimetric detection method according to claim 12, which further comprises, before introducing the sample, adjusting pH and temperature of the colorimetric detection sensor to enhance stability and sensitivity of the nanorods.
14. The colorimetric detection method according to claim 12, wherein the colorimetric detection sensor shows color emission in a wavelength range of 450 nm-700 nm in the introducing, and shows color emission in a wavelength range of 500 nm-600 nm when ON− is present in the sample to be detected in the detecting.
15. The colorimetric detection method according to claim 12, wherein the colorimetric sensor has an absorbance ratio (A538/A679) of 0.5-10 in the detecting.
Images & Drawings included:


Sources:
- United States Patent and Trademark Office - verify current appl. status at the USPTO↗
Recent applications in this class:
- » 20250277748 2025-09-04
STABLE UV INDICATOR - » 20250258105 2025-08-14
ION DETECTION WITHOUT OPTICAL INTERFERENCE FROM SAMPLES - » 20250244250 2025-07-31
COMPOSITIONS, APPARATUS AND METHODS FOR DETERMINING ALKALINITY OF AN ANALYTE SOLUTION - » 20250237612 2025-07-24
FLUID SAFETY DEVICE FOR DETECTING AND MONITORING SPOILAGE OF PERISHABLE FLUIDS - » 20250116607 2025-04-10
COMPOSITIONS AND METHODS FOR THE ASSESSMENT OF SOIL QUALITY - » 20240255433 2024-08-01
APPARATUS AND METHOD FOR CALIBRATING MEASURING DEVICES FOR DLR MEASUREMENT WITH OPTOCHEMICAL PH SENSORS - » 20240201092 2024-06-20
INDICATOR RAPIDLY RESPONDING TO SUBTLE PH CHANGE - » 20240027356 2024-01-25
METHODS AND SYSTEMS FOR DETERMINING AN IONIC STRENGTH OF A DILUTE AQUEOUS SOLUTION - » 20230393076 2023-12-07
AUTOMATED ONLINE MINERAL SLURRY AND PROCESS WATER PH ANALYZER, QUANTITATIVE VOLUMETRIC TITRATION ANALYZER, AND LIQUID HARDNESS ANALYZER - » 20230314331 2023-10-05
Optical Sensor System for Quantitative Colorimetric Liquid Analysis
Recent applications for this Assignee:
- » 20250294796 2025-09-18
GATE ALL AROUND FIELD EFFECT TRANSISTOR HAVING MULTIPLE GATE STACK STRUCTURE AND FABRICATION METHOD THEREFOR - » 20250288978 2025-09-18
MULTI-ELEMENT CATALYST INCLUDING INTERMETALLIC ALLOY NANOPARTICLES AND METHOD FOR PREPARING THE SAME - » 20250286083 2025-09-11
METHOD OF MANUFACTURING CATALYST AND ELECTRODE USING SUPERCRITICAL FLUID - » 20250281415 2025-09-11
EXOSOMES EXPRESSING RSVF AND USE THEREOF - » 20250280550 2025-09-04
CAPACITOR AND METHOD FOR MANUFACTURING THE SAME - » 20250278659 2025-09-04
SYSTEM FOR CALCULATING QUANTUM CHEMISTRY BASED ON QUDIT - » 20250250454 2025-08-07
MXene SURFACE-MODIFIED WITH METAL ALKOXIDE AND PREPARATION METHOD THEREOF - » 20250250324 2025-08-07
NOVEL FUSION PROTEIN FOR ELIMINATING NEURODEGENERATIVE DISEASE-CAUSING FACTOR AND USE THEREOF - » 20250246640 2025-07-31
ELECTRODE COMPRISING CERIA NANOTUBE ANTIOXIDANT, AND MEMBRANE-ELECTRODE ASSEMBLY AND FUEL CELL COMPRISING THE SAME - » 20250239968 2025-07-24
THREE-DIMENSIONAL SOLAR POWER GENERATION SYSTEM FOR SMART FARMS