Graphene materials and improved methods of making, drying, and applications
US20190169033A1
2019-06-06
16/313,726
2017-08-01
✅ Patent granted
US 10,995,003 B2
2021-05-04
WO; PCT/IB2017/054680; 20170801
WO; WO2018/033816; 20180222
Richard M Rump
Patent Portfolio
2037-08-31
Abstract:
The impact of post-synthesis processing in, for example, graphene oxid or reduced graphene oxide materials for super-capacitor electrodes has been analyzed. A comparative study of vacuum, freeze and critical poin drying was carried out for graphene oxide or hydrothermally reduced graphene oxide demonstrating that the optimization of the specific surface area and preservation of the porous network is important to maximize its properties such as supercapacitance performance. As described below, using a supercritical fluid as the drying medium, unprecedented values of specific surface area (e.g., 364 m2g−1) and supercapacitance (e.g., 441 F g−1) for this class of materials were achieved.
Inventors:
- Amira Salman ALAZMI 2 🇸🇦 Thuwal, Saudi Arabia
- Pedro Miguel DA COSTA 1 🇸🇦 Thuwal, Saudi Arabia
Assignee:
- King Abdullah University of Science and Technology 699 🇸🇦 Thuwal, Saudi Arabia
Applicant:
Interested in similar patents?
Get notified when new applications in this technology area are published.
Classification:
C01B2204/22 » CPC further
Structure or properties of graphene; Graphene characterized by its properties Electronic properties
C01B2204/32 » CPC further
Structure or properties of graphene; Graphene characterized by its properties Size or surface area
C01P2002/72 » CPC further
Crystal-structural characteristics defined by measured X-ray, neutron or electron diffraction data by d-values or two theta-values, e.g. as X-ray diagram
C01P2004/03 » CPC further
Particle morphology depicted by an image obtained by SEM
C01P2006/12 » CPC further
Physical properties of inorganic compounds Surface area
H01G11/86 » CPC further
Hybrid capacitors, i.e. capacitors having different positive and negative electrodes; Electric double-layer [EDL] capacitors; Processes for the manufacture thereof or of parts thereof; Processes for the manufacture of hybrid or EDL capacitors, or components thereof specially adapted for electrodes
Y02E60/13 » CPC further
Enabling technologies; Technologies with a potential or indirect contribution to GHG emissions mitigation Energy storage using capacitors
Y02E60/13 » CPC further
Enabling technologies; Technologies with a potential or indirect contribution to GHG emissions mitigation Energy storage using capacitors
C01B32/184 » CPC further
Carbon; Compounds thereof; Nano-sized carbon materials; Graphene Preparation
H01G11/32 » CPC further
Hybrid capacitors, i.e. capacitors having different positive and negative electrodes; Electric double-layer [EDL] capacitors; Processes for the manufacture thereof or of parts thereof; Electrodes characterised by their material Carbon-based
H01G11/36 » CPC further
Hybrid capacitors, i.e. capacitors having different positive and negative electrodes; Electric double-layer [EDL] capacitors; Processes for the manufacture thereof or of parts thereof; Electrodes characterised by their material; Carbon-based Nanostructures, e.g. nanofibres, nanotubes or fullerenes
C01B32/182 » CPC further
Carbon; Compounds thereof; Nano-sized carbon materials Graphene
H01G11/24 » CPC further
Hybrid capacitors, i.e. capacitors having different positive and negative electrodes; Electric double-layer [EDL] capacitors; Processes for the manufacture thereof or of parts thereof; Electrodes characterised by structural features of the materials making up or comprised in the electrodes, e.g. form, surface area or porosity; characterised by the structural features of powders or particles used therefor
C01P2006/17 » CPC further
Physical properties of inorganic compounds; Pore diameter Pore diameter distribution
C01P2006/40 » CPC further
Physical properties of inorganic compounds Electric properties
Y02P20/54 » CPC further
Technologies relating to chemical industry; Improvements relating to the production of bulk chemicals using solvents, e.g. supercritical solvents or ionic liquids
Y02P20/54 » CPC further
Technologies relating to chemical industry; Improvements relating to the production of bulk chemicals using solvents, e.g. supercritical solvents or ionic liquids
C01B32/198 » CPC main
Carbon; Compounds thereof; Nano-sized carbon materials; Graphene Graphene oxide
Description
INTRODUCTION
Graphene flakes can be produced in large scale by reducing graphene oxide (GO).1 Methods to carry out this reaction are varied and include the use of chemicals such as hydrazine2 or sodium borohydride.3 Thermal and hydrothermal treatments are two other popular reduction routes4, 5. The latter is also commonly used to decorate graphene flakes with a range of nanoparticles, sometimes in tandem with the reduction of the parent GO.6-10 These composite materials have been proposed for applications in, for example, catalysis11-13, energy storage/conversion14, 15 16, optics17 and drug delivery.18 Given that reduced graphene oxide (rGO) is a promising material for electrochemical double layer capacitor (EDLC) electrodes, it is important that its specific surface area be maximized. However, a literature search reveals that, to the best of the inventors' knowledge, most reported hydrothermally-reduced graphene oxide composites have a relatively low surface area, <100 m2 g−1.19-21 In this respect, a key step is the solvent-drying process after extracting the rGO product from the autoclave. The most common approach is air or vacuum drying under mild temperatures (<100° C.), a method that has been found to induce the agglomeration of rGO flakes.22-24 Briefly, the porous structure of the “wet” rGO collapses upon drying as it is subjected to surface tension and capillary forces. One less-commonly used approach, which has been used in the preparation of aerogel materials, is freeze drying.25 This process consists of removing water from frozen material by sublimation and desorption under vacuum. However, various stresses are generated during the freezing and drying steps, particularly due to the so called bound water (the small percentage of water that remains in the liquid state and does not freeze). Whether employing air, vacuum or freeze drying, residual humidity and induced stresses are two common factors in these methods that considerably defeat the purpose of obtaining high surface area, dry rGO powders (FIG. 1).
SUMMARY
One possible way to avert the agglomeration and various stresses of the materials is to use CPD, employed in the preparation of biological specimens (e.g. plant tissue) for electron microscopy imaging26-28. However, to the best of the inventors' knowledge, its application to drying of powdered carbon materials such as rGO is not explored yet. In the case of hydrothermally-reduced GO, the water would be exchanged by the intermediate dehydration liquid, such as ethanol, which would in turn be replaced by supercritical CO2. In the absence of a liquid-air phase boundary, surface tension is eliminated and, upon, release of the CO2 as gas, the dry, porous rGO could be collected (FIGS. 1 and 6).
Having surveyed the literature, the embodiments described and/or claimed herein appear to be the first time that CPD has been employed as a drying process for, for example, rGO. More importantly, there is no real appreciation of how the drying step may influence the properties of rGO materials such as their capacitance performance or other electrochemical properties. To address this issue, we compared the effect of employing vacuum, freeze and CPD drying methods on the morphology, specific surface area, porosity and electrochemistry of hydrothermally-reduced GO. In one embodiment, for sake of clarity, the method is not used with, for, or to produce an aerogel material.
Embodiments described and/or claimed herein include improved compositions, materials, devices, instrumentation, and systems, as well as methods of making and using such compositions, materials, devices, instrumentation, and systems. More particularly, an objective was to replace the vacuum drying method by an alternative approach capable of leading to weak residual humidity and weak stresses during drying, providing for improved compositions and materials. Devices such as supercapacitors can be prepared with use of the compositions and materials described herein.
Particular embodiments include, for example, a composition comprising graphene oxide or reduced graphene oxide which is mesoporous and has a specific surface area of at least 364 m2/g (“embodiment A”). Another embodiment is an electrode composition which comprises the composition A, wherein the electrode composition has a supercapacitance of at least 441 F/g. In another embodiment, the graphene oxide or reduced graphene oxide shows from a BET surface analysis the presence of micropores and mesopores. In one embodiment, the graphene oxide or reduced graphene oxide, when dried to a powder material with a critical point dryer, shows a predominance of mesopores over micropores and macropores, identifiable by gas adsorption analysis. In one embodiment, the predominance of mesopores results in the improvement of a specific capacitance and/or a gas adsorption capability for the graphene oxide or reduced graphene oxide.
Another embodiment provides for a composition (which can be called “embodiment one”) prepared by a method comprising: critical point drying at least one graphene oxide material or reduced graphene oxide material with use of a critical point dryer to produce a dried graphene oxide material or a dried reduced graphene oxide material, wherein the critical point dryer is used with a sample holder comprising metal mesh, optionally the metal mesh having pores having a pore width of 500 microns or less, or 250 microns or less, or 150 microns or less, or 50 microns to 250 microns. The dried graphene oxide material can be subjected to hydrothermal reduction to form reduced graphene oxide.
In one embodiment, the graphene oxide or reduced graphene oxide has a specific surface area of at least 364 m2/g.
In one embodiment, the graphene oxide or reduced graphene oxide shows from a BET surface analysis the presence of micropores and mesopores.
In one embodiment, an electrode composition comprises a composition of “embodiment A” or “embodiment one,” or any other composition described herein, wherein the electrode composition has a supercapacitance of at least 441 F/g.
Another embodiment provides for a method comprising: critical point drying at least one graphene oxide material or reduced graphene oxide material with use of a critical point dryer to produce a dried graphene oxide material, wherein the critical point dryer is used with a sample holder comprising metal mesh, optionally the metal mesh having pores having a pore width of 500 microns or less, or 250 microns or less, or 150 microns or less, or 50 microns to 250 microns. The dried graphene oxide material can be subjected to hydrothermal reduction to form reduced graphene oxide.
In one embodiment, the metal mesh is stainless steel mesh. In another embodiment, the sample holder comprises walls of a fluorinated polymer, optionally polytetrafluoroethylene.
In another embodiment, the at least one graphene oxide material is an improved graphene oxide material.
In another embodiment, the hydrothermal reduction is carried out at a temperature of at least 150° C.
Another embodiment provides for a critical point dryer comprising a system for critical point drying and also supporting an interchangeable sample holder, wherein dryer comprises the interchangeable sample holder and the interchangeable sample holder comprises metal mesh, optionally with pores having a pore width of 500 microns or less.
In sum, the selection of the post-synthesis drying approach for hydrothermally reduced GO plays a significant role in controlling properties such as, for example, the surface area, porosity and electrochemical response of this material. By creatively fine tuning this step, record high specific surface area and capacitance can be achieved for the rGO/CPD product (364 cm2g−1 and 441 Fg−1, respectively). Therefore, it is likely that the preservation of the porous network in rGO materials for supercapacitor electrodes provides: (i) higher capacitance levels; (ii) faster electron transport during the charge/discharge processes; and/or (iii) better transport pathways for solvated ions. Customizing the size of the mesopores can further improve the capacitance performance of these materials.
BRIEF DESCRIPTION OF THE FIGURES
FIG. 1 provides a schematic illustration of the various drying processes available for rGO. CPD is known to preserve porous three-dimensional networks upon water extraction as opposed to approaches based in vacuum or freeze drying that result in pore collapse.
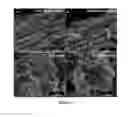
FIG. 2 provides SEM images of: (a) rGO/vacuum; (b) rGO/freeze; (c-d) rGO/CPD.
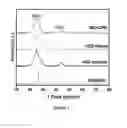
FIG. 3 shows (a) Nitrogen adsorption-desorption isotherms; (b) pore-size distributions for N2 (calculated by using a slit DFT slit model). For FIG. 3(b), this signature is unique to CPD dried rGO; this defines the mesoporous range (2-50 nm) of pore size.
FIG. 4 shows (a) CV curves of rGO/vacuum, rGO/freeze, and rGO/CPD in 1M H2504 at a scan rate of 100 mV s−1; (b) Galvanostatic charge-discharge curves at a constant current density of 1 A g−1; (c) Specific capacitance of rGO/CPD at different current densities; (d) Cyclic performance of rGO/CPD at a current density of 1 A g−1.
FIG. 5 provides SEM images of the (a-b) rGO/vacuum and (c-d) rGO/CPD samples. It is easily recognizable that the separation of the layers in the CPD product is more regular/homogenous across the entire sample, i.e. not restricted to a particular aggregate or parts of this.
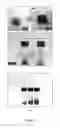
FIG. 6 provides digital photos of: (a) the wet rGO, (b) the rGO in (a) after CPD processing, (c) two vials with 100 mg each of dried rGO products, (d) two vials from FIG. 6c, but also third vial shown with freeze-dried rGO—the higher volume occupied by the rGO/CPD compared to vacuumed dried rGO and freeze-dried rGO is notable. Example is shown for rGO but applies equally to GO.
FIG. 7 provides powder XRD patterns of the graphite precursor, rGO/vacuum, rGO/freeze and rGO/CPD samples. The rGOs have equal spectra precluding therefore structural dissimilarities.
FIG. 8 shows high resolution XPS C1s spectra of (a) rGO/CPD, (b) rGO/freeze and (c) rGO/vacuum samples. The deconvolution of the C1s peak confirms the equivalent chemical identity in the three samples. The high-resolution C 1s spectrum was convoluted for rGO/vacuum, rGO/freeze and rGO/CPD. The spectrum shows an intense peak of C═C (sp2 arrangement) located at 284.4 eV. Besides the C═C peak, the C 1s spectrum deconvolution identified five other bands: sp3 (285.3 eV), C—OH (286.4 eV), C═O (288.0 eV), O—C═O (288.9) and the π-π* satellite peak (290.8 eV). The relative concentration (atomic %) of the components was calculated using the CasaXPS software: C═C 65%, sp3 13%, C—OH 11%, C═O 5%, O—C═O 3% and Pi-Pi* 3%.
FIG. 9 shows nitrogen adsorption-desorption isotherms of: (a) rGO-vacuum, (b) rGO-freeze.
FIG. 10 shows pore-size distribution profiles from adsorption of N2 on the studied rGO materials (calculated using the BJH method). See also FIG. 3.
FIG. 11 shows cyclic performance of a rGO/CPD sample, at a current density of 1 A g−1 in H2SO4. The capacitance is well retained throughout, at more than 400 F g−1.
FIG. 12 shows drawings in different perspectives for two embodiments for a smaller volume (left) and a larger volume (right) sample cell for CPD use.
FIG. 13 also shows drawings in different perspectives for two embodiments for a smaller volume (left) and a larger volume (right) sample cell but without the metal mesh or fasteners.
FIG. 14 shows the metal mesh in top view and perspective view.
FIG. 15 shows an embodiment for (a) schematic diagram of a CO2 critical point drying vessel and images of (b) the CO2 critical point dryer and (c) the microfiltration Teflon vessel.
FIG. 16 shows additional specific surface areas reported in the literature for rGO using the hydrothermal reduction method (see also Table II).
FIG. 17 shows more data for GO—N2 adsorption-desorption isotherm and pore-size distributions with particular focus on gas absorption application.
FIG. 18 shows GO—CO2 storage capacity.
FIG. 19 shows CO2 storage capacity from literature.
DETAILED DESCRIPTION
Introduction
U.S. provisional filing Ser. No. 62/375,852 filed Aug. 16, 2016 is hereby incorporated by reference in its entirety.
All references cited herein are incorporated herein by reference in their entirety.
Open transitional terms such as “comprising” or “comprises” can be substituted if desired for particular embodiments with partially closed or closed terms such as “consisting essentially of,” “consists essentially of,” “consists of,” or “consisting of.”
One aspect provides a method comprising: critical point drying at least one graphene oxide material or reduced graphene oxide material with use of a critical point dryer to produce a dried graphene oxide material or reduced graphene oxide material, wherein the critical point dryer is used with a sample holder comprising metal mesh, optionally with pores having a pore width of 500 microns or less, or 250 microns or less, or 150 microns or less, or 50 microns to 250 microns. Another aspect is a composition or material prepared by the methods described herein. In one embodiment, the composition or material has a specific surface area of at least 364 m2/g. In another embodiment, a supercapacitor can be prepared having a supercapacitance of at least 441 F/g. More detailed description for these and other aspects are provided.
Critical Point Drying Method
Critical point drying (CPD) is generally known in the art, and instrumentation for carrying out CPD (critical point dryers, accessories, and materials) are available commercially. The sample holder and larger instrumentation for critical point drying are described further hereinbelow. Examples of CPD in the patent literature include US Patent Publications 2015/0216162; 2015/0079669; 2013/0239996; and 2013/0056036.
Any of the powders described herein, including graphene oxide and reduced graphene oxide, can be subjected to CPD as described herein.
Graphene Oxide Materials
Graphene oxide (GO) materials are known in the art, as illustrated by the references cited herein, for example. The material can be in powder form. The material can be in different forms derived from the drying step as per the methods described herein. The GO material can be subjected to CPD. The GO material subjected to CPD can also undergo hydrothermal reduction and then subjected once again to CPD. The GO subjected to CPD can undergo further processing steps. The hydrothermally reduced GO subjected to CPD can also undergo further processing steps. The CPD-dried GO and reduced GO (or related processed materials) can be subjected to characterization at any one of these points in the method when it is in any of these forms. In one embodiment, the so-called “improved graphene oxide” can be used.
Hydrothermal Reduction Step
After the critical point drying step for graphene oxide, the dried graphene oxide material can be further subjected to hydrothermal reduction which is a process known in the art. Additional critical point drying can be carried out on the reduced graphene oxide material.
Characterization of Product
The graphene product can be characterized by methods known in the art. Characterization methods include characterization methods known for carbon materials, including graphene materials, such as, for example, SEM, TEM, surface area, BET specific surface area, XPS, X-ray powder diffraction, FT-IR, Raman spectroscopy, AFM, TGA, DSC, electronic conductivity measurements, cyclic voltammetry, chronopotentiometry, and other methods known in the art.
In one embodiment, the graphene oxide or reduced graphene oxide shows an open lamellar morphology with sets of nanosheet stacks visible in SEM micrographs. The SEM method is further described in the working examples and figures herein.
BET surface area analysis is known in the art. The method is further described in the working examples and figures herein. In one embodiment, a BET surface area of the graphene oxide or reduced graphene oxide is at least 150 m2g−1, or at least 200 m2g−1, or at least 250 m2g−1, or at least 300 m2g−1, or at least 350 m2g−1, or at least 364 M2g−1, or at least 400 m2g−1.
The graphene oxide or reduced graphene oxide can also provide for high supercapacitance values such as, for example, at least 300 F/g, or at least 400 F/g, or at least 441 F/g.
Critical Point Dryer Instruments and Systems
Critical point dryers are commercially available and come with accessories, instruction manuals, hardware, and software. The dryers can be semi-automated or automated.
The dryers can be adapted to have interchangeable sample holders. The sample holder can be modified depending on the sample to be analyzed. The sample holder can be adapted for the drying of powders.
FIGS. 12-15 show embodiments for a sample holder which can be used for the critical point drying.
FIG. 12 shows a smaller volume sample holder (left, Sample Holder 1) and a larger volume sample holder (right, Sample Holder 2), showing for each top, side (cross-sectional), and perspective views. Sample Holder 1 has a height of 15 mm, whereas Sample Holder 2 has a height of 50 mm. One can adapt the size of the sample holder to the volume of the sample. Typical volumes can be, for example, 5 mL to 100 mL, or 10 mL to 50 mL. In this embodiment, element 1 is a cylindrically-shaped polytetrafluoroethylene vessel, and element 2 is a stainless steel screen or mesh having an 125 micron micropore size. More generally, the screen mesh can be, for example, 10 microns to 150 microns, or 50 microns to 150 microns, or 100 microns to 150 microns. Even more generally, the sample holder comprising metal mesh can have pores adapted for powder drying, including small particle size powder drying, having a pore width of, for example, 500 microns or less, or 250 microns or less, or 150 microns or less, or 50 microns to 250 microns, or 50 microns to 150 microns, or 100 microns to 150 microns. The screen can be used on the top and bottom of the holder. Other materials and sizes can be used. In some embodiments, no special tools are needed to handle the sample holder. Fasteners such as slotted pan head screws can be used to hold the metal mesh to the cell.
FIG. 13 shows again smaller and larger size embodiments for two sample holders but without the metal mesh or fasteners. Again, top, side (cross-sectional), and perspective views are provided. The only difference between the two sample holders is in their height (again, 15 versus 50 mm).
FIG. 14 shows an embodiment for the metal mesh in top view and perspective view. The metal mesh can be in a generally circular form. Openings can be provided to function with the fasteners. The thickness of the metal mesh can be, for example, 1 mm to 2 mm. The metal mesh can be made from, for example, metal such as, for example, steel including, for example, stainless steel.
FIG. 15 shows in an embodiment (a) schematic diagram of a CO2 critical point drying vessel and images of (b) the CO2 critical point dryer and (c) the microfiltration polytetrafluoroethylene vessel. For handling and processing of powder materials, a sample holder with filtration micropores can be designed and installed in a critical point drying chamber (e.g., Leica EM CPD 300), as shown in FIG. 15. With this sample holder, the intermediate solvent (e.g. ethanol) can be exchange with liquid CO2 without losing the powder materials. Therefore, the powder materials can be collected after the drying process.
Companies offering CPD instrumentation include, for example, Leica Microsystems (Buffalo Grove, Ill.), tousimis (Rockville, Md.), Electron Microscopy Sciences (EMS, Hatfield, Pa.), and SPI Supplies/Structure Probe (West Chester, Pa.).
WORKING EXAMPLES: EXPERIMENTAL
Additional embodiments are provided in the non-limiting working examples provided herein.
The preparation of the rGO materials was carried out using two steps. Firstly, the oxidation of graphite powder followed the procedure outlined in our previous work (adapted from the so-called improved Hummers' method)29, 30.
The conventional oxidation method of graphene oxide (GO) is the Hummers' method (KMnO4, NaNO3, H2SO4), which is the most common approach used to produce GO. In this work, the so-called improved-Hummers' method (KMnO4, 9:1 H2SO4/H3PO4) was used. In this regard,
Tour et al. have demonstrated that preparing GO in 9:1 H2SO4/H3PO4 while excluding NaNO3 clearly improves the efficiency of the oxidation process and subsequently the quality of the produced GO29. Overall, the amounts used and conditions employed were also in order with those commonly described in the literature (see, for example, cited references 1, 29, and 42-44 hereinbelow). In our previous work, we demonstrated that the reduced graphene oxide materials are highly dependent on the oxidation-reduction strategy selected which could influence (if not dominate) their performance for some of the applications proposed in the literature (e.g. supercapacitors)30.
Next, the GO product was divided into three equal parts: the first was dried in vacuum at 60° C. for 12 h, the second was freeze-dried under reduced pressure (0.133 mbar) for 24 hours and the third part was dried by CPD (in CO2). Then, the reduction of the dried GO parts was undertaken through a hydrothermal method (at 180° C. for 24 h). This was followed by a drying step similar to, and consistent with, the one used for the parent GO part. The dried hydrothermal rGO products are hereafter designated as rGO/vacuum, rGO/freeze and rGO/CPD.
Further details on structural, chemical and electrochemical characterization can be found in the supplementary information described below.
Results and Discussion
Concerning the morphology and size of the rGO aggregates, scanning electron microscopy (SEM) and optical imaging suggest there is a visible effect when using varied drying methods (FIGS. 2, 5, and 6). Of the three hydrothermal rGO samples studied (rGO/vacuum, rGO/freeze and rGO/CPD), the one dried with CPD clearly exhibited the finest and most consistent separation of the graphitic basal planes (FIGS. 2c and 2d, cf. also FIGS. 5c and 5d). Moreover, visual comparison of the products shows that, for identical mass, the rGO/CPD occupies a larger volume (FIG. 6). This attests the network collapse upon vacuum and freeze drying.
X-ray powder diffraction (XRD) and photoelectron spectroscopy (XPS) analyses were performed to compare the structure and surface chemistry of the rGOs as well as to assess the effectiveness of the reduction step. All samples exhibited two broad diffraction peaks at 2θ=25° and 43° , which were assigned to the (002) and (101) planes of graphite, respectively (FIG. 7).31 The structural and chemical similarity of the rGOs was further confirmed by the high resolution XPS study of the C1 s peak, as shown in FIG. 8. Hence, independently of the drying method employed, the final products had equivalent reduction levels, structure and surface chemistry.
N2 adsorption/desorption measurements were performed at 77 K to characterize the specific surface area and pore size distribution of the rGO materials (FIG. 3). The three isotherms in FIG. 3a are of type IV indicating the presence of mesopores, as per the IUPAC classification.32 While similar in type, the isotherms show significant differences in N2 uptake and shape of the hysteresis loop. Accordingly, the rGO/vacuum and rGO/freeze exhibited type H3 loops (FIG. 9), which are identified with plate-like porous aggregates as these originate slit-shaped interlayer pores.33 In contrast, the rGO/CPD has a type H2 hysteresis response. This reveals the presence of a congruent network of interconnected pores. In addition, this sample showed large N2 uptake which could be correlated with a total pore volume of 1.17 cm3 g−1 and a Brunauer-Emmet-Teller (BET) specific surface area of 364 m2 g−1. This area is one order of magnitude higher than those of the rGO/vacuum and rGO/freeze samples (Table 1). As previously stated, reported values for hydrothermal rGO, and respective composites, are usually <100 m2/g. (see also Table II and FIG. 16)19,21,20,21.34.
| TABLE 1 |
| Specific surface area and pore structure |
| of the rGO materials studied. |
| t-Plot |
| BET | external | t-Plot | |||
| surface | Pore | Micropore | surface | micropore | |
| area | volume | Area | area | volume | |
| material | (m2/g) | (cm3/g) | (m2/g) | (m2/g) | (cm3/g) |
| rGO/vacuum | 39 | 0.06 | 11 | 27 | 0.005 |
| rGO/freeze | 28 | 0.15 | 1 | 27 | <0.001 |
| rGO/CPD | 364 | 1.17 | 45 | 318 | 0.023 |
Pore size distribution has been assessed by means of the Barrett-Joyner-Halenda (BJH) adsorption method and density functional theory (DFT) assuming slit pore shapes (FIGS. 10 and 3b, respectively). Although the textural analysis shows pores <2 nm in size for both rGO/vacuum and rGO/CPD, these account little in the overall porosity, as per the micropore volume and area values extracted from t-plots (see Table 1). Interestingly, the presence of micropores is absent in the rGO/freeze sample. From the BJH and DFT pore size distribution profiles, it is obvious why the rGO/CPD shows superior surface area. With a width range of about 1 nm to more than 75 nm, the largest contribution (mode) originates from 20 nm sized mesopores. Note that, at the critical point of CO2 (304.1 K, 7.39 MPa), the exchange of molecules between the gas and fluid phases is balanced and the density of the fluid and gas phases is equal. The absence of a liquid-gas interface (surface tension is zero) is crucial to retain the original rGO nanosheets' network (no structural collapse, as schematised in FIG. 1). Furthermore, it is plausible that additional layer/nanosheet separation can be promoted by the expansion/release of intercalated CO2.35 Overall, the rGO/CPD is a mesoporous material with a relatively high surface area and wide pore size distribution. The contrast with the vacuum and freeze dried products (structurally collapsed) is easily observable by naked eye, as the side-by-side photo in FIG. 5 shows.
To correlate the effect of the drying step with the properties of the rGO materials, their electrochemical capacitive behavior was characterized by cyclic voltammetry (CV) and galvanostatic charge-discharge (GCD) in a three-electrodes configuration (FIG. 4). While a fairly rectangular shape was obtained for all cases (indicating a dominant EDLC-type behavior), both the electrodes using rGO/vacuum and rGO/freeze materials exhibited low current responses when compared to the CV profile of the rGO/CPD electrode (FIG. 4a). The pair of broad peaks at ˜0.3-0.4 V is attributed to the reversible redox reaction of residual oxygen-containing functional groups (e.g. hydroxyl, carbonyl and carboxyl), known to persist in the rGO materials30, 36. As for the GCD profiles in FIG. 4b, these repeatedly showed a slight non-linear shape, which confirmed the existence of both EDLC and pseudocapacitive responses in the materials. The calculated specific capacitance of the rGO/vacuum, rGO/freeze and rGO/CPD was 258, 262 and 441 F g−1, respectively. The rate capability of the rGO/CPD electrode was tested by calculating the specific capacitances at current densities from 1 to 8 A g−1 (FIG. 4c). The values extracted from the discharging curves were 441-419 F g−1, indicating a remarkable consistency in the electrochemical response. Finally, the stability of the rGO/CPD electrode was studied using GCD at a current density of 1 A g−1 for 200 cycles (FIG. 4d). One other rGO/CPD sample, also probed in a three-electrodes configuration, was cycled for a longer period of time (1000 cycles at 1 A g−1) and showed similar behavior (FIG. 11). While the initial drop was most likely due to an activation process,37 the results point to a long-term performance with full capacitance retention. Given the structural and chemical similarity of the materials, the excellent capacitance behavior and stability of rGO/CPD (almost two times higher than rGO/vacuum and rGO/freeze) can be attributed to the network of interconnected pores described above. The optimized network, where mesopores predominate, facilitates the rapid ion transportation and reversible adsorption of H+ and SO42− during charge/discharge processes. Note that the specific capacitance achieved for the rGO/CPD material is considerably greater than other values reported in the literature for analogous rGO materials, usually <300 F g−1 (cf. Table III)1,14,38-41.
Supporting Information
1. Experimental Section
1.1. Drying Equipment
The vacuum drying process was performed in a Thermo Scientific Lindberg Blue M vacuum oven. For the freeze drying process, a Labconco Freezone 2.5plus was used. Finally, the critical point drying was performed in a Leica EM CPD300. Sample holders can be used as shown in FIGS. 12-15.
1.2. Characterisation
The powder X-ray diffraction (XRD) analysis was performed on a diffractometer (Bruker D8 Advance) with Cu Kα radiation (λ=1.5418 Å). The morphology of the samples was observed with scanning electron microscopy (SEM) (FEI Quanta 600, 4 kV). N2 adsorption-desorption measurements were conducted at 77 K with a Micromeritics ASAP 2420 instrument. Prior to the analysis, the samples were degassed under vacuum at 80° C. for at least 12 h. The specific surface area was calculated using the Brunauer-Emmett-Teller (BET) method. The pore size distribution analysis in the mesopore range was performed using the Barrett-Joyner-Halenda. (BJH) formulism applied to the isotherm adsorption branch, and the full micro-meso pore size distribution was calculated using the DFT model assuming slit pores using the Microactive Interactive data analysis software. X-ray photoelectron spectroscopy (XPS) studies were carried out in a Kratos Axis Ultra DLD spectrometer equipped with a monochromatic Al Ka X-ray source (hv=1486.6 eV) operating at 150 W, a multi-channel plate and delay line detector under a vacuum of ˜10−9 mbar. The survey and high-resolution XPS spectra were collected at fixed analyzer pass energies of 160 eV and 20 eV, respectively. Samples were mounted in floating mode in order to avoid differential charging. Binding energies were referenced to the sp2 hybridized (C═C) carbon for the C 1s peak set at 284.4 eV.
1.3. Electrochemical Characterisation
For the electrochemical characterization, the working electrodes were prepared by mixing ˜2 mg of the selected rGO with 15 μl of Nafion (Sigma-Aldrich, 5 wt. %), 500 μl of deionized water (MilliQ, 18.2 MΩ·cm) and 500 μl of ethanol (Sigma-Aldrich, >99.8). The mixture was ultrasonicated for 30 min to form a homogenous slurry. The slurry was drop-cast onto the glassy carbon electrode (3 mm diameter) and dried under an incandescent bulb lamp for ˜10 min. All electrochemical experiments were carried out in 1 M H2SO4 at room temperature using a three-electrodes system, in which a Pt wire and a standard calomel electrode (SCE) were used as the counter and reference electrodes, respectively. Cyclic voltammetry (CV), at scan rates of 100 mV s−1, and galvanostatic charge-discharge runs were carried out using a BioLogic VMP3 electrochemical workstation. The specific capacitance was calculated from the CV and discharging curves according to the following equation:
Csp=(I×Δt)/(ΔV×m) (1)
where Csp (F g−1) is the specific capacitance of the electrode, I (A) is the discharging current, Δt (s) is the discharging time, ΔV (V) is the potential and m (g) is the mass of the rGO.
| TABLE II |
| Specific surface areas reported in the literature for rGO |
| using the hydrothermal reduction method. See also FIG. 16. |
| Surface area (m2/g) | Reference |
| 102 | J. Solid State Electrochem., 19 (2014), 361. |
| 62 | RSC Adv., 4 (2014), 42412. |
| 31 | Appl. Surf. Science, 358 (2015), 100. |
| 364 | This work |
| TABLE III |
| Electrochemical performance of rGOs reported in the literature. |
| Specific capacitance | ||
| Reduction method | (Fg−1) | Reference |
| Solvothermal | 276 @ 0.1 Ag−1 | J. Phys. Chem. C, 115 (2011), |
| (dried in vacuum) | 7120. | |
| Thermal | 227 @ 1 Ag−1 | Carbon, 50 (2012), 2179. |
| Thermal | 261 @ 0.4 Ag−1 | J. Power Sources, 198 (2012), |
| 423. | ||
| Hydrothermal | 139 @ 5 Ag−1 | J. Mater. Chem., 21 (2011), |
| (dried at 60° C.) | 3422. | |
| Hydrothermal | 90 @ 5 mA cm−2 | Russian J. Electrochem., 49 |
| (dried at 60° C. | (2013), 359-364. | |
| under vacuum) | ||
| Hydrothermal | 441 @ 1 Ag−1 | This work |
| (dried by CPD) | ||
REFERENCES
- 1. Zhao, B.; Liu, P.; Jiang, Y.; Pan, D.; Tao, H.; Song, J.; Fang, T.; Xu, W., Supercapacitor performances of thermally reduced graphene oxide. Journal of Power Sources 2012, 198, 423-427.
- 2. Li, D.; Muller, M. B.; Gilje, S.; Kaner, R. B.; Wallace, G. G., Processable aqueous dispersions of graphene nanosheets. Nat Nano 2008, 3 (2), 101-105.
- 3. Shin, H.-J.; Kim, K. K.; Benayad, A.; Yoon, S.-M.; Park, H. K.; Jung, I.-S.; Jin, M. H.; Jeong, H.-K.; Kim, J. M.; Choi, J.-Y.; Lee, Y. H., Efficient Reduction of Graphite Oxide by Sodium Borohydride and Its Effect on Electrical Conductance. Advanced Functional Materials 2009, 19 (12), 1987-1992.
- 4. Wang, X.; Xing, W.; Song, L.; Yang, H.; Hu, Y.; Yeoh, G. H., Fabrication and characterization of graphene-reinforced waterborne polyurethane nanocomposite coatings by the sol-gel method. Surface and Coatings Technology 2012, 206 (23), 4778-4784.
- 5. Schniepp, H. C.; Li, J.-L.; McAllister, M. J.; Sai, H.; Herrera-Alonso, M.; Adamson, D. H.; Prud'homme, R. K.; Car, R.; Saville, D. A.; Aksay, I. A., Functionalized Single Graphene Sheets Derived from Splitting Graphite Oxide. The Journal of Physical Chemistry B 2006, 110 (17), 8535-8539.
- 6. Xiao, Y.; Li, X.; Zai, J.; Wang, K.; Gong, Y.; Li, B.; Han, Q.; Qian, X., CoFe2O4-Graphene Nanocomposites Synthesized through An Ultrasonic Method with Enhanced Performances as Anode Materials for Li-ion Batteries. Nano-Micro Letters 2014, 6 (4), 307-315.
- 7. Song, Z.; Zhang, Y.; Liu, W.; Zhang, S.; Liu, G.; Chen, H.; Qiu, J., Hydrothermal synthesis and electrochemical performance of Co3O4/reduced graphene oxide nanosheet composites for supercapacitors. Electrochimica Acta 2013, 112, 120-126.
- 8. Nassar, M. Y.; Ahmed, I. S., Hydrothermal synthesis of cobalt carbonates using different counter ions: An efficient precursor to nano-sized cobalt oxide (Co3O4). Polyhedron 2011, 30 (15), 2431-2437.
- 9. Ciesielski, W.; Tomasik, P., Thermal properties of complexes of amaranthus starch with selected metal salts. Thermochim Acta 2003, 403.
- 10. Wang, H.; Cui, L.-F.; Yang, Y.; Sanchez Casalongue, H.; Robinson, J. T.; Liang, Y.; Cui, Y.; Dai, H., Mn3O4-Graphene Hybrid as a High-Capacity Anode Material for Lithium Ion Batteries. Journal of the American Chemical Society 2010, 132 (40), 13978-13980.
- 11. Li, Y.; Gao, W.; Ci, L.; Wang, C.; Ajayan, P. M., Catalytic performance of Pt nanoparticles on reduced graphene oxide for methanol electro-oxidation. Carbon 2010, 48 (4), 1124-1130.
- 12. Antony, R. P.; Preethi, L. K.; Gupta, B.; Mathews, T.; Dash, S.; Tyagi, A. K., Efficient electrocatalytic performance of thermally exfoliated reduced graphene oxide-Pt hybrid. Materials Research Bulletin 2015, 70, 60-67.
- 13. Gao, M.; Peh, C. K. N.; Ong, W. L.; Ho, G. W., Green chemistry synthesis of a nanocomposite graphene hydrogel with three-dimensional nano-mesopores for photocatalytic H2 production. RSC Advances 2013, 3 (32), 13169-13177.
- 14. Lin, Z.; Liu, Y.; Yao, Y.; Hildreth, O. J.; Li, Z.; Moon, K.; Wong, C.-p., Superior Capacitance of Functionalized Graphene. The Journal of Physical Chemistry C 2011, 115 (14), 7120-7125.
- 15. Low, Q. X.; Ho, G. W., Facile structural tuning and compositing of iron oxide-graphene anode towards enhanced supacapacitive performance. Nano Energy 2014, 5, 28-35.
- 16. Choi, H.-J.; Jung, S.-M.; Seo, J.-M.; Chang, D. W.; Dai, L.; Baek, J.-B., Graphene for energy conversion and storage in fuel cells and supercapacitors. Nano Energy 2012, 1 (4), 534-551.
- 17. Granadeiro, C. M.; Cruz, S. M. A.; Goncalves, G.; Marques, P. A. A. P.; Costa, P. M. F. J.; Ferreira, R. A. S.; Carlos, L. D.; Nogueira, H. I. S., Photoluminescent bimetallic-3-hydroxypicolinate/graphene oxide nanocomposite. RSC Advances 2012, 2 (25), 9443-9447.
- 18. Ma, X.; Tao, H.; Yang, K.; Feng, L.; Cheng, L.; Shi, X.; Li, Y.; Guo, L.; Liu, Z., A functionalized graphene oxide-iron oxide nanocomposite for magnetically targeted drug delivery, photothermal therapy, and magnetic resonance imaging. Nano Res. 2012, 5 (3), 199-212.
- 19. Zhao, C.; Chou, S.-L.; Wang, Y.; Zhou, C.; Liu, H.-K.; Dou, S.-X., A facile route to synthesize transition metal oxide/reduced graphene oxide composites and their lithium storage performance. RSC Advances 2013, 3 (37), 16597-16603.
- 20. Du, M.; Sun, J.; Chang, J.; Yang, F.; Shi, L.; Gao, L., Synthesis of nitrogen-doped reduced graphene oxide directly from nitrogen-doped graphene oxide as a high-performance lithium ion battery anode. RSC Advances 2014, 4 (80), 42412-42417.
- 21. Vermisoglou, E. C.; Giannakopoulou, T.; Romanos, G.; Giannouri, M.; Boukos, N.; Lei, C.; Lekakou, C.; Trapalis, C., Effect of hydrothermal reaction time and alkaline conditions on the electrochemical properties of reduced graphene oxide. Applied Surface Science 2015, 358, Part A, 100-109.
- 22. Park, S.; An, J.; Potts, J. R.; Velamakanni, A.; Murali, S.; Ruoff, R. S., Hydrazine-reduction of graphite- and graphene oxide. Carbon 2011, 49 (9), 3019-3023.
- 23. Wong, C. P. P.; Lai, C. W.; Lee, K. M.; Hamid, S. B. A., Advanced Chemical Reduction of Reduced Graphene Oxide and Its Photocatalytic Activity in Degrading Reactive Black 5. Materials 2015, 8 (10), 7118-7128.
- 24. Xu, C.; Shi, X.; Ji, A.; Shi, L.; Zhou, C.; Cui, Y., Fabrication and Characteristics of Reduced Graphene Oxide Produced with Different Green Reductants. PloS one 2015, 10 (12), e0144842.
- 25. Zhang, X.; Sui, Z.; Xu, B.; Yue, S.; Luo, Y.; Zhan, W.; Liu, B., Mechanically strong and highly conductive graphene aerogel and its use as electrodes for electrochemical power sources. Journal of Materials Chemistry 2011, 21 (18), 6494-6497.
- 26. Talbot, M. J.; White, R. G., Methanol fixation of plant tissue for Scanning Electron Microscopy improves preservation of tissue morphology and dimensions. Plant Methods 2013, 9 (1), 1-7.
- 27. Dohnalkova, A. C.; Marshall, M. J.; Arey, B. W.; Williams, K. H.; Buck, E. C.; Fredrickson, J. K., Imaging hydrated microbial extracellular polymers: comparative analysis by electron microscopy. Applied and environmental microbiology 2011, 77 (4), 1254-1262.
- 28. Lalwani, G.; Kwaczala, A. T.; Kanakia, S.; Patel, S. C.; Judex, S.; Sitharaman, B., Fabrication and characterization of three-dimensional macroscopic all-carbon scaffolds. Carbon 2013, 53, 90-100.
- 29. Marcano, D. C.; Kosynkin, D. V.; Berlin, J. M.; Sinitskii, A.; Sun, Z.; Slesarev, A.; Alemany, L. B.; Lu, W.; Tour, J. M., Improved Synthesis of Graphene Oxide. ACS Nano 2010, 4 (8), 4806-4814.
- 30. Alazmi, A.; Rasul, S.; Patole, S. P.; Costa, P. M., Comparative study of synthesis and reduction methods for graphene oxide. Polyhedron Forthcoming 2016;doi:10.1016/j.poly.2016.04.044).
- 31. Luo, Z.; Yang, D.; Qi, G.; Shang, J.; Yang, H.; Wang, Y.; Yuwen, L.; Yu, T.; Huang, W.; Wang, L., Microwave-assisted solvothermal preparation of nitrogen and sulfur co-doped reduced graphene oxide and graphene quantum dots hybrids for highly efficient oxygen reduction. Journal of Materials Chemistry A 2014, 2 (48), 20605-20611.
- 32. Sawangphruk, M.; Suksomboon, M.; Kongsupornsak, K.; Khuntilo, J.; Srimuk, P.; Sanguansak, Y.; Klunbud, P.; Suktha, P.; Chiochan, P., High-performance supercapacitors based on silver nanoparticle-polyaniline-graphene nanocomposites coated on flexible carbon fiber paper. Journal of Materials Chemistry A 2013, 1 (34), 9630-9636.
- 33. Ramimoghadam, D.; Bin Hussein, M. Z.; Taufiq-Yap, Y. H., Hydrothermal synthesis of zinc oxide nanoparticles using rice as soft biotemplate. Chemistry Central Journal 2013, 7 (1), 1-10.
- 34. Hayes, W. I.; Joseph, P.; Mughal, M. Z.; Papakonstantinou, P., Production of reduced graphene oxide via hydrothermal reduction in an aqueous sulphuric acid suspension and its electrochemical behaviour. Journal of solid state electrochemistry 2015, 19 (2), 361-380.
- 35. Feng, X., Nanocarbons for Advanced Energy Storage. Wiley: 2015.
- 36. Yan, J.; Wang, Q.; Wei, T.; Jiang, L.; Zhang, M.; Jing, X.; Fan, Z., Template-Assisted Low Temperature Synthesis of Functionalized Graphene for Ultrahigh Volumetric Performance Supercapacitors. ACS Nano 2014, 8 (5), 4720-4729.
- 37. Kumar, R.; Singh, R. K.; Savu, R.; Dubey, P. K.; Kumar, P.; Moshkalev, S. A., Microwave-assisted synthesis of void-induced graphene-wrapped nickel oxide hybrids for supercapacitor applications. RSC Advances 2016, 6 (32), 26612-26620.
- 38. Yan, J.; Liu, J.; Fan, Z.; Wei, T.; Zhang, L., High-performance supercapacitor electrodes based on highly corrugated graphene sheets. Carbon 2012, 50 (6), 2179-2188.
- 39. Shi, W.; Zhu, J.; Sim, D. H.; Tay, Y. Y.; Lu, Z.; Zhang, X.; Sharma, Y.; Srinivasan, M.; Zhang, H.; Hng, H. H.; Yan, Q., Achieving high specific charge capacitances in Fe3O4/reduced graphene oxide nanocomposites. Journal of Materials Chemistry 2011, 21 (10), 3422-3427.
- 40. He, P.; Yang, K.; Wang, W.; Dong, F.; Du, L.; Deng, Y., Reduced graphene oxide-CoFe2O4 composites for supercapacitor electrode. Russian Journal of Electrochemistry 2013, 49 (4), 359-364.
- 41. Bai, Y.; Rakhi, R. B.; Chen, W.; Alshareef, H. N., Effect of pH-induced chemical modification of hydrothermally reduced graphene oxide on supercapacitor performance. Journal of Power Sources 2013, 233, 313-319.
- 42. Kumar, N. A.; Choi, H.-J.; Shin, Y. R.; Chang, D. W.; Dai, L.; Baek, J.-B., Polyaniline-Grafted Reduced Graphene Oxide for Efficient Electrochemical Supercapacitors. ACS Nano 2012, 6 (2), 1715-1723.
- 43. Lim, H. N.; Huang, N. M.; Lim, S. S.; Harrison, I.; Chia, C. H., Fabrication and characterization of graphene hydrogel via hydrothermal approach as a scaffold for preliminary study of cell growth. International Journal of Nanomedicine 2011, 6, 1817-1823. ,
- 44. Kumar, N. A.; Gambarelli, S.; Duclairoir, F.; Bidan, G.; Dubois, L., Synthesis of high quality reduced graphene oxide nanosheets free of paramagnetic metallic impurities. Journal of Materials Chemistry A 2013, 1 (8), 2789-2794.
Embodiments for Carbon Dioxide Capture
Another application for the compositions and materials (and methods of making them) described herein is carbon dioxide capture. See, in particular, FIGS. 16-19. The effective capture of CO2 emitted by fossil-fuel-based power plants and other large industrial facilities is a top global priority to reduce the impact of global climate change and energy crisis (Chowdhury, S.; Balasubramanian, R., Highly efficient, rapid and selective CO2 capture by thermally treated graphene nanosheets. Journal of CO2 Utilization 2016, 13, 50-60). As a result, several adsorbent materials have been studied for separation and storage of CO2 from fuel gases and other industrial exhaust streams. Recently, graphite and graphene have received a great deal of attention for gas adsorption, however, there has been little work carried out on graphene oxide (GO) for gas adsorption (Table IV) (Burress, J. W.; Gadipelli, S.; Ford, J.; Simmons, J. M.; Zhou, W.; Yildirim, T., Graphene Oxide Framework Materials: Theoretical Predictions and Experimental Results. Angewandte Chemie International Edition 2010, 49 (47), 8902-8904).
Moreover, while GO with different degrees of oxidation and functionalization have been studied, the characterization of their porosity and/or gas adsorption properties is still overlooked. The most common GO production process is the so-called Hummer's method (or an adaptation of this). Not surprisingly, the few studies that have delved into CO2 capture using GO have been based in GO derived from the Hummer's method without serious concerns on the steps involved. One such step, that is key is the drying methodology used after the GO product is obtained. The reported specific surface area of GO materials are less than or about 100 m2 g−1 (Table V), possibly due to the GO pore network collapse and sheet re-aggregation taking place during the drying step.
In this study, we illustrate that GO can be turned into a potentially relevant gas storage material by using an adapted (“Improved”) Hummer's method that results in a material (improved GO, or IGO) with a higher degree of oxidation (A. Alazmi et al., Polyhedron, DOI: 10.1016/j.poly.2016.04.044). Depending on the post-synthesis drying method employed, it is possible to partially tune the pore width/volume and specific surface area of the GO material. In line with this, the effect of employing vacuum, freeze and critical point drying (CPD) on the morphology, specific surface area, porosity and gas adsorption properties of IGO can be and has been determined. Our findings demonstrate for the first time that the CPD process can have a positive influence on the characteristic of GO materials, and it represents an effective strategy in the design and development of GO-based solid adsorbents for CO2 capture.
Overall, GO-vacuum dried material and GO-freeze-dried material are exclusively made up of micro-pores in the material. On the other hand, the GO-CPD dried material comprises micro, meso and macro pores. At the range of pressure of 0-1 bar, the micro pores are filled, while the meso and macro pores will only be filled at higher pressures (>10 bar). From the t-plot, the micro pore volume of the GO-CPD is comparable with the micro pore volume of GO-Vacuum and GO-freeze (Table 4). This can explain the comparable CO2-uptake values for GO-vacuum dried, GO-freeze dried, and GO-CPD dried materials.
On the other hand, our observation demonstrated that the GO prepared using Improved-Hummers' method has higher CO2-uptake than the GO prepared using Hummers' method (FIG. 17). The filling of the meso/macro pores of GO-CPD at higher pressure (>10 bar) can improve the CO2-uptake value of these materials.
| TABLE IV |
| Comparison of CO2 adsorption by GO |
| Temperature | CO2 Uptake at 1 bar | |||||
| Adsorbent | Synthesis method | Drying method | Porosity | (K) | (mmol/g) | References |
| GO | GO by modified | at 60° C. | Micropores | 273 | 0.17 | International journal of |
| Hummers' method | hydrogen energy 39 (2014) | |||||
| 11047-11054 | ||||||
| GO | GO by modified | Under vacuum | Micropores | 273 | 0.93 | Xuetal. NanoscaleResearchLetters |
| Hummers' method | at 50° C. | (2015) 10: 318 | ||||
| GO | GO by improved | CPD | Micro/macropores | 273 | 1.8 | Our work |
| Hummers' | ||||||
| TABLE V |
| Comparison of specific surface area of GO |
| BET surface area | ||||
| Synthesis method | Starting material | Drying method | (m2/g) | References |
| GO | GO by Hummers' method | In vacuum | 68.3 | CARBON 50 (2012) 3724-3730 |
| GO from porous | GO by Hummers' method | In vacuum | 161 | Adv. Funct. Mater. 2010, 20, 1670-1679 |
| graphite (355 m2/g)+ | ||||
| GO from graphite | GO by modified Hummer's | freeze-dried | 102.29 | Journal of Solid State Electrochemistry, |
| (14.36 m2/g) | 2014. 19(2): p. 361-380 | |||
| GO | GO by modified Stau- | Dried at room | 5.7 | E. C. Vermisoglou et al./Applied Surface |
| denmaier's method [ | temperature | Science 358 (2015) 100-109 | ||
Claims
1-13. (canceled)
14. A composition comprising graphene oxide or reduced graphene oxide which is mesoporous and has a specific surface area of at least 364 m2/g.
15. The composition of claim 14, wherein the graphene oxide or reduced graphene oxide has micropores and mesopores.
16. The composition of claim 14, wherein the graphene oxide or reduced graphene oxide, when dried to a powder material with a critical point dryer, shows a predominance of mesopores over micropores and macropores.
17. The composition of claim 16, where the predominance of mesopores results in the improvement of a specific capacitance and/or a gas adsorption capability for the graphene oxide or reduced graphene oxide.
18. A composition prepared by a method comprising:
critical point drying at least one graphene oxide or reduced graphene oxide material with use of a critical point dryer to produce a dried graphene oxide or dried reduced graphene oxide material, wherein the critical point dryer is used with a sample holder comprising metal mesh, the metal mesh having pores having a pore width of 500 microns or less.
19. The composition of claim 18, wherein the metal mesh having pores has a pore width of 50 microns to 250 microns.
20. The composition of claim 18, wherein the graphene oxide or reduced graphene oxide has a specific surface area of at least 364 m2/g.
21. The composition of claim 18, wherein the graphene oxide or reduced graphene oxide has micropores and mesopores.
22. The composition of claim 18, wherein the graphene oxide or reduced graphene oxide, when dried to a powder material with a critical point dryer, shows a predominance of mesopores over micropores and macropores.
23. The composition of claim 22, where the predominance of mesopores results in the improvement of a specific capacitance and/or a gas adsorption capability for the reduced graphene oxide.
24. The composition of claim 18, wherein the method of preparing the composition further comprises:
hydrothermally reducing the at least one graphene oxide.
25. The composition of claim 24, wherein the method of preparing the composition further comprises:
performing additional critical point drying to the hydrothermally reduced at least one graphene oxide.
26. A method comprising:
critical point drying at least one graphene oxide material or reduced graphene oxide material with use of a critical point dryer to produce a dried graphene oxide material or reduced graphene oxide material, wherein the critical point dryer is used with a sample holder comprising metal mesh.
27. The method of claim 26, further comprising:
hydrothermally reducing the at least one graphene oxide.
28. The method of claim 27, further comprising:
performing additional critical point drying to the hydrothermally reduced at least one graphene oxide.
29. The method of claim 26, wherein the metal mesh has pores with a pore width of 500 microns or less.
30. The method of claim 26, wherein the metal mesh is stainless steel mesh.
31. The method of claim 30, wherein the sample holder comprises walls of a fluorinated polymer.
32. The method of claim 31, wherein the sample holder comprises walls of polytetrafluoroethylene.
33. The method of claim 26, wherein after the critical point drying, the graphene oxide or reduced graphene oxide has a specific surface area of at least 364 m2/g.
Images & Drawings included:


Sources:
- United States Patent and Trademark Office - verify current appl. status at the USPTO↗
Recent applications in this class:
- » 20250171313 2025-05-29
ELECTRODE MATERIALS, ELECTRODES, DEVICES, AND METHODS OF MAKING THEREOF - » 20250154009 2025-05-15
Mechanochemical process to produce exfoliated nanoparticles - » 20250033976 2025-01-30
A GRAPHENE OXIDE AEROGEL - » 20240343585 2024-10-17
GRAPHENE OXIDE DOUGHS - » 20240336485 2024-10-10
GRAPHITE OXIDE, GRAPHENE OXIDE, AND REDUCED GRAPHENE OXIDE - » 20240327223 2024-10-03
Method for preparing graphene-based sodium ion battery negative electrode material - » 20240246825 2024-07-25
METHODS OF GRAPHENE PRODUCTION & COMPOSITIONS THEREOF - » 20240217827 2024-07-04
GRAPHENE-BASED NANODEMULSIFIER - » 20240182310 2024-06-06
REDUCED GRAPHENE OXIDE FOR SECONDARY BATTERY, PREPARATION METHOD THEREFOR, AND ELECTRODE AND SECONDARY BATTERY WHICH USE SAME - » 20240174518 2024-05-30
Efficient microwave preparation method with one-step simultaneous reduction/embedding and application of metal monatomic-doped reduced graphene oxide dielectric material
Recent applications for this Assignee:
- » 20250290779 2025-09-18
COMPACT VENTURI WITH EMBEDDED DUAL MUTUALLY ORTHOGONAL RESONATOR (DMOR) SENSORS TO MEASURE MULTIPHASE FLOW RATES - » 20250256973 2025-08-14
STRUCTURES OF LAMELLAR MESOPOROUS CRYSTALLINE MICROPOROUS MATERIAL - » 20250256267 2025-08-14
PILLARED STRUCTURES OF LAMELLAR MESOPOROUS CRYSTALLINE MICROPOROUS MATERIAL - » 20250242321 2025-07-31
SYSTEMS AND METHODS FOR CRACKING HYDROCARBONS TO PRODUCE LIGHT OLEFINS - » 20250121364 2025-04-17
METHODS OF MAKING ZEOLITE BETA MATERIALS - » 20250051174 2025-02-13
MODIFIED ZEOLITES THAT INCLUDE TITANIUM ATOMS BONDED TO BRIDGING OXYGEN ATOMS AND METHODS FOR MAKING SUCH - » 20240424487 2024-12-26
MODIFIED ZEOLITES THAT INCLUDE ZIRCONIUM HYDRIDE MOIETIES AND METHODS FOR MAKING SUCH - » 20240416333 2024-12-19
MODIFIED ZEOLITES THAT INCLUDE HAFNIUM HYDRIDE MOIETIES AND METHODS FOR MAKING SUCH - » 20240416330 2024-12-19
ZEOLITE BETA PARTICLES WITH CENTER-RADIAL CONFIGURED MESOPORES AND METHODS OF MAKING THE SAME - » 20240399293 2024-12-05
PROCESSING OF SULFUR SPECIES WITH DEEP EUTECTIC SOLVENTS OR IONIC LIQUIDS